|
|
|
|
// Copyright (c) 2011-present, Facebook, Inc. All rights reserved.
|
|
|
|
|
// This source code is licensed under both the GPLv2 (found in the
|
|
|
|
|
// COPYING file in the root directory) and Apache 2.0 License
|
|
|
|
|
// (found in the LICENSE.Apache file in the root directory).
|
|
|
|
|
//
|
|
|
|
|
// Copyright (c) 2011 The LevelDB Authors. All rights reserved.
|
|
|
|
|
// Use of this source code is governed by a BSD-style license that can be
|
|
|
|
|
// found in the LICENSE file. See the AUTHORS file for names of contributors.
|
|
|
|
|
|
|
|
|
|
#ifdef GFLAGS
|
|
|
|
|
#ifdef NUMA
|
|
|
|
|
#include <numa.h>
|
|
|
|
|
#endif
|
|
|
|
|
#ifndef OS_WIN
|
|
|
|
|
#include <unistd.h>
|
|
|
|
|
#endif
|
|
|
|
|
#include <fcntl.h>
|
|
|
|
|
#include <stdio.h>
|
|
|
|
|
#include <stdlib.h>
|
|
|
|
|
#include <sys/types.h>
|
|
|
|
|
#ifdef __APPLE__
|
|
|
|
|
#include <mach/host_info.h>
|
|
|
|
|
#include <mach/mach_host.h>
|
|
|
|
|
#include <sys/sysctl.h>
|
|
|
|
|
#endif
|
|
|
|
|
#ifdef __FreeBSD__
|
|
|
|
|
#include <sys/sysctl.h>
|
|
|
|
|
#endif
|
db_bench periodically writes QPS to CSV file
Summary:
This is part of an effort to better understand and optimize RocksDB stalls under high load. I added a feature to db_bench to periodically write QPS to CSV files. That way we can nicely see how our QPS changes in time (especially when DB is stalled) and can do a better job of evaluating our stall system (i.e. we want the QPS to be as constant as possible, as opposed to having bunch of stalls)
Cool part of CSV files is that we can easily graph them -- there are a bunch of tools available.
Test Plan:
Ran ./db_bench --report_interval_seconds=10 --benchmarks=fillrandom --num=10000000
and observed this in report.csv:
secs_elapsed,interval_qps
10,2725860
20,1980480
30,1863456
40,1454359
50,1460389
Reviewers: sdong, MarkCallaghan, rven, yhchiang
Reviewed By: yhchiang
Subscribers: dhruba, leveldb
Differential Revision: https://reviews.facebook.net/D40047
9 years ago
|
|
|
#include <atomic>
|
|
|
|
|
#include <cinttypes>
|
db_bench periodically writes QPS to CSV file
Summary:
This is part of an effort to better understand and optimize RocksDB stalls under high load. I added a feature to db_bench to periodically write QPS to CSV files. That way we can nicely see how our QPS changes in time (especially when DB is stalled) and can do a better job of evaluating our stall system (i.e. we want the QPS to be as constant as possible, as opposed to having bunch of stalls)
Cool part of CSV files is that we can easily graph them -- there are a bunch of tools available.
Test Plan:
Ran ./db_bench --report_interval_seconds=10 --benchmarks=fillrandom --num=10000000
and observed this in report.csv:
secs_elapsed,interval_qps
10,2725860
20,1980480
30,1863456
40,1454359
50,1460389
Reviewers: sdong, MarkCallaghan, rven, yhchiang
Reviewed By: yhchiang
Subscribers: dhruba, leveldb
Differential Revision: https://reviews.facebook.net/D40047
9 years ago
|
|
|
#include <condition_variable>
|
|
|
|
|
#include <cstddef>
|
|
|
|
|
#include <iostream>
|
|
|
|
|
#include <memory>
|
db_bench periodically writes QPS to CSV file
Summary:
This is part of an effort to better understand and optimize RocksDB stalls under high load. I added a feature to db_bench to periodically write QPS to CSV files. That way we can nicely see how our QPS changes in time (especially when DB is stalled) and can do a better job of evaluating our stall system (i.e. we want the QPS to be as constant as possible, as opposed to having bunch of stalls)
Cool part of CSV files is that we can easily graph them -- there are a bunch of tools available.
Test Plan:
Ran ./db_bench --report_interval_seconds=10 --benchmarks=fillrandom --num=10000000
and observed this in report.csv:
secs_elapsed,interval_qps
10,2725860
20,1980480
30,1863456
40,1454359
50,1460389
Reviewers: sdong, MarkCallaghan, rven, yhchiang
Reviewed By: yhchiang
Subscribers: dhruba, leveldb
Differential Revision: https://reviews.facebook.net/D40047
9 years ago
|
|
|
#include <mutex>
|
|
|
|
|
#include <queue>
|
db_bench periodically writes QPS to CSV file
Summary:
This is part of an effort to better understand and optimize RocksDB stalls under high load. I added a feature to db_bench to periodically write QPS to CSV files. That way we can nicely see how our QPS changes in time (especially when DB is stalled) and can do a better job of evaluating our stall system (i.e. we want the QPS to be as constant as possible, as opposed to having bunch of stalls)
Cool part of CSV files is that we can easily graph them -- there are a bunch of tools available.
Test Plan:
Ran ./db_bench --report_interval_seconds=10 --benchmarks=fillrandom --num=10000000
and observed this in report.csv:
secs_elapsed,interval_qps
10,2725860
20,1980480
30,1863456
40,1454359
50,1460389
Reviewers: sdong, MarkCallaghan, rven, yhchiang
Reviewed By: yhchiang
Subscribers: dhruba, leveldb
Differential Revision: https://reviews.facebook.net/D40047
9 years ago
|
|
|
#include <thread>
|
|
|
|
|
#include <unordered_map>
|
db_bench periodically writes QPS to CSV file
Summary:
This is part of an effort to better understand and optimize RocksDB stalls under high load. I added a feature to db_bench to periodically write QPS to CSV files. That way we can nicely see how our QPS changes in time (especially when DB is stalled) and can do a better job of evaluating our stall system (i.e. we want the QPS to be as constant as possible, as opposed to having bunch of stalls)
Cool part of CSV files is that we can easily graph them -- there are a bunch of tools available.
Test Plan:
Ran ./db_bench --report_interval_seconds=10 --benchmarks=fillrandom --num=10000000
and observed this in report.csv:
secs_elapsed,interval_qps
10,2725860
20,1980480
30,1863456
40,1454359
50,1460389
Reviewers: sdong, MarkCallaghan, rven, yhchiang
Reviewed By: yhchiang
Subscribers: dhruba, leveldb
Differential Revision: https://reviews.facebook.net/D40047
9 years ago
|
|
|
|
|
|
|
|
#include "db/db_impl/db_impl.h"
|
|
|
|
|
#include "db/malloc_stats.h"
|
|
|
|
|
#include "db/version_set.h"
|
|
|
|
|
#include "monitoring/histogram.h"
|
|
|
|
|
#include "monitoring/statistics.h"
|
|
|
|
|
#include "options/cf_options.h"
|
|
|
|
|
#include "port/port.h"
|
|
|
|
|
#include "port/stack_trace.h"
|
|
|
|
|
#include "rocksdb/cache.h"
|
|
|
|
|
#include "rocksdb/convenience.h"
|
|
|
|
|
#include "rocksdb/db.h"
|
|
|
|
|
#include "rocksdb/env.h"
|
|
|
|
|
#include "rocksdb/filter_policy.h"
|
|
|
|
|
#include "rocksdb/memtablerep.h"
|
|
|
|
|
#include "rocksdb/options.h"
|
|
|
|
|
#include "rocksdb/perf_context.h"
|
|
|
|
|
#include "rocksdb/persistent_cache.h"
|
|
|
|
|
#include "rocksdb/rate_limiter.h"
|
|
|
|
|
#include "rocksdb/secondary_cache.h"
|
|
|
|
|
#include "rocksdb/slice.h"
|
|
|
|
|
#include "rocksdb/slice_transform.h"
|
|
|
|
|
#include "rocksdb/stats_history.h"
|

Implement XXH3 block checksum type (#9069)
Summary:
XXH3 - latest hash function that is extremely fast on large
data, easily faster than crc32c on most any x86_64 hardware. In
integrating this hash function, I have handled the compression type byte
in a non-standard way to avoid using the streaming API (extra data
movement and active code size because of hash function complexity). This
approach got a thumbs-up from Yann Collet.
Existing functionality change:
* reject bad ChecksumType in options with InvalidArgument
This change split off from https://github.com/facebook/rocksdb/issues/9058 because context-aware checksum is
likely to be handled through different configuration than ChecksumType.
Pull Request resolved: https://github.com/facebook/rocksdb/pull/9069
Test Plan:
tests updated, and substantially expanded. Unit tests now check
that we don't accidentally change the values generated by the checksum
algorithms ("schema test") and that we properly handle
invalid/unrecognized checksum types in options or in file footer.
DBTestBase::ChangeOptions (etc.) updated from two to one configuration
changing from default CRC32c ChecksumType. The point of this test code
is to detect possible interactions among features, and the likelihood of
some bad interaction being detected by including configurations other
than XXH3 and CRC32c--and then not detected by stress/crash test--is
extremely low.
Stress/crash test also updated (manual run long enough to see it accepts
new checksum type). db_bench also updated for microbenchmarking
checksums.
### Performance microbenchmark (PORTABLE=0 DEBUG_LEVEL=0, Broadwell processor)
./db_bench -benchmarks=crc32c,xxhash,xxhash64,xxh3,crc32c,xxhash,xxhash64,xxh3,crc32c,xxhash,xxhash64,xxh3
crc32c : 0.200 micros/op 5005220 ops/sec; 19551.6 MB/s (4096 per op)
xxhash : 0.807 micros/op 1238408 ops/sec; 4837.5 MB/s (4096 per op)
xxhash64 : 0.421 micros/op 2376514 ops/sec; 9283.3 MB/s (4096 per op)
xxh3 : 0.171 micros/op 5858391 ops/sec; 22884.3 MB/s (4096 per op)
crc32c : 0.206 micros/op 4859566 ops/sec; 18982.7 MB/s (4096 per op)
xxhash : 0.793 micros/op 1260850 ops/sec; 4925.2 MB/s (4096 per op)
xxhash64 : 0.410 micros/op 2439182 ops/sec; 9528.1 MB/s (4096 per op)
xxh3 : 0.161 micros/op 6202872 ops/sec; 24230.0 MB/s (4096 per op)
crc32c : 0.203 micros/op 4924686 ops/sec; 19237.1 MB/s (4096 per op)
xxhash : 0.839 micros/op 1192388 ops/sec; 4657.8 MB/s (4096 per op)
xxhash64 : 0.424 micros/op 2357391 ops/sec; 9208.6 MB/s (4096 per op)
xxh3 : 0.162 micros/op 6182678 ops/sec; 24151.1 MB/s (4096 per op)
As you can see, especially once warmed up, xxh3 is fastest.
### Performance macrobenchmark (PORTABLE=0 DEBUG_LEVEL=0, Broadwell processor)
Test
for I in `seq 1 50`; do for CHK in 0 1 2 3 4; do TEST_TMPDIR=/dev/shm/rocksdb$CHK ./db_bench -benchmarks=fillseq -memtablerep=vector -allow_concurrent_memtable_write=false -num=30000000 -checksum_type=$CHK 2>&1 | grep 'micros/op' | tee -a results-$CHK & done; wait; done
Results (ops/sec)
for FILE in results*; do echo -n "$FILE "; awk '{ s += $5; c++; } END { print 1.0 * s / c; }' < $FILE; done
results-0 252118 # kNoChecksum
results-1 251588 # kCRC32c
results-2 251863 # kxxHash
results-3 252016 # kxxHash64
results-4 252038 # kXXH3
Reviewed By: mrambacher
Differential Revision: D31905249
Pulled By: pdillinger
fbshipit-source-id: cb9b998ebe2523fc7c400eedf62124a78bf4b4d1
3 years ago
|
|
|
#include "rocksdb/table.h"
|
|
|
|
|
#include "rocksdb/utilities/object_registry.h"
|
|
|
|
|
#include "rocksdb/utilities/optimistic_transaction_db.h"
|
|
|
|
|
#include "rocksdb/utilities/options_type.h"
|
|
|
|
|
#include "rocksdb/utilities/options_util.h"
|
|
|
|
|
#ifndef ROCKSDB_LITE
|
|
|
|
|
#include "rocksdb/utilities/replayer.h"
|
|
|
|
|
#endif // ROCKSDB_LITE
|
|
|
|
|
#include "rocksdb/utilities/sim_cache.h"
|
Pessimistic Transactions
Summary:
Initial implementation of Pessimistic Transactions. This diff contains the api changes discussed in D38913. This diff is pretty large, so let me know if people would prefer to meet up to discuss it.
MyRocks folks: please take a look at the API in include/rocksdb/utilities/transaction[_db].h and let me know if you have any issues.
Also, you'll notice a couple of TODOs in the implementation of RollbackToSavePoint(). After chatting with Siying, I'm going to send out a separate diff for an alternate implementation of this feature that implements the rollback inside of WriteBatch/WriteBatchWithIndex. We can then decide which route is preferable.
Next, I'm planning on doing some perf testing and then integrating this diff into MongoRocks for further testing.
Test Plan: Unit tests, db_bench parallel testing.
Reviewers: igor, rven, sdong, yhchiang, yoshinorim
Reviewed By: sdong
Subscribers: hermanlee4, maykov, spetrunia, leveldb, dhruba
Differential Revision: https://reviews.facebook.net/D40869
9 years ago
|
|
|
#include "rocksdb/utilities/transaction.h"
|
|
|
|
|
#include "rocksdb/utilities/transaction_db.h"
|
|
|
|
|
#include "rocksdb/write_batch.h"
|
|
|
|
|
#include "test_util/testutil.h"
|
|
|
|
|
#include "test_util/transaction_test_util.h"
|
|
|
|
|
#include "tools/simulated_hybrid_file_system.h"
|
|
|
|
|
#include "util/cast_util.h"
|
|
|
|
|
#include "util/compression.h"
|
|
|
|
|
#include "util/crc32c.h"
|
|
|
|
|
#include "util/file_checksum_helper.h"
|
|
|
|
|
#include "util/gflags_compat.h"
|
|
|
|
|
#include "util/mutexlock.h"
|
|
|
|
|
#include "util/random.h"
|
|
|
|
|
#include "util/stderr_logger.h"
|
|
|
|
|
#include "util/string_util.h"
|
|
|
|
|
#include "util/xxhash.h"
|
|
|
|
|
#include "utilities/blob_db/blob_db.h"
|
|
|
|
|
#include "utilities/counted_fs.h"
|
Benchmarking for Merge Operator
Summary:
Updated db_bench and utilities/merge_operators.h to allow for dynamic benchmarking
of merge operators in db_bench. Added a new test (--benchmarks=mergerandom), which performs
a bunch of random Merge() operations over random keys. Also added a "--merge_operator=" flag
so that the tester can easily benchmark different merge operators. Currently supports
the PutOperator and UInt64Add operator. Support for stringappend or list append may come later.
Test Plan:
1. make db_bench
2. Test the PutOperator (simulating Put) as follows:
./db_bench --benchmarks=fillrandom,readrandom,updaterandom,readrandom,mergerandom,readrandom --merge_operator=put
--threads=2
3. Test the UInt64AddOperator (simulating numeric addition) similarly:
./db_bench --value_size=8 --benchmarks=fillrandom,readrandom,updaterandom,readrandom,mergerandom,readrandom
--merge_operator=uint64add --threads=2
Reviewers: haobo, dhruba, zshao, MarkCallaghan
Reviewed By: haobo
CC: leveldb
Differential Revision: https://reviews.facebook.net/D11535
11 years ago
|
|
|
#include "utilities/merge_operators.h"
|
|
|
|
|
#include "utilities/merge_operators/bytesxor.h"
|
New API to get all merge operands for a Key (#5604)
Summary:
This is a new API added to db.h to allow for fetching all merge operands associated with a Key. The main motivation for this API is to support use cases where doing a full online merge is not necessary as it is performance sensitive. Example use-cases:
1. Update subset of columns and read subset of columns -
Imagine a SQL Table, a row is encoded as a K/V pair (as it is done in MyRocks). If there are many columns and users only updated one of them, we can use merge operator to reduce write amplification. While users only read one or two columns in the read query, this feature can avoid a full merging of the whole row, and save some CPU.
2. Updating very few attributes in a value which is a JSON-like document -
Updating one attribute can be done efficiently using merge operator, while reading back one attribute can be done more efficiently if we don't need to do a full merge.
----------------------------------------------------------------------------------------------------
API :
Status GetMergeOperands(
const ReadOptions& options, ColumnFamilyHandle* column_family,
const Slice& key, PinnableSlice* merge_operands,
GetMergeOperandsOptions* get_merge_operands_options,
int* number_of_operands)
Example usage :
int size = 100;
int number_of_operands = 0;
std::vector<PinnableSlice> values(size);
GetMergeOperandsOptions merge_operands_info;
db_->GetMergeOperands(ReadOptions(), db_->DefaultColumnFamily(), "k1", values.data(), merge_operands_info, &number_of_operands);
Description :
Returns all the merge operands corresponding to the key. If the number of merge operands in DB is greater than merge_operands_options.expected_max_number_of_operands no merge operands are returned and status is Incomplete. Merge operands returned are in the order of insertion.
merge_operands-> Points to an array of at-least merge_operands_options.expected_max_number_of_operands and the caller is responsible for allocating it. If the status returned is Incomplete then number_of_operands will contain the total number of merge operands found in DB for key.
Pull Request resolved: https://github.com/facebook/rocksdb/pull/5604
Test Plan:
Added unit test and perf test in db_bench that can be run using the command:
./db_bench -benchmarks=getmergeoperands --merge_operator=sortlist
Differential Revision: D16657366
Pulled By: vjnadimpalli
fbshipit-source-id: 0faadd752351745224ee12d4ae9ef3cb529951bf
5 years ago
|
|
|
#include "utilities/merge_operators/sortlist.h"
|
|
|
|
|
#include "utilities/persistent_cache/block_cache_tier.h"
|
|
|
|
|
|
Provide an allocator for new memory type to be used with RocksDB block cache (#6214)
Summary:
New memory technologies are being developed by various hardware vendors (Intel DCPMM is one such technology currently available). These new memory types require different libraries for allocation and management (such as PMDK and memkind). The high capacities available make it possible to provision large caches (up to several TBs in size), beyond what is achievable with DRAM.
The new allocator provided in this PR uses the memkind library to allocate memory on different media.
**Performance**
We tested the new allocator using db_bench.
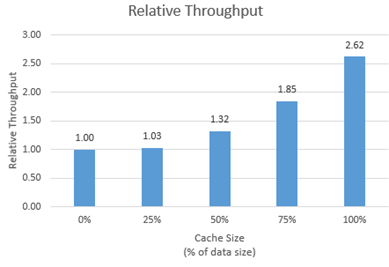
- For each test, we vary the size of the block cache (relative to the size of the uncompressed data in the database).
- The database is filled sequentially. Throughput is then measured with a readrandom benchmark.
- We use a uniform distribution as a worst-case scenario.
The plot shows throughput (ops/s) relative to a configuration with no block cache and default allocator.
For all tests, p99 latency is below 500 us.
**Changes**
- Add MemkindKmemAllocator
- Add --use_cache_memkind_kmem_allocator db_bench option (to create an LRU block cache with the new allocator)
- Add detection of memkind library with KMEM DAX support
- Add test for MemkindKmemAllocator
**Minimum Requirements**
- kernel 5.3.12
- ndctl v67 - https://github.com/pmem/ndctl
- memkind v1.10.0 - https://github.com/memkind/memkind
**Memory Configuration**
The allocator uses the MEMKIND_DAX_KMEM memory kind. Follow the instructions on[ memkind’s GitHub page](https://github.com/memkind/memkind) to set up NVDIMM memory accordingly.
Note on memory allocation with NVDIMM memory exposed as system memory.
- The MemkindKmemAllocator will only allocate from NVDIMM memory (using memkind_malloc with MEMKIND_DAX_KMEM kind).
- The default allocator is not restricted to RAM by default. Based on NUMA node latency, the kernel should allocate from local RAM preferentially, but it’s a kernel decision. numactl --preferred/--membind can be used to allocate preferentially/exclusively from the local RAM node.
**Usage**
When creating an LRU cache, pass a MemkindKmemAllocator object as argument.
For example (replace capacity with the desired value in bytes):
```
#include "rocksdb/cache.h"
#include "memory/memkind_kmem_allocator.h"
NewLRUCache(
capacity /*size_t*/,
6 /*cache_numshardbits*/,
false /*strict_capacity_limit*/,
false /*cache_high_pri_pool_ratio*/,
std::make_shared<MemkindKmemAllocator>());
```
Refer to [RocksDB’s block cache documentation](https://github.com/facebook/rocksdb/wiki/Block-Cache) to assign the LRU cache as block cache for a database.
Pull Request resolved: https://github.com/facebook/rocksdb/pull/6214
Reviewed By: cheng-chang
Differential Revision: D19292435
fbshipit-source-id: 7202f47b769e7722b539c86c2ffd669f64d7b4e1
4 years ago
|
|
|
#ifdef MEMKIND
|
|
|
|
|
#include "memory/memkind_kmem_allocator.h"
|
|
|
|
|
#endif
|
|
|
|
|
|
|
|
|
|
#ifdef OS_WIN
|
|
|
|
|
#include <io.h> // open/close
|
|
|
|
|
#endif
|
|
|
|
|
|
|
|
|
|
using GFLAGS_NAMESPACE::ParseCommandLineFlags;
|
|
|
|
|
using GFLAGS_NAMESPACE::RegisterFlagValidator;
|
|
|
|
|
using GFLAGS_NAMESPACE::SetUsageMessage;
|
|
|
|
|
|
|
|
|
|
#ifdef ROCKSDB_LITE
|
|
|
|
|
#define IF_ROCKSDB_LITE(Then, Else) Then
|
|
|
|
|
#else
|
|
|
|
|
#define IF_ROCKSDB_LITE(Then, Else) Else
|
|
|
|
|
#endif
|
|
|
|
|
|
|
|
|
|
DEFINE_string(
|
|
|
|
|
benchmarks,
|
|
|
|
|
"fillseq,"
|
|
|
|
|
"fillseqdeterministic,"
|
|
|
|
|
"fillsync,"
|
|
|
|
|
"fillrandom,"
|
|
|
|
|
"filluniquerandomdeterministic,"
|
|
|
|
|
"overwrite,"
|
|
|
|
|
"readrandom,"
|
|
|
|
|
"newiterator,"
|
|
|
|
|
"newiteratorwhilewriting,"
|
|
|
|
|
"seekrandom,"
|
|
|
|
|
"seekrandomwhilewriting,"
|
|
|
|
|
"seekrandomwhilemerging,"
|
|
|
|
|
"readseq,"
|
|
|
|
|
"readreverse,"
|
|
|
|
|
"compact,"
|
|
|
|
|
"compactall,"
|
|
|
|
|
"flush,"
|
|
|
|
|
IF_ROCKSDB_LITE("",
|
|
|
|
|
"compact0,"
|
|
|
|
|
"compact1,"
|
|
|
|
|
"waitforcompaction,"
|
|
|
|
|
)
|
|
|
|
|
"multireadrandom,"
|
Generate mixed workload with Get, Put, Seek in db_bench (#4788)
Summary:
Based on the specific workload models (key access distribution, value size distribution, and iterator scan length distribution, the QPS variation), the MixGraph benchmark generate the synthetic workload according to these distributions which can reflect the real-world workload characteristics.
After user enable the tracing function, they will get the trace file. By analyzing the trace file with the trace_analyzer tool, user can generate a set of statistic data files including. The *_accessed_key_stats.txt, *-accessed_value_size_distribution.txt, *-iterator_length_distribution.txt, and *-qps_stats.txt are mainly used to fit the Matlab model fitting. After that, user can get the parameters of the workload distributions (the modeling details are described: [here](https://github.com/facebook/rocksdb/wiki/RocksDB-Trace%2C-Replay%2C-and-Analyzer))
The key access distribution follows the The two-term power model. The probability density function is: `f(x) = ax^{b}+c`. The corresponding parameters are key_dist_a, key_dist_b, and key_dist_c in db_bench
For the value size distribution and iterator scan length distribution, they both follow the Generalized Pareto Distribution. The probability density function is `f(x) = (1/sigma)(1+k*(x-theta)/sigma))^{-1-1/k)`. The parameters are: value_k, value_theta, value_sigma and iter_k, iter_theta, iter_sigma. For more information about the Generalized Pareto Distribution, users can find the [wiki](https://en.wikipedia.org/wiki/Generalized_Pareto_distribution) and [Matalb page](https://www.mathworks.com/help/stats/generalized-pareto-distribution.html)
As for the QPS, it follows the diurnal pattern. So Sine is a good model to fit it. `F(x) = sine_a*sin(sine_b*x + sine_c) + sine_d`. The trace_will tell you the average QPS in the print out resutls, which is sine_d. After user fit the "*-qps_stats.txt" to the Matlab model, user can get the sine_a, sine_b, and sine_c. By using the 4 parameters, user can control the QPS variation including the period, average, changes.
To use the bench mark, user can indicate the following parameters as examples:
```
-benchmarks="mixgraph" -key_dist_a=0.002312 -key_dist_b=0.3467 -value_k=0.9233 -value_sigma=226.4092 -iter_k=2.517 -iter_sigma=14.236 -mix_get_ratio=0.7 -mix_put_ratio=0.25 -mix_seek_ratio=0.05 -sine_mix_rate_interval_milliseconds=500 -sine_a=15000 -sine_b=1 -sine_d=20000
```
Pull Request resolved: https://github.com/facebook/rocksdb/pull/4788
Differential Revision: D13573940
Pulled By: sagar0
fbshipit-source-id: e184c27e07b4f1bc0b436c2be36c5090c1fb0222
6 years ago
|
|
|
"mixgraph,"
|
|
|
|
|
"readseq,"
|
|
|
|
|
"readtorowcache,"
|
|
|
|
|
"readtocache,"
|
|
|
|
|
"readreverse,"
|
|
|
|
|
"readwhilewriting,"
|
|
|
|
|
"readwhilemerging,"
|
|
|
|
|
"readwhilescanning,"
|
|
|
|
|
"readrandomwriterandom,"
|
|
|
|
|
"updaterandom,"
|
|
|
|
|
"xorupdaterandom,"
|
For ApproximateSizes, pro-rate table metadata size over data blocks (#6784)
Summary:
The implementation of GetApproximateSizes was inconsistent in
its treatment of the size of non-data blocks of SST files, sometimes
including and sometimes now. This was at its worst with large portion
of table file used by filters and querying a small range that crossed
a table boundary: the size estimate would include large filter size.
It's conceivable that someone might want only to know the size in terms
of data blocks, but I believe that's unlikely enough to ignore for now.
Similarly, there's no evidence the internal function AppoximateOffsetOf
is used for anything other than a one-sided ApproximateSize, so I intend
to refactor to remove redundancy in a follow-up commit.
So to fix this, GetApproximateSizes (and implementation details
ApproximateSize and ApproximateOffsetOf) now consistently include in
their returned sizes a portion of table file metadata (incl filters
and indexes) based on the size portion of the data blocks in range. In
other words, if a key range covers data blocks that are X% by size of all
the table's data blocks, returned approximate size is X% of the total
file size. It would technically be more accurate to attribute metadata
based on number of keys, but that's not computationally efficient with
data available and rarely a meaningful difference.
Also includes miscellaneous comment improvements / clarifications.
Also included is a new approximatesizerandom benchmark for db_bench.
No significant performance difference seen with this change, whether ~700 ops/sec with cache_index_and_filter_blocks and small cache or ~150k ops/sec without cache_index_and_filter_blocks.
Pull Request resolved: https://github.com/facebook/rocksdb/pull/6784
Test Plan:
Test added to DBTest.ApproximateSizesFilesWithErrorMargin.
Old code running new test...
[ RUN ] DBTest.ApproximateSizesFilesWithErrorMargin
db/db_test.cc:1562: Failure
Expected: (size) <= (11 * 100), actual: 9478 vs 1100
Other tests updated to reflect consistent accounting of metadata.
Reviewed By: siying
Differential Revision: D21334706
Pulled By: pdillinger
fbshipit-source-id: 6f86870e45213334fedbe9c73b4ebb1d8d611185
4 years ago
|
|
|
"approximatesizerandom,"
|
|
|
|
|
"randomwithverify,"
|
|
|
|
|
"fill100K,"
|
|
|
|
|
"crc32c,"
|
|
|
|
|
"xxhash,"
|
Implement XXH3 block checksum type (#9069)
Summary:
XXH3 - latest hash function that is extremely fast on large
data, easily faster than crc32c on most any x86_64 hardware. In
integrating this hash function, I have handled the compression type byte
in a non-standard way to avoid using the streaming API (extra data
movement and active code size because of hash function complexity). This
approach got a thumbs-up from Yann Collet.
Existing functionality change:
* reject bad ChecksumType in options with InvalidArgument
This change split off from https://github.com/facebook/rocksdb/issues/9058 because context-aware checksum is
likely to be handled through different configuration than ChecksumType.
Pull Request resolved: https://github.com/facebook/rocksdb/pull/9069
Test Plan:
tests updated, and substantially expanded. Unit tests now check
that we don't accidentally change the values generated by the checksum
algorithms ("schema test") and that we properly handle
invalid/unrecognized checksum types in options or in file footer.
DBTestBase::ChangeOptions (etc.) updated from two to one configuration
changing from default CRC32c ChecksumType. The point of this test code
is to detect possible interactions among features, and the likelihood of
some bad interaction being detected by including configurations other
than XXH3 and CRC32c--and then not detected by stress/crash test--is
extremely low.
Stress/crash test also updated (manual run long enough to see it accepts
new checksum type). db_bench also updated for microbenchmarking
checksums.
### Performance microbenchmark (PORTABLE=0 DEBUG_LEVEL=0, Broadwell processor)
./db_bench -benchmarks=crc32c,xxhash,xxhash64,xxh3,crc32c,xxhash,xxhash64,xxh3,crc32c,xxhash,xxhash64,xxh3
crc32c : 0.200 micros/op 5005220 ops/sec; 19551.6 MB/s (4096 per op)
xxhash : 0.807 micros/op 1238408 ops/sec; 4837.5 MB/s (4096 per op)
xxhash64 : 0.421 micros/op 2376514 ops/sec; 9283.3 MB/s (4096 per op)
xxh3 : 0.171 micros/op 5858391 ops/sec; 22884.3 MB/s (4096 per op)
crc32c : 0.206 micros/op 4859566 ops/sec; 18982.7 MB/s (4096 per op)
xxhash : 0.793 micros/op 1260850 ops/sec; 4925.2 MB/s (4096 per op)
xxhash64 : 0.410 micros/op 2439182 ops/sec; 9528.1 MB/s (4096 per op)
xxh3 : 0.161 micros/op 6202872 ops/sec; 24230.0 MB/s (4096 per op)
crc32c : 0.203 micros/op 4924686 ops/sec; 19237.1 MB/s (4096 per op)
xxhash : 0.839 micros/op 1192388 ops/sec; 4657.8 MB/s (4096 per op)
xxhash64 : 0.424 micros/op 2357391 ops/sec; 9208.6 MB/s (4096 per op)
xxh3 : 0.162 micros/op 6182678 ops/sec; 24151.1 MB/s (4096 per op)
As you can see, especially once warmed up, xxh3 is fastest.
### Performance macrobenchmark (PORTABLE=0 DEBUG_LEVEL=0, Broadwell processor)
Test
for I in `seq 1 50`; do for CHK in 0 1 2 3 4; do TEST_TMPDIR=/dev/shm/rocksdb$CHK ./db_bench -benchmarks=fillseq -memtablerep=vector -allow_concurrent_memtable_write=false -num=30000000 -checksum_type=$CHK 2>&1 | grep 'micros/op' | tee -a results-$CHK & done; wait; done
Results (ops/sec)
for FILE in results*; do echo -n "$FILE "; awk '{ s += $5; c++; } END { print 1.0 * s / c; }' < $FILE; done
results-0 252118 # kNoChecksum
results-1 251588 # kCRC32c
results-2 251863 # kxxHash
results-3 252016 # kxxHash64
results-4 252038 # kXXH3
Reviewed By: mrambacher
Differential Revision: D31905249
Pulled By: pdillinger
fbshipit-source-id: cb9b998ebe2523fc7c400eedf62124a78bf4b4d1
3 years ago
|
|
|
"xxhash64,"
|
|
|
|
|
"xxh3,"
|
|
|
|
|
"compress,"
|
|
|
|
|
"uncompress,"
|
|
|
|
|
"acquireload,"
|
|
|
|
|
"fillseekseq,"
|
|
|
|
|
"randomtransaction,"
|
|
|
|
|
"randomreplacekeys,"
|
New API to get all merge operands for a Key (#5604)
Summary:
This is a new API added to db.h to allow for fetching all merge operands associated with a Key. The main motivation for this API is to support use cases where doing a full online merge is not necessary as it is performance sensitive. Example use-cases:
1. Update subset of columns and read subset of columns -
Imagine a SQL Table, a row is encoded as a K/V pair (as it is done in MyRocks). If there are many columns and users only updated one of them, we can use merge operator to reduce write amplification. While users only read one or two columns in the read query, this feature can avoid a full merging of the whole row, and save some CPU.
2. Updating very few attributes in a value which is a JSON-like document -
Updating one attribute can be done efficiently using merge operator, while reading back one attribute can be done more efficiently if we don't need to do a full merge.
----------------------------------------------------------------------------------------------------
API :
Status GetMergeOperands(
const ReadOptions& options, ColumnFamilyHandle* column_family,
const Slice& key, PinnableSlice* merge_operands,
GetMergeOperandsOptions* get_merge_operands_options,
int* number_of_operands)
Example usage :
int size = 100;
int number_of_operands = 0;
std::vector<PinnableSlice> values(size);
GetMergeOperandsOptions merge_operands_info;
db_->GetMergeOperands(ReadOptions(), db_->DefaultColumnFamily(), "k1", values.data(), merge_operands_info, &number_of_operands);
Description :
Returns all the merge operands corresponding to the key. If the number of merge operands in DB is greater than merge_operands_options.expected_max_number_of_operands no merge operands are returned and status is Incomplete. Merge operands returned are in the order of insertion.
merge_operands-> Points to an array of at-least merge_operands_options.expected_max_number_of_operands and the caller is responsible for allocating it. If the status returned is Incomplete then number_of_operands will contain the total number of merge operands found in DB for key.
Pull Request resolved: https://github.com/facebook/rocksdb/pull/5604
Test Plan:
Added unit test and perf test in db_bench that can be run using the command:
./db_bench -benchmarks=getmergeoperands --merge_operator=sortlist
Differential Revision: D16657366
Pulled By: vjnadimpalli
fbshipit-source-id: 0faadd752351745224ee12d4ae9ef3cb529951bf
5 years ago
|
|
|
"timeseries,"
|
|
|
|
|
"getmergeoperands",
|
|
|
|
|
"readrandomoperands,"
|
|
|
|
|
|
|
|
|
|
"Comma-separated list of operations to run in the specified"
|
|
|
|
|
" order. Available benchmarks:\n"
|
|
|
|
|
"\tfillseq -- write N values in sequential key"
|
|
|
|
|
" order in async mode\n"
|
|
|
|
|
"\tfillseqdeterministic -- write N values in the specified"
|
|
|
|
|
" key order and keep the shape of the LSM tree\n"
|
|
|
|
|
"\tfillrandom -- write N values in random key order in async"
|
|
|
|
|
" mode\n"
|
|
|
|
|
"\tfilluniquerandomdeterministic -- write N values in a random"
|
|
|
|
|
" key order and keep the shape of the LSM tree\n"
|
|
|
|
|
"\toverwrite -- overwrite N values in random key order in"
|
|
|
|
|
" async mode\n"
|
|
|
|
|
"\tfillsync -- write N/1000 values in random key order in "
|
|
|
|
|
"sync mode\n"
|
|
|
|
|
"\tfill100K -- write N/1000 100K values in random order in"
|
|
|
|
|
" async mode\n"
|
|
|
|
|
"\tdeleteseq -- delete N keys in sequential order\n"
|
|
|
|
|
"\tdeleterandom -- delete N keys in random order\n"
|
|
|
|
|
"\treadseq -- read N times sequentially\n"
|
|
|
|
|
"\treadtocache -- 1 thread reading database sequentially\n"
|
|
|
|
|
"\treadreverse -- read N times in reverse order\n"
|
|
|
|
|
"\treadrandom -- read N times in random order\n"
|
|
|
|
|
"\treadmissing -- read N missing keys in random order\n"
|
|
|
|
|
"\treadwhilewriting -- 1 writer, N threads doing random "
|
|
|
|
|
"reads\n"
|
|
|
|
|
"\treadwhilemerging -- 1 merger, N threads doing random "
|
|
|
|
|
"reads\n"
|
|
|
|
|
"\treadwhilescanning -- 1 thread doing full table scan, "
|
|
|
|
|
"N threads doing random reads\n"
|
|
|
|
|
"\treadrandomwriterandom -- N threads doing random-read, "
|
|
|
|
|
"random-write\n"
|
|
|
|
|
"\tupdaterandom -- N threads doing read-modify-write for random "
|
|
|
|
|
"keys\n"
|
|
|
|
|
"\txorupdaterandom -- N threads doing read-XOR-write for "
|
|
|
|
|
"random keys\n"
|
|
|
|
|
"\tappendrandom -- N threads doing read-modify-write with "
|
|
|
|
|
"growing values\n"
|
|
|
|
|
"\tmergerandom -- same as updaterandom/appendrandom using merge"
|
|
|
|
|
" operator. "
|
|
|
|
|
"Must be used with merge_operator\n"
|
|
|
|
|
"\treadrandommergerandom -- perform N random read-or-merge "
|
|
|
|
|
"operations. Must be used with merge_operator\n"
|
|
|
|
|
"\tnewiterator -- repeated iterator creation\n"
|
|
|
|
|
"\tseekrandom -- N random seeks, call Next seek_nexts times "
|
|
|
|
|
"per seek\n"
|
|
|
|
|
"\tseekrandomwhilewriting -- seekrandom and 1 thread doing "
|
|
|
|
|
"overwrite\n"
|
|
|
|
|
"\tseekrandomwhilemerging -- seekrandom and 1 thread doing "
|
|
|
|
|
"merge\n"
|
Implement XXH3 block checksum type (#9069)
Summary:
XXH3 - latest hash function that is extremely fast on large
data, easily faster than crc32c on most any x86_64 hardware. In
integrating this hash function, I have handled the compression type byte
in a non-standard way to avoid using the streaming API (extra data
movement and active code size because of hash function complexity). This
approach got a thumbs-up from Yann Collet.
Existing functionality change:
* reject bad ChecksumType in options with InvalidArgument
This change split off from https://github.com/facebook/rocksdb/issues/9058 because context-aware checksum is
likely to be handled through different configuration than ChecksumType.
Pull Request resolved: https://github.com/facebook/rocksdb/pull/9069
Test Plan:
tests updated, and substantially expanded. Unit tests now check
that we don't accidentally change the values generated by the checksum
algorithms ("schema test") and that we properly handle
invalid/unrecognized checksum types in options or in file footer.
DBTestBase::ChangeOptions (etc.) updated from two to one configuration
changing from default CRC32c ChecksumType. The point of this test code
is to detect possible interactions among features, and the likelihood of
some bad interaction being detected by including configurations other
than XXH3 and CRC32c--and then not detected by stress/crash test--is
extremely low.
Stress/crash test also updated (manual run long enough to see it accepts
new checksum type). db_bench also updated for microbenchmarking
checksums.
### Performance microbenchmark (PORTABLE=0 DEBUG_LEVEL=0, Broadwell processor)
./db_bench -benchmarks=crc32c,xxhash,xxhash64,xxh3,crc32c,xxhash,xxhash64,xxh3,crc32c,xxhash,xxhash64,xxh3
crc32c : 0.200 micros/op 5005220 ops/sec; 19551.6 MB/s (4096 per op)
xxhash : 0.807 micros/op 1238408 ops/sec; 4837.5 MB/s (4096 per op)
xxhash64 : 0.421 micros/op 2376514 ops/sec; 9283.3 MB/s (4096 per op)
xxh3 : 0.171 micros/op 5858391 ops/sec; 22884.3 MB/s (4096 per op)
crc32c : 0.206 micros/op 4859566 ops/sec; 18982.7 MB/s (4096 per op)
xxhash : 0.793 micros/op 1260850 ops/sec; 4925.2 MB/s (4096 per op)
xxhash64 : 0.410 micros/op 2439182 ops/sec; 9528.1 MB/s (4096 per op)
xxh3 : 0.161 micros/op 6202872 ops/sec; 24230.0 MB/s (4096 per op)
crc32c : 0.203 micros/op 4924686 ops/sec; 19237.1 MB/s (4096 per op)
xxhash : 0.839 micros/op 1192388 ops/sec; 4657.8 MB/s (4096 per op)
xxhash64 : 0.424 micros/op 2357391 ops/sec; 9208.6 MB/s (4096 per op)
xxh3 : 0.162 micros/op 6182678 ops/sec; 24151.1 MB/s (4096 per op)
As you can see, especially once warmed up, xxh3 is fastest.
### Performance macrobenchmark (PORTABLE=0 DEBUG_LEVEL=0, Broadwell processor)
Test
for I in `seq 1 50`; do for CHK in 0 1 2 3 4; do TEST_TMPDIR=/dev/shm/rocksdb$CHK ./db_bench -benchmarks=fillseq -memtablerep=vector -allow_concurrent_memtable_write=false -num=30000000 -checksum_type=$CHK 2>&1 | grep 'micros/op' | tee -a results-$CHK & done; wait; done
Results (ops/sec)
for FILE in results*; do echo -n "$FILE "; awk '{ s += $5; c++; } END { print 1.0 * s / c; }' < $FILE; done
results-0 252118 # kNoChecksum
results-1 251588 # kCRC32c
results-2 251863 # kxxHash
results-3 252016 # kxxHash64
results-4 252038 # kXXH3
Reviewed By: mrambacher
Differential Revision: D31905249
Pulled By: pdillinger
fbshipit-source-id: cb9b998ebe2523fc7c400eedf62124a78bf4b4d1
3 years ago
|
|
|
"\tcrc32c -- repeated crc32c of <block size> data\n"
|
|
|
|
|
"\txxhash -- repeated xxHash of <block size> data\n"
|
|
|
|
|
"\txxhash64 -- repeated xxHash64 of <block size> data\n"
|
|
|
|
|
"\txxh3 -- repeated XXH3 of <block size> data\n"
|
|
|
|
|
"\tacquireload -- load N*1000 times\n"
|
|
|
|
|
"\tfillseekseq -- write N values in sequential key, then read "
|
|
|
|
|
"them by seeking to each key\n"
|
|
|
|
|
"\trandomtransaction -- execute N random transactions and "
|
|
|
|
|
"verify correctness\n"
|
|
|
|
|
"\trandomreplacekeys -- randomly replaces N keys by deleting "
|
|
|
|
|
"the old version and putting the new version\n\n"
|
|
|
|
|
"\ttimeseries -- 1 writer generates time series data "
|
|
|
|
|
"and multiple readers doing random reads on id\n\n"
|
|
|
|
|
"Meta operations:\n"
|
|
|
|
|
"\tcompact -- Compact the entire DB; If multiple, randomly choose one\n"
|
|
|
|
|
"\tcompactall -- Compact the entire DB\n"
|
|
|
|
|
IF_ROCKSDB_LITE("",
|
|
|
|
|
"\tcompact0 -- compact L0 into L1\n"
|
|
|
|
|
"\tcompact1 -- compact L1 into L2\n"
|
|
|
|
|
"\twaitforcompaction - pause until compaction is (probably) done\n"
|
|
|
|
|
)
|
|
|
|
|
"\tflush - flush the memtable\n"
|
|
|
|
|
"\tstats -- Print DB stats\n"
|
|
|
|
|
"\tresetstats -- Reset DB stats\n"
|
|
|
|
|
"\tlevelstats -- Print the number of files and bytes per level\n"
|
|
|
|
|
"\tmemstats -- Print memtable stats\n"
|
|
|
|
|
"\tsstables -- Print sstable info\n"
|
|
|
|
|
"\theapprofile -- Dump a heap profile (if supported by this port)\n"
|
|
|
|
|
IF_ROCKSDB_LITE("",
|
New API to get all merge operands for a Key (#5604)
Summary:
This is a new API added to db.h to allow for fetching all merge operands associated with a Key. The main motivation for this API is to support use cases where doing a full online merge is not necessary as it is performance sensitive. Example use-cases:
1. Update subset of columns and read subset of columns -
Imagine a SQL Table, a row is encoded as a K/V pair (as it is done in MyRocks). If there are many columns and users only updated one of them, we can use merge operator to reduce write amplification. While users only read one or two columns in the read query, this feature can avoid a full merging of the whole row, and save some CPU.
2. Updating very few attributes in a value which is a JSON-like document -
Updating one attribute can be done efficiently using merge operator, while reading back one attribute can be done more efficiently if we don't need to do a full merge.
----------------------------------------------------------------------------------------------------
API :
Status GetMergeOperands(
const ReadOptions& options, ColumnFamilyHandle* column_family,
const Slice& key, PinnableSlice* merge_operands,
GetMergeOperandsOptions* get_merge_operands_options,
int* number_of_operands)
Example usage :
int size = 100;
int number_of_operands = 0;
std::vector<PinnableSlice> values(size);
GetMergeOperandsOptions merge_operands_info;
db_->GetMergeOperands(ReadOptions(), db_->DefaultColumnFamily(), "k1", values.data(), merge_operands_info, &number_of_operands);
Description :
Returns all the merge operands corresponding to the key. If the number of merge operands in DB is greater than merge_operands_options.expected_max_number_of_operands no merge operands are returned and status is Incomplete. Merge operands returned are in the order of insertion.
merge_operands-> Points to an array of at-least merge_operands_options.expected_max_number_of_operands and the caller is responsible for allocating it. If the status returned is Incomplete then number_of_operands will contain the total number of merge operands found in DB for key.
Pull Request resolved: https://github.com/facebook/rocksdb/pull/5604
Test Plan:
Added unit test and perf test in db_bench that can be run using the command:
./db_bench -benchmarks=getmergeoperands --merge_operator=sortlist
Differential Revision: D16657366
Pulled By: vjnadimpalli
fbshipit-source-id: 0faadd752351745224ee12d4ae9ef3cb529951bf
5 years ago
|
|
|
"\treplay -- replay the trace file specified with trace_file\n"
|
|
|
|
|
)
|
New API to get all merge operands for a Key (#5604)
Summary:
This is a new API added to db.h to allow for fetching all merge operands associated with a Key. The main motivation for this API is to support use cases where doing a full online merge is not necessary as it is performance sensitive. Example use-cases:
1. Update subset of columns and read subset of columns -
Imagine a SQL Table, a row is encoded as a K/V pair (as it is done in MyRocks). If there are many columns and users only updated one of them, we can use merge operator to reduce write amplification. While users only read one or two columns in the read query, this feature can avoid a full merging of the whole row, and save some CPU.
2. Updating very few attributes in a value which is a JSON-like document -
Updating one attribute can be done efficiently using merge operator, while reading back one attribute can be done more efficiently if we don't need to do a full merge.
----------------------------------------------------------------------------------------------------
API :
Status GetMergeOperands(
const ReadOptions& options, ColumnFamilyHandle* column_family,
const Slice& key, PinnableSlice* merge_operands,
GetMergeOperandsOptions* get_merge_operands_options,
int* number_of_operands)
Example usage :
int size = 100;
int number_of_operands = 0;
std::vector<PinnableSlice> values(size);
GetMergeOperandsOptions merge_operands_info;
db_->GetMergeOperands(ReadOptions(), db_->DefaultColumnFamily(), "k1", values.data(), merge_operands_info, &number_of_operands);
Description :
Returns all the merge operands corresponding to the key. If the number of merge operands in DB is greater than merge_operands_options.expected_max_number_of_operands no merge operands are returned and status is Incomplete. Merge operands returned are in the order of insertion.
merge_operands-> Points to an array of at-least merge_operands_options.expected_max_number_of_operands and the caller is responsible for allocating it. If the status returned is Incomplete then number_of_operands will contain the total number of merge operands found in DB for key.
Pull Request resolved: https://github.com/facebook/rocksdb/pull/5604
Test Plan:
Added unit test and perf test in db_bench that can be run using the command:
./db_bench -benchmarks=getmergeoperands --merge_operator=sortlist
Differential Revision: D16657366
Pulled By: vjnadimpalli
fbshipit-source-id: 0faadd752351745224ee12d4ae9ef3cb529951bf
5 years ago
|
|
|
"\tgetmergeoperands -- Insert lots of merge records which are a list of "
|
|
|
|
|
"sorted ints for a key and then compare performance of lookup for another "
|
|
|
|
|
"key by doing a Get followed by binary searching in the large sorted list "
|
|
|
|
|
"vs doing a GetMergeOperands and binary searching in the operands which "
|
|
|
|
|
"are sorted sub-lists. The MergeOperator used is sortlist.h\n"
|
|
|
|
|
"\treadrandomoperands -- read random keys using `GetMergeOperands()`. An "
|
|
|
|
|
"operation includes a rare but possible retry in case it got "
|
|
|
|
|
"`Status::Incomplete()`. This happens upon encountering more keys than "
|
|
|
|
|
"have ever been seen by the thread (or eight initially)\n");
|
|
|
|
|
|
|
|
|
|
DEFINE_int64(num, 1000000, "Number of key/values to place in database");
|
|
|
|
|
|
|
|
|
|
DEFINE_int64(numdistinct, 1000,
|
|
|
|
|
"Number of distinct keys to use. Used in RandomWithVerify to "
|
|
|
|
|
"read/write on fewer keys so that gets are more likely to find the"
|
|
|
|
|
" key and puts are more likely to update the same key");
|
|
|
|
|
|
|
|
|
|
DEFINE_int64(merge_keys, -1,
|
|
|
|
|
"Number of distinct keys to use for MergeRandom and "
|
|
|
|
|
"ReadRandomMergeRandom. "
|
|
|
|
|
"If negative, there will be FLAGS_num keys.");
|
|
|
|
|
DEFINE_int32(num_column_families, 1, "Number of Column Families to use.");
|
|
|
|
|
|
|
|
|
|
DEFINE_int32(
|
|
|
|
|
num_hot_column_families, 0,
|
|
|
|
|
"Number of Hot Column Families. If more than 0, only write to this "
|
|
|
|
|
"number of column families. After finishing all the writes to them, "
|
|
|
|
|
"create new set of column families and insert to them. Only used "
|
|
|
|
|
"when num_column_families > 1.");
|
|
|
|
|
|
|
|
|
|
DEFINE_string(column_family_distribution, "",
|
|
|
|
|
"Comma-separated list of percentages, where the ith element "
|
|
|
|
|
"indicates the probability of an op using the ith column family. "
|
|
|
|
|
"The number of elements must be `num_hot_column_families` if "
|
|
|
|
|
"specified; otherwise, it must be `num_column_families`. The "
|
|
|
|
|
"sum of elements must be 100. E.g., if `num_column_families=4`, "
|
|
|
|
|
"and `num_hot_column_families=0`, a valid list could be "
|
|
|
|
|
"\"10,20,30,40\".");
|
|
|
|
|
|
|
|
|
|
DEFINE_int64(reads, -1, "Number of read operations to do. "
|
|
|
|
|
"If negative, do FLAGS_num reads.");
|
|
|
|
|
|
|
|
|
|
DEFINE_int64(deletes, -1, "Number of delete operations to do. "
|
|
|
|
|
"If negative, do FLAGS_num deletions.");
|
|
|
|
|
|
|
|
|
|
DEFINE_int32(bloom_locality, 0, "Control bloom filter probes locality");
|
|
|
|
|
|
|
|
|
|
DEFINE_int64(seed, 0,
|
|
|
|
|
"Seed base for random number generators. "
|
|
|
|
|
"When 0 it is derived from the current time.");
|
|
|
|
|
static int64_t seed_base;
|
|
|
|
|
|
|
|
|
|
DEFINE_int32(threads, 1, "Number of concurrent threads to run.");
|
|
|
|
|
|
|
|
|
|
DEFINE_int32(duration, 0, "Time in seconds for the random-ops tests to run."
|
|
|
|
|
" When 0 then num & reads determine the test duration");
|
|
|
|
|
|
|
|
|
|
DEFINE_string(value_size_distribution_type, "fixed",
|
|
|
|
|
"Value size distribution type: fixed, uniform, normal");
|
|
|
|
|
|
|
|
|
|
DEFINE_int32(value_size, 100, "Size of each value in fixed distribution");
|
|
|
|
|
static unsigned int value_size = 100;
|
|
|
|
|
|
|
|
|
|
DEFINE_int32(value_size_min, 100, "Min size of random value");
|
|
|
|
|
|
|
|
|
|
DEFINE_int32(value_size_max, 102400, "Max size of random value");
|
|
|
|
|
|
|
|
|
|
DEFINE_int32(seek_nexts, 0,
|
|
|
|
|
"How many times to call Next() after Seek() in "
|
|
|
|
|
"fillseekseq, seekrandom, seekrandomwhilewriting and "
|
|
|
|
|
"seekrandomwhilemerging");
|
SkipListRep::LookaheadIterator
Summary:
This diff introduces the `lookahead` argument to `SkipListFactory()`. This is an
optimization for the tailing use case which includes many seeks. E.g. consider
the following operations on a skip list iterator:
Seek(x), Next(), Next(), Seek(x+2), Next(), Seek(x+3), Next(), Next(), ...
If `lookahead` is positive, `SkipListRep` will return an iterator which also
keeps track of the previously visited node. Seek() then first does a linear
search starting from that node (up to `lookahead` steps). As in the tailing
example above, this may require fewer than ~log(n) comparisons as with regular
skip list search.
Test Plan:
Added a new benchmark (`fillseekseq`) which simulates the usage pattern. It
first writes N records (with consecutive keys), then measures how much time it
takes to read them by calling `Seek()` and `Next()`.
$ time ./db_bench -num 10000000 -benchmarks fillseekseq -prefix_size 1 \
-key_size 8 -write_buffer_size $[1024*1024*1024] -value_size 50 \
-seekseq_next 2 -skip_list_lookahead=0
[...]
DB path: [/dev/shm/rocksdbtest/dbbench]
fillseekseq : 0.389 micros/op 2569047 ops/sec;
real 0m21.806s
user 0m12.106s
sys 0m9.672s
$ time ./db_bench [...] -skip_list_lookahead=2
[...]
DB path: [/dev/shm/rocksdbtest/dbbench]
fillseekseq : 0.153 micros/op 6540684 ops/sec;
real 0m19.469s
user 0m10.192s
sys 0m9.252s
Reviewers: ljin, sdong, igor
Reviewed By: igor
Subscribers: dhruba, leveldb, march, lovro
Differential Revision: https://reviews.facebook.net/D23997
10 years ago
|
|
|
|
|
|
|
|
DEFINE_bool(reverse_iterator, false,
|
|
|
|
|
"When true use Prev rather than Next for iterators that do "
|
|
|
|
|
"Seek and then Next");
|
|
|
|
|
|
|
|
|
|
DEFINE_int64(max_scan_distance, 0,
|
|
|
|
|
"Used to define iterate_upper_bound (or iterate_lower_bound "
|
|
|
|
|
"if FLAGS_reverse_iterator is set to true) when value is nonzero");
|
|
|
|
|
|
|
|
|
|
DEFINE_bool(use_uint64_comparator, false, "use Uint64 user comparator");
|
|
|
|
|
|
|
|
|
|
DEFINE_int64(batch_size, 1, "Batch size");
|
|
|
|
|
|
|
|
|
|
static bool ValidateKeySize(const char* /*flagname*/, int32_t /*value*/) {
|
|
|
|
|
return true;
|
|
|
|
|
}
|
|
|
|
|
|
|
|
|
|
static bool ValidateUint32Range(const char* flagname, uint64_t value) {
|
|
|
|
|
if (value > std::numeric_limits<uint32_t>::max()) {
|
Fixing race condition in DBTest.DynamicMemtableOptions
Summary:
This patch fixes a race condition in DBTEst.DynamicMemtableOptions. In rare cases,
it was possible that the main thread would fill up both memtables before the flush
job acquired its work. Then, the flush job was flushing both memtables together,
producing only one L0 file while the test expected two. Now, the test waits for
flushes to finish earlier, to make sure that the memtables are flushed in separate
flush jobs.
Test Plan:
Insert "usleep(10000);" after "IOSTATS_SET_THREAD_POOL_ID(Env::Priority::HIGH);" in BGWorkFlush()
to make the issue more likely. Then test with:
make db_test && time while ./db_test --gtest_filter=*DynamicMemtableOptions; do true; done
Reviewers: rven, sdong, yhchiang, anthony, igor
Reviewed By: igor
Subscribers: dhruba, leveldb
Differential Revision: https://reviews.facebook.net/D45429
9 years ago
|
|
|
fprintf(stderr, "Invalid value for --%s: %lu, overflow\n", flagname,
|
|
|
|
|
(unsigned long)value);
|
|
|
|
|
return false;
|
|
|
|
|
}
|
|
|
|
|
return true;
|
|
|
|
|
}
|
|
|
|
|
|
|
|
|
|
DEFINE_int32(key_size, 16, "size of each key");
|
|
|
|
|
|
|
|
|
|
DEFINE_int32(user_timestamp_size, 0,
|
|
|
|
|
"number of bytes in a user-defined timestamp");
|
|
|
|
|
|
|
|
|
|
DEFINE_int32(num_multi_db, 0,
|
|
|
|
|
"Number of DBs used in the benchmark. 0 means single DB.");
|
|
|
|
|
|
|
|
|
|
DEFINE_double(compression_ratio, 0.5, "Arrange to generate values that shrink"
|
|
|
|
|
" to this fraction of their original size after compression");
|
|
|
|
|
|
|
|
|
|
DEFINE_double(
|
|
|
|
|
overwrite_probability, 0.0,
|
|
|
|
|
"Used in 'filluniquerandom' benchmark: for each write operation, "
|
|
|
|
|
"we give a probability to perform an overwrite instead. The key used for "
|
|
|
|
|
"the overwrite is randomly chosen from the last 'overwrite_window_size' "
|
|
|
|
|
"keys previously inserted into the DB. "
|
|
|
|
|
"Valid overwrite_probability values: [0.0, 1.0].");
|
|
|
|
|
|
|
|
|
|
DEFINE_uint32(overwrite_window_size, 1,
|
|
|
|
|
"Used in 'filluniquerandom' benchmark. For each write operation,"
|
|
|
|
|
" when the overwrite_probability flag is set by the user, the "
|
|
|
|
|
"key used to perform an overwrite is randomly chosen from the "
|
|
|
|
|
"last 'overwrite_window_size' keys previously inserted into DB. "
|
|
|
|
|
"Warning: large values can affect throughput. "
|
|
|
|
|
"Valid overwrite_window_size values: [1, kMaxUint32].");
|
|
|
|
|
|
|
|
|
|
DEFINE_uint64(
|
|
|
|
|
disposable_entries_delete_delay, 0,
|
|
|
|
|
"Minimum delay in microseconds for the series of Deletes "
|
|
|
|
|
"to be issued. When 0 the insertion of the last disposable entry is "
|
|
|
|
|
"immediately followed by the issuance of the Deletes. "
|
|
|
|
|
"(only compatible with fillanddeleteuniquerandom benchmark).");
|
|
|
|
|
|
|
|
|
|
DEFINE_uint64(disposable_entries_batch_size, 0,
|
|
|
|
|
"Number of consecutively inserted disposable KV entries "
|
|
|
|
|
"that will be deleted after 'delete_delay' microseconds. "
|
|
|
|
|
"A series of Deletes is always issued once all the "
|
|
|
|
|
"disposable KV entries it targets have been inserted "
|
|
|
|
|
"into the DB. When 0 no deletes are issued and a "
|
|
|
|
|
"regular 'filluniquerandom' benchmark occurs. "
|
|
|
|
|
"(only compatible with fillanddeleteuniquerandom benchmark)");
|
|
|
|
|
|
|
|
|
|
DEFINE_int32(disposable_entries_value_size, 64,
|
|
|
|
|
"Size of the values (in bytes) of the entries targeted by "
|
|
|
|
|
"selective deletes. "
|
|
|
|
|
"(only compatible with fillanddeleteuniquerandom benchmark)");
|
|
|
|
|
|
|
|
|
|
DEFINE_uint64(
|
|
|
|
|
persistent_entries_batch_size, 0,
|
|
|
|
|
"Number of KV entries being inserted right before the deletes "
|
|
|
|
|
"targeting the disposable KV entries are issued. These "
|
|
|
|
|
"persistent keys are not targeted by the deletes, and will always "
|
|
|
|
|
"remain valid in the DB. (only compatible with "
|
|
|
|
|
"--benchmarks='fillanddeleteuniquerandom' "
|
|
|
|
|
"and used when--disposable_entries_batch_size is > 0).");
|
|
|
|
|
|
|
|
|
|
DEFINE_int32(persistent_entries_value_size, 64,
|
|
|
|
|
"Size of the values (in bytes) of the entries not targeted by "
|
|
|
|
|
"deletes. (only compatible with "
|
|
|
|
|
"--benchmarks='fillanddeleteuniquerandom' "
|
|
|
|
|
"and used when--disposable_entries_batch_size is > 0).");
|
|
|
|
|
|
|
|
|
|
DEFINE_double(read_random_exp_range, 0.0,
|
|
|
|
|
"Read random's key will be generated using distribution of "
|
|
|
|
|
"num * exp(-r) where r is uniform number from 0 to this value. "
|
|
|
|
|
"The larger the number is, the more skewed the reads are. "
|
|
|
|
|
"Only used in readrandom and multireadrandom benchmarks.");
|
|
|
|
|
|
|
|
|
|
DEFINE_bool(histogram, false, "Print histogram of operation timings");
|
|
|
|
|
|
|
|
|
|
DEFINE_bool(enable_numa, false,
|
|
|
|
|
"Make operations aware of NUMA architecture and bind memory "
|
|
|
|
|
"and cpus corresponding to nodes together. In NUMA, memory "
|
|
|
|
|
"in same node as CPUs are closer when compared to memory in "
|
|
|
|
|
"other nodes. Reads can be faster when the process is bound to "
|
|
|
|
|
"CPU and memory of same node. Use \"$numactl --hardware\" command "
|
|
|
|
|
"to see NUMA memory architecture.");
|
|
|
|
|
|
|
|
|
|
DEFINE_int64(db_write_buffer_size,
|
|
|
|
|
ROCKSDB_NAMESPACE::Options().db_write_buffer_size,
|
|
|
|
|
"Number of bytes to buffer in all memtables before compacting");
|
|
|
|
|
|
|
|
|
|
DEFINE_bool(cost_write_buffer_to_cache, false,
|
|
|
|
|
"The usage of memtable is costed to the block cache");
|
|
|
|
|
|
|
|
|
|
DEFINE_int64(arena_block_size, ROCKSDB_NAMESPACE::Options().arena_block_size,
|
|
|
|
|
"The size, in bytes, of one block in arena memory allocation.");
|
|
|
|
|
|
|
|
|
|
DEFINE_int64(write_buffer_size, ROCKSDB_NAMESPACE::Options().write_buffer_size,
|
|
|
|
|
"Number of bytes to buffer in memtable before compacting");
|
|
|
|
|
|
|
|
|
|
DEFINE_int32(max_write_buffer_number,
|
|
|
|
|
ROCKSDB_NAMESPACE::Options().max_write_buffer_number,
|
|
|
|
|
"The number of in-memory memtables. Each memtable is of size"
|
|
|
|
|
" write_buffer_size bytes.");
|
|
|
|
|
|
|
|
|
|
DEFINE_int32(min_write_buffer_number_to_merge,
|
|
|
|
|
ROCKSDB_NAMESPACE::Options().min_write_buffer_number_to_merge,
|
|
|
|
|
"The minimum number of write buffers that will be merged together"
|
|
|
|
|
"before writing to storage. This is cheap because it is an"
|
|
|
|
|
"in-memory merge. If this feature is not enabled, then all these"
|
|
|
|
|
"write buffers are flushed to L0 as separate files and this "
|
|
|
|
|
"increases read amplification because a get request has to check"
|
|
|
|
|
" in all of these files. Also, an in-memory merge may result in"
|
|
|
|
|
" writing less data to storage if there are duplicate records "
|
|
|
|
|
" in each of these individual write buffers.");
|
|
|
|
|
|
Support saving history in memtable_list
Summary:
For transactions, we are using the memtables to validate that there are no write conflicts. But after flushing, we don't have any memtables, and transactions could fail to commit. So we want to someone keep around some extra history to use for conflict checking. In addition, we want to provide a way to increase the size of this history if too many transactions fail to commit.
After chatting with people, it seems like everyone prefers just using Memtables to store this history (instead of a separate history structure). It seems like the best place for this is abstracted inside the memtable_list. I decide to create a separate list in MemtableListVersion as using the same list complicated the flush/installalflushresults logic too much.
This diff adds a new parameter to control how much memtable history to keep around after flushing. However, it sounds like people aren't too fond of adding new parameters. So I am making the default size of flushed+not-flushed memtables be set to max_write_buffers. This should not change the maximum amount of memory used, but make it more likely we're using closer the the limit. (We are now postponing deleting flushed memtables until the max_write_buffer limit is reached). So while we might use more memory on average, we are still obeying the limit set (and you could argue it's better to go ahead and use up memory now instead of waiting for a write stall to happen to test this limit).
However, if people are opposed to this default behavior, we can easily set it to 0 and require this parameter be set in order to use transactions.
Test Plan: Added a xfunc test to play around with setting different values of this parameter in all tests. Added testing in memtablelist_test and planning on adding more testing here.
Reviewers: sdong, rven, igor
Reviewed By: igor
Subscribers: dhruba, leveldb
Differential Revision: https://reviews.facebook.net/D37443
9 years ago
|
|
|
DEFINE_int32(max_write_buffer_number_to_maintain,
|
|
|
|
|
ROCKSDB_NAMESPACE::Options().max_write_buffer_number_to_maintain,
|
Support saving history in memtable_list
Summary:
For transactions, we are using the memtables to validate that there are no write conflicts. But after flushing, we don't have any memtables, and transactions could fail to commit. So we want to someone keep around some extra history to use for conflict checking. In addition, we want to provide a way to increase the size of this history if too many transactions fail to commit.
After chatting with people, it seems like everyone prefers just using Memtables to store this history (instead of a separate history structure). It seems like the best place for this is abstracted inside the memtable_list. I decide to create a separate list in MemtableListVersion as using the same list complicated the flush/installalflushresults logic too much.
This diff adds a new parameter to control how much memtable history to keep around after flushing. However, it sounds like people aren't too fond of adding new parameters. So I am making the default size of flushed+not-flushed memtables be set to max_write_buffers. This should not change the maximum amount of memory used, but make it more likely we're using closer the the limit. (We are now postponing deleting flushed memtables until the max_write_buffer limit is reached). So while we might use more memory on average, we are still obeying the limit set (and you could argue it's better to go ahead and use up memory now instead of waiting for a write stall to happen to test this limit).
However, if people are opposed to this default behavior, we can easily set it to 0 and require this parameter be set in order to use transactions.
Test Plan: Added a xfunc test to play around with setting different values of this parameter in all tests. Added testing in memtablelist_test and planning on adding more testing here.
Reviewers: sdong, rven, igor
Reviewed By: igor
Subscribers: dhruba, leveldb
Differential Revision: https://reviews.facebook.net/D37443
9 years ago
|
|
|
"The total maximum number of write buffers to maintain in memory "
|
|
|
|
|
"including copies of buffers that have already been flushed. "
|
|
|
|
|
"Unlike max_write_buffer_number, this parameter does not affect "
|
|
|
|
|
"flushing. This controls the minimum amount of write history "
|
|
|
|
|
"that will be available in memory for conflict checking when "
|
|
|
|
|
"Transactions are used. If this value is too low, some "
|
|
|
|
|
"transactions may fail at commit time due to not being able to "
|
|
|
|
|
"determine whether there were any write conflicts. Setting this "
|
|
|
|
|
"value to 0 will cause write buffers to be freed immediately "
|
|
|
|
|
"after they are flushed. If this value is set to -1, "
|
|
|
|
|
"'max_write_buffer_number' will be used.");
|
|
|
|
|
|
Refactor trimming logic for immutable memtables (#5022)
Summary:
MyRocks currently sets `max_write_buffer_number_to_maintain` in order to maintain enough history for transaction conflict checking. The effectiveness of this approach depends on the size of memtables. When memtables are small, it may not keep enough history; when memtables are large, this may consume too much memory.
We are proposing a new way to configure memtable list history: by limiting the memory usage of immutable memtables. The new option is `max_write_buffer_size_to_maintain` and it will take precedence over the old `max_write_buffer_number_to_maintain` if they are both set to non-zero values. The new option accounts for the total memory usage of flushed immutable memtables and mutable memtable. When the total usage exceeds the limit, RocksDB may start dropping immutable memtables (which is also called trimming history), starting from the oldest one.
The semantics of the old option actually works both as an upper bound and lower bound. History trimming will start if number of immutable memtables exceeds the limit, but it will never go below (limit-1) due to history trimming.
In order the mimic the behavior with the new option, history trimming will stop if dropping the next immutable memtable causes the total memory usage go below the size limit. For example, assuming the size limit is set to 64MB, and there are 3 immutable memtables with sizes of 20, 30, 30. Although the total memory usage is 80MB > 64MB, dropping the oldest memtable will reduce the memory usage to 60MB < 64MB, so in this case no memtable will be dropped.
Pull Request resolved: https://github.com/facebook/rocksdb/pull/5022
Differential Revision: D14394062
Pulled By: miasantreble
fbshipit-source-id: 60457a509c6af89d0993f988c9b5c2aa9e45f5c5
5 years ago
|
|
|
DEFINE_int64(max_write_buffer_size_to_maintain,
|
|
|
|
|
ROCKSDB_NAMESPACE::Options().max_write_buffer_size_to_maintain,
|
Refactor trimming logic for immutable memtables (#5022)
Summary:
MyRocks currently sets `max_write_buffer_number_to_maintain` in order to maintain enough history for transaction conflict checking. The effectiveness of this approach depends on the size of memtables. When memtables are small, it may not keep enough history; when memtables are large, this may consume too much memory.
We are proposing a new way to configure memtable list history: by limiting the memory usage of immutable memtables. The new option is `max_write_buffer_size_to_maintain` and it will take precedence over the old `max_write_buffer_number_to_maintain` if they are both set to non-zero values. The new option accounts for the total memory usage of flushed immutable memtables and mutable memtable. When the total usage exceeds the limit, RocksDB may start dropping immutable memtables (which is also called trimming history), starting from the oldest one.
The semantics of the old option actually works both as an upper bound and lower bound. History trimming will start if number of immutable memtables exceeds the limit, but it will never go below (limit-1) due to history trimming.
In order the mimic the behavior with the new option, history trimming will stop if dropping the next immutable memtable causes the total memory usage go below the size limit. For example, assuming the size limit is set to 64MB, and there are 3 immutable memtables with sizes of 20, 30, 30. Although the total memory usage is 80MB > 64MB, dropping the oldest memtable will reduce the memory usage to 60MB < 64MB, so in this case no memtable will be dropped.
Pull Request resolved: https://github.com/facebook/rocksdb/pull/5022
Differential Revision: D14394062
Pulled By: miasantreble
fbshipit-source-id: 60457a509c6af89d0993f988c9b5c2aa9e45f5c5
5 years ago
|
|
|
"The total maximum size of write buffers to maintain in memory "
|
|
|
|
|
"including copies of buffers that have already been flushed. "
|
|
|
|
|
"Unlike max_write_buffer_number, this parameter does not affect "
|
|
|
|
|
"flushing. This controls the minimum amount of write history "
|
|
|
|
|
"that will be available in memory for conflict checking when "
|
|
|
|
|
"Transactions are used. If this value is too low, some "
|
|
|
|
|
"transactions may fail at commit time due to not being able to "
|
|
|
|
|
"determine whether there were any write conflicts. Setting this "
|
|
|
|
|
"value to 0 will cause write buffers to be freed immediately "
|
|
|
|
|
"after they are flushed. If this value is set to -1, "
|
|
|
|
|
"'max_write_buffer_number' will be used.");
|
|
|
|
|
|
|
|
|
|
DEFINE_int32(max_background_jobs,
|
|
|
|
|
ROCKSDB_NAMESPACE::Options().max_background_jobs,
|
|
|
|
|
"The maximum number of concurrent background jobs that can occur "
|
|
|
|
|
"in parallel.");
|
|
|
|
|
|
|
|
|
|
DEFINE_int32(num_bottom_pri_threads, 0,
|
|
|
|
|
"The number of threads in the bottom-priority thread pool (used "
|
|
|
|
|
"by universal compaction only).");
|
|
|
|
|
|
|
|
|
|
DEFINE_int32(num_high_pri_threads, 0,
|
|
|
|
|
"The maximum number of concurrent background compactions"
|
|
|
|
|
" that can occur in parallel.");
|
|
|
|
|
|
|
|
|
|
DEFINE_int32(num_low_pri_threads, 0,
|
|
|
|
|
"The maximum number of concurrent background compactions"
|
|
|
|
|
" that can occur in parallel.");
|
|
|
|
|
|
|
|
|
|
DEFINE_int32(max_background_compactions,
|
|
|
|
|
ROCKSDB_NAMESPACE::Options().max_background_compactions,
|
|
|
|
|
"The maximum number of concurrent background compactions"
|
|
|
|
|
" that can occur in parallel.");
|
|
|
|
|
|
|
|
|
|
DEFINE_uint64(subcompactions, 1,
|
Fixing race condition in DBTest.DynamicMemtableOptions
Summary:
This patch fixes a race condition in DBTEst.DynamicMemtableOptions. In rare cases,
it was possible that the main thread would fill up both memtables before the flush
job acquired its work. Then, the flush job was flushing both memtables together,
producing only one L0 file while the test expected two. Now, the test waits for
flushes to finish earlier, to make sure that the memtables are flushed in separate
flush jobs.
Test Plan:
Insert "usleep(10000);" after "IOSTATS_SET_THREAD_POOL_ID(Env::Priority::HIGH);" in BGWorkFlush()
to make the issue more likely. Then test with:
make db_test && time while ./db_test --gtest_filter=*DynamicMemtableOptions; do true; done
Reviewers: rven, sdong, yhchiang, anthony, igor
Reviewed By: igor
Subscribers: dhruba, leveldb
Differential Revision: https://reviews.facebook.net/D45429
9 years ago
|
|
|
"Maximum number of subcompactions to divide L0-L1 compactions "
|
|
|
|
|
"into.");
|
|
|
|
|
static const bool FLAGS_subcompactions_dummy
|
|
|
|
|
__attribute__((__unused__)) = RegisterFlagValidator(&FLAGS_subcompactions,
|
Fixing race condition in DBTest.DynamicMemtableOptions
Summary:
This patch fixes a race condition in DBTEst.DynamicMemtableOptions. In rare cases,
it was possible that the main thread would fill up both memtables before the flush
job acquired its work. Then, the flush job was flushing both memtables together,
producing only one L0 file while the test expected two. Now, the test waits for
flushes to finish earlier, to make sure that the memtables are flushed in separate
flush jobs.
Test Plan:
Insert "usleep(10000);" after "IOSTATS_SET_THREAD_POOL_ID(Env::Priority::HIGH);" in BGWorkFlush()
to make the issue more likely. Then test with:
make db_test && time while ./db_test --gtest_filter=*DynamicMemtableOptions; do true; done
Reviewers: rven, sdong, yhchiang, anthony, igor
Reviewed By: igor
Subscribers: dhruba, leveldb
Differential Revision: https://reviews.facebook.net/D45429
9 years ago
|
|
|
&ValidateUint32Range);
|
|
|
|
|
|
|
|
|
|
DEFINE_int32(max_background_flushes,
|
|
|
|
|
ROCKSDB_NAMESPACE::Options().max_background_flushes,
|
|
|
|
|
"The maximum number of concurrent background flushes"
|
|
|
|
|
" that can occur in parallel.");
|
|
|
|
|
|
|
|
|
|
static ROCKSDB_NAMESPACE::CompactionStyle FLAGS_compaction_style_e;
|
|
|
|
|
DEFINE_int32(compaction_style,
|
|
|
|
|
(int32_t)ROCKSDB_NAMESPACE::Options().compaction_style,
|
|
|
|
|
"style of compaction: level-based, universal and fifo");
|
|
|
|
|
|
|
|
|
|
static ROCKSDB_NAMESPACE::CompactionPri FLAGS_compaction_pri_e;
|
|
|
|
|
DEFINE_int32(compaction_pri,
|
|
|
|
|
(int32_t)ROCKSDB_NAMESPACE::Options().compaction_pri,
|
|
|
|
|
"priority of files to compaction: by size or by data age");
|
|
|
|
|
|
|
|
|
|
DEFINE_int32(universal_size_ratio, 0,
|
|
|
|
|
"Percentage flexibility while comparing file size"
|
|
|
|
|
" (for universal compaction only).");
|
|
|
|
|
|
|
|
|
|
DEFINE_int32(universal_min_merge_width, 0, "The minimum number of files in a"
|
|
|
|
|
" single compaction run (for universal compaction only).");
|
|
|
|
|
|
|
|
|
|
DEFINE_int32(universal_max_merge_width, 0, "The max number of files to compact"
|
|
|
|
|
" in universal style compaction");
|
|
|
|
|
|
|
|
|
|
DEFINE_int32(universal_max_size_amplification_percent, 0,
|
|
|
|
|
"The max size amplification for universal style compaction");
|
|
|
|
|
|
|
|
|
|
DEFINE_int32(universal_compression_size_percent, -1,
|
|
|
|
|
"The percentage of the database to compress for universal "
|
|
|
|
|
"compaction. -1 means compress everything.");
|
|
|
|
|
|
|
|
|
|
DEFINE_bool(universal_allow_trivial_move, false,
|
|
|
|
|
"Allow trivial move in universal compaction.");
|
|
|
|
|
|
Incremental Space Amp Compactions in Universal Style (#8655)
Summary:
This commit introduces incremental compaction in univeral style for space amplification. This follows the first improvement mentioned in https://rocksdb.org/blog/2021/04/12/universal-improvements.html . The implemention simply picks up files about size of max_compaction_bytes to compact and execute if the penalty is not too big. More optimizations can be done in the future, e.g. prioritizing between this compaction and other types. But for now, the feature is supposed to be functional and can often reduce frequency of full compactions, although it can introduce penalty.
In order to add cut files more efficiently so that more files from upper levels can be included, SST file cutting threshold (for current file + overlapping parent level files) is set to 1.5X of target file size. A 2MB target file size will generate files like this: https://gist.github.com/siying/29d2676fba417404f3c95e6c013c7de8 Number of files indeed increases but it is not out of control.
Two set of write benchmarks are run:
1. For ingestion rate limited scenario, we can see full compaction is mostly eliminated: https://gist.github.com/siying/959bc1186066906831cf4c808d6e0a19 . The write amp increased from 7.7 to 9.4, as expected. After applying file cutting, the number is improved to 8.9. In another benchmark, the write amp is even better with the incremental approach: https://gist.github.com/siying/d1c16c286d7c59c4d7bba718ca198163
2. For ingestion rate unlimited scenario, incremental compaction turns out to be too expensive most of the time and is not executed, as expected.
Pull Request resolved: https://github.com/facebook/rocksdb/pull/8655
Test Plan: Add unit tests to the functionality.
Reviewed By: ajkr
Differential Revision: D31787034
fbshipit-source-id: ce813e63b15a61d5a56e97bf8902a1b28e011beb
3 years ago
|
|
|
DEFINE_bool(universal_incremental, false,
|
|
|
|
|
"Enable incremental compactions in universal compaction.");
|
|
|
|
|
|
|
|
|
|
DEFINE_int64(cache_size, 8 << 20, // 8MB
|
|
|
|
|
"Number of bytes to use as a cache of uncompressed data");
|
|
|
|
|
|
|
|
|
|
DEFINE_int32(cache_numshardbits, 6,
|
|
|
|
|
"Number of shards for the block cache"
|
|
|
|
|
" is 2 ** cache_numshardbits. Negative means use default settings."
|
|
|
|
|
" This is applied only if FLAGS_cache_size is non-negative.");
|
|
|
|
|
|
|
|
|
|
DEFINE_double(cache_high_pri_pool_ratio, 0.0,
|
|
|
|
|
"Ratio of block cache reserve for high pri blocks. "
|
|
|
|
|
"If > 0.0, we also enable "
|
|
|
|
|
"cache_index_and_filter_blocks_with_high_priority.");
|
|
|
|
|
|
|
|
|
|
DEFINE_bool(use_clock_cache, false,
|
|
|
|
|
"Replace default LRU block cache with clock cache.");
|
|
|
|
|
|
|
|
|
|
DEFINE_bool(use_compressed_secondary_cache, false,
|
|
|
|
|
"Use the CompressedSecondaryCache as the secondary cache.");
|
|
|
|
|
|
|
|
|
|
DEFINE_int64(compressed_secondary_cache_size, 8 << 20, // 8MB
|
|
|
|
|
"Number of bytes to use as a cache of data");
|
|
|
|
|
|
|
|
|
|
DEFINE_int32(compressed_secondary_cache_numshardbits, 6,
|
|
|
|
|
"Number of shards for the block cache"
|
|
|
|
|
" is 2 ** compressed_secondary_cache_numshardbits."
|
|
|
|
|
" Negative means use default settings."
|
|
|
|
|
" This is applied only if FLAGS_cache_size is non-negative.");
|
|
|
|
|
|
|
|
|
|
DEFINE_double(compressed_secondary_cache_high_pri_pool_ratio, 0.0,
|
|
|
|
|
"Ratio of block cache reserve for high pri blocks. "
|
|
|
|
|
"If > 0.0, we also enable "
|
|
|
|
|
"cache_index_and_filter_blocks_with_high_priority.");
|
|
|
|
|
|
|
|
|
|
DEFINE_string(compressed_secondary_cache_compression_type, "lz4",
|
|
|
|
|
"The compression algorithm to use for large "
|
|
|
|
|
"values stored in CompressedSecondaryCache.");
|
|
|
|
|
static enum ROCKSDB_NAMESPACE::CompressionType
|
|
|
|
|
FLAGS_compressed_secondary_cache_compression_type_e =
|
|
|
|
|
ROCKSDB_NAMESPACE::kLZ4Compression;
|
|
|
|
|
|
|
|
|
|
DEFINE_uint32(
|
|
|
|
|
compressed_secondary_cache_compress_format_version, 2,
|
|
|
|
|
"compress_format_version can have two values: "
|
|
|
|
|
"compress_format_version == 1 -- decompressed size is not included"
|
|
|
|
|
" in the block header."
|
|
|
|
|
"compress_format_version == 2 -- decompressed size is included"
|
|
|
|
|
" in the block header in varint32 format.");
|
|
|
|
|
|
|
|
|
|
DEFINE_int64(simcache_size, -1,
|
|
|
|
|
"Number of bytes to use as a simcache of "
|
|
|
|
|
"uncompressed data. Nagative value disables simcache.");
|
|
|
|
|
|
|
|
|
|
DEFINE_bool(cache_index_and_filter_blocks, false,
|
|
|
|
|
"Cache index/filter blocks in block cache.");
|
|
|
|
|
|
Provide an allocator for new memory type to be used with RocksDB block cache (#6214)
Summary:
New memory technologies are being developed by various hardware vendors (Intel DCPMM is one such technology currently available). These new memory types require different libraries for allocation and management (such as PMDK and memkind). The high capacities available make it possible to provision large caches (up to several TBs in size), beyond what is achievable with DRAM.
The new allocator provided in this PR uses the memkind library to allocate memory on different media.
**Performance**
We tested the new allocator using db_bench.
- For each test, we vary the size of the block cache (relative to the size of the uncompressed data in the database).
- The database is filled sequentially. Throughput is then measured with a readrandom benchmark.
- We use a uniform distribution as a worst-case scenario.
The plot shows throughput (ops/s) relative to a configuration with no block cache and default allocator.
For all tests, p99 latency is below 500 us.

**Changes**
- Add MemkindKmemAllocator
- Add --use_cache_memkind_kmem_allocator db_bench option (to create an LRU block cache with the new allocator)
- Add detection of memkind library with KMEM DAX support
- Add test for MemkindKmemAllocator
**Minimum Requirements**
- kernel 5.3.12
- ndctl v67 - https://github.com/pmem/ndctl
- memkind v1.10.0 - https://github.com/memkind/memkind
**Memory Configuration**
The allocator uses the MEMKIND_DAX_KMEM memory kind. Follow the instructions on[ memkind’s GitHub page](https://github.com/memkind/memkind) to set up NVDIMM memory accordingly.
Note on memory allocation with NVDIMM memory exposed as system memory.
- The MemkindKmemAllocator will only allocate from NVDIMM memory (using memkind_malloc with MEMKIND_DAX_KMEM kind).
- The default allocator is not restricted to RAM by default. Based on NUMA node latency, the kernel should allocate from local RAM preferentially, but it’s a kernel decision. numactl --preferred/--membind can be used to allocate preferentially/exclusively from the local RAM node.
**Usage**
When creating an LRU cache, pass a MemkindKmemAllocator object as argument.
For example (replace capacity with the desired value in bytes):
```
#include "rocksdb/cache.h"
#include "memory/memkind_kmem_allocator.h"
NewLRUCache(
capacity /*size_t*/,
6 /*cache_numshardbits*/,
false /*strict_capacity_limit*/,
false /*cache_high_pri_pool_ratio*/,
std::make_shared<MemkindKmemAllocator>());
```
Refer to [RocksDB’s block cache documentation](https://github.com/facebook/rocksdb/wiki/Block-Cache) to assign the LRU cache as block cache for a database.
Pull Request resolved: https://github.com/facebook/rocksdb/pull/6214
Reviewed By: cheng-chang
Differential Revision: D19292435
fbshipit-source-id: 7202f47b769e7722b539c86c2ffd669f64d7b4e1
4 years ago
|
|
|
DEFINE_bool(use_cache_memkind_kmem_allocator, false,
|
|
|
|
|
"Use memkind kmem allocator for block cache.");
|
|
|
|
|
|
|
|
|
|
DEFINE_bool(partition_index_and_filters, false,
|
|
|
|
|
"Partition index and filter blocks.");
|
|
|
|
|
|
|
|
|
|
DEFINE_bool(partition_index, false, "Partition index blocks");
|
|
|
|
|
|
|
|
|
|
DEFINE_bool(index_with_first_key, false, "Include first key in the index");
|
|
|
|
|
|
Minimize memory internal fragmentation for Bloom filters (#6427)
Summary:
New experimental option BBTO::optimize_filters_for_memory builds
filters that maximize their use of "usable size" from malloc_usable_size,
which is also used to compute block cache charges.
Rather than always "rounding up," we track state in the
BloomFilterPolicy object to mix essentially "rounding down" and
"rounding up" so that the average FP rate of all generated filters is
the same as without the option. (YMMV as heavily accessed filters might
be unluckily lower accuracy.)
Thus, the option near-minimizes what the block cache considers as
"memory used" for a given target Bloom filter false positive rate and
Bloom filter implementation. There are no forward or backward
compatibility issues with this change, though it only works on the
format_version=5 Bloom filter.
With Jemalloc, we see about 10% reduction in memory footprint (and block
cache charge) for Bloom filters, but 1-2% increase in storage footprint,
due to encoding efficiency losses (FP rate is non-linear with bits/key).
Why not weighted random round up/down rather than state tracking? By
only requiring malloc_usable_size, we don't actually know what the next
larger and next smaller usable sizes for the allocator are. We pick a
requested size, accept and use whatever usable size it has, and use the
difference to inform our next choice. This allows us to narrow in on the
right balance without tracking/predicting usable sizes.
Why not weight history of generated filter false positive rates by
number of keys? This could lead to excess skew in small filters after
generating a large filter.
Results from filter_bench with jemalloc (irrelevant details omitted):
(normal keys/filter, but high variance)
$ ./filter_bench -quick -impl=2 -average_keys_per_filter=30000 -vary_key_count_ratio=0.9
Build avg ns/key: 29.6278
Number of filters: 5516
Total size (MB): 200.046
Reported total allocated memory (MB): 220.597
Reported internal fragmentation: 10.2732%
Bits/key stored: 10.0097
Average FP rate %: 0.965228
$ ./filter_bench -quick -impl=2 -average_keys_per_filter=30000 -vary_key_count_ratio=0.9 -optimize_filters_for_memory
Build avg ns/key: 30.5104
Number of filters: 5464
Total size (MB): 200.015
Reported total allocated memory (MB): 200.322
Reported internal fragmentation: 0.153709%
Bits/key stored: 10.1011
Average FP rate %: 0.966313
(very few keys / filter, optimization not as effective due to ~59 byte
internal fragmentation in blocked Bloom filter representation)
$ ./filter_bench -quick -impl=2 -average_keys_per_filter=1000 -vary_key_count_ratio=0.9
Build avg ns/key: 29.5649
Number of filters: 162950
Total size (MB): 200.001
Reported total allocated memory (MB): 224.624
Reported internal fragmentation: 12.3117%
Bits/key stored: 10.2951
Average FP rate %: 0.821534
$ ./filter_bench -quick -impl=2 -average_keys_per_filter=1000 -vary_key_count_ratio=0.9 -optimize_filters_for_memory
Build avg ns/key: 31.8057
Number of filters: 159849
Total size (MB): 200
Reported total allocated memory (MB): 208.846
Reported internal fragmentation: 4.42297%
Bits/key stored: 10.4948
Average FP rate %: 0.811006
(high keys/filter)
$ ./filter_bench -quick -impl=2 -average_keys_per_filter=1000000 -vary_key_count_ratio=0.9
Build avg ns/key: 29.7017
Number of filters: 164
Total size (MB): 200.352
Reported total allocated memory (MB): 221.5
Reported internal fragmentation: 10.5552%
Bits/key stored: 10.0003
Average FP rate %: 0.969358
$ ./filter_bench -quick -impl=2 -average_keys_per_filter=1000000 -vary_key_count_ratio=0.9 -optimize_filters_for_memory
Build avg ns/key: 30.7131
Number of filters: 160
Total size (MB): 200.928
Reported total allocated memory (MB): 200.938
Reported internal fragmentation: 0.00448054%
Bits/key stored: 10.1852
Average FP rate %: 0.963387
And from db_bench (block cache) with jemalloc:
$ ./db_bench -db=/dev/shm/dbbench.no_optimize -benchmarks=fillrandom -format_version=5 -value_size=90 -bloom_bits=10 -num=2000000 -threads=8 -compaction_style=2 -fifo_compaction_max_table_files_size_mb=10000 -fifo_compaction_allow_compaction=false
$ ./db_bench -db=/dev/shm/dbbench -benchmarks=fillrandom -format_version=5 -value_size=90 -bloom_bits=10 -num=2000000 -threads=8 -optimize_filters_for_memory -compaction_style=2 -fifo_compaction_max_table_files_size_mb=10000 -fifo_compaction_allow_compaction=false
$ (for FILE in /dev/shm/dbbench.no_optimize/*.sst; do ./sst_dump --file=$FILE --show_properties | grep 'filter block' ; done) | awk '{ t += $4; } END { print t; }'
17063835
$ (for FILE in /dev/shm/dbbench/*.sst; do ./sst_dump --file=$FILE --show_properties | grep 'filter block' ; done) | awk '{ t += $4; } END { print t; }'
17430747
$ #^ 2.1% additional filter storage
$ ./db_bench -db=/dev/shm/dbbench.no_optimize -use_existing_db -benchmarks=readrandom,stats -statistics -bloom_bits=10 -num=2000000 -compaction_style=2 -fifo_compaction_max_table_files_size_mb=10000 -fifo_compaction_allow_compaction=false -duration=10 -cache_index_and_filter_blocks -cache_size=1000000000
rocksdb.block.cache.index.add COUNT : 33
rocksdb.block.cache.index.bytes.insert COUNT : 8440400
rocksdb.block.cache.filter.add COUNT : 33
rocksdb.block.cache.filter.bytes.insert COUNT : 21087528
rocksdb.bloom.filter.useful COUNT : 4963889
rocksdb.bloom.filter.full.positive COUNT : 1214081
rocksdb.bloom.filter.full.true.positive COUNT : 1161999
$ #^ 1.04 % observed FP rate
$ ./db_bench -db=/dev/shm/dbbench -use_existing_db -benchmarks=readrandom,stats -statistics -bloom_bits=10 -num=2000000 -compaction_style=2 -fifo_compaction_max_table_files_size_mb=10000 -fifo_compaction_allow_compaction=false -optimize_filters_for_memory -duration=10 -cache_index_and_filter_blocks -cache_size=1000000000
rocksdb.block.cache.index.add COUNT : 33
rocksdb.block.cache.index.bytes.insert COUNT : 8448592
rocksdb.block.cache.filter.add COUNT : 33
rocksdb.block.cache.filter.bytes.insert COUNT : 18220328
rocksdb.bloom.filter.useful COUNT : 5360933
rocksdb.bloom.filter.full.positive COUNT : 1321315
rocksdb.bloom.filter.full.true.positive COUNT : 1262999
$ #^ 1.08 % observed FP rate, 13.6% less memory usage for filters
(Due to specific key density, this example tends to generate filters that are "worse than average" for internal fragmentation. "Better than average" cases can show little or no improvement.)
Pull Request resolved: https://github.com/facebook/rocksdb/pull/6427
Test Plan: unit test added, 'make check' with gcc, clang and valgrind
Reviewed By: siying
Differential Revision: D22124374
Pulled By: pdillinger
fbshipit-source-id: f3e3aa152f9043ddf4fae25799e76341d0d8714e
4 years ago
|
|
|
DEFINE_bool(
|
|
|
|
|
optimize_filters_for_memory,
|
|
|
|
|
ROCKSDB_NAMESPACE::BlockBasedTableOptions().optimize_filters_for_memory,
|
|
|
|
|
"Minimize memory footprint of filters");
|
|
|
|
|
|
|
|
|
|
DEFINE_int64(
|
|
|
|
|
index_shortening_mode, 2,
|
|
|
|
|
"mode to shorten index: 0 for no shortening; 1 for only shortening "
|
|
|
|
|
"separaters; 2 for shortening shortening and successor");
|
|
|
|
|
|
|
|
|
|
DEFINE_int64(metadata_block_size,
|
|
|
|
|
ROCKSDB_NAMESPACE::BlockBasedTableOptions().metadata_block_size,
|
|
|
|
|
"Max partition size when partitioning index/filters");
|
|
|
|
|
|
|
|
|
|
// The default reduces the overhead of reading time with flash. With HDD, which
|
|
|
|
|
// offers much less throughput, however, this number better to be set to 1.
|
|
|
|
|
DEFINE_int32(ops_between_duration_checks, 1000,
|
|
|
|
|
"Check duration limit every x ops");
|
|
|
|
|
|
Adding pin_l0_filter_and_index_blocks_in_cache feature and related fixes.
Summary:
When a block based table file is opened, if prefetch_index_and_filter is true, it will prefetch the index and filter blocks, putting them into the block cache.
What this feature adds: when a L0 block based table file is opened, if pin_l0_filter_and_index_blocks_in_cache is true in the options (and prefetch_index_and_filter is true), then the filter and index blocks aren't released back to the block cache at the end of BlockBasedTableReader::Open(). Instead the table reader takes ownership of them, hence pinning them, ie. the LRU cache will never push them out. Meanwhile in the table reader, further accesses will not hit the block cache, thus avoiding lock contention.
Test Plan:
'export TEST_TMPDIR=/dev/shm/ && DISABLE_JEMALLOC=1 OPT=-g make all valgrind_check -j32' is OK.
I didn't run the Java tests, I don't have Java set up on my devserver.
Reviewers: sdong
Reviewed By: sdong
Subscribers: andrewkr, dhruba
Differential Revision: https://reviews.facebook.net/D56133
8 years ago
|
|
|
DEFINE_bool(pin_l0_filter_and_index_blocks_in_cache, false,
|
|
|
|
|
"Pin index/filter blocks of L0 files in block cache.");
|
|
|
|
|
|
|
|
|
|
DEFINE_bool(
|
|
|
|
|
pin_top_level_index_and_filter, false,
|
|
|
|
|
"Pin top-level index of partitioned index/filter blocks in block cache.");
|
|
|
|
|
|
|
|
|
|
DEFINE_int32(block_size,
|
|
|
|
|
static_cast<int32_t>(
|
|
|
|
|
ROCKSDB_NAMESPACE::BlockBasedTableOptions().block_size),
|
|
|
|
|
"Number of bytes in a block.");
|
|
|
|
|
|
|
|
|
|
DEFINE_int32(format_version,
|
|
|
|
|
static_cast<int32_t>(
|
|
|
|
|
ROCKSDB_NAMESPACE::BlockBasedTableOptions().format_version),
|
|
|
|
|
"Format version of SST files.");
|
|
|
|
|
|
|
|
|
|
DEFINE_int32(block_restart_interval,
|
|
|
|
|
ROCKSDB_NAMESPACE::BlockBasedTableOptions().block_restart_interval,
|
|
|
|
|
"Number of keys between restart points "
|
|
|
|
|
"for delta encoding of keys in data block.");
|
|
|
|
|
|
|
|
|
|
DEFINE_int32(
|
|
|
|
|
index_block_restart_interval,
|
|
|
|
|
ROCKSDB_NAMESPACE::BlockBasedTableOptions().index_block_restart_interval,
|
|
|
|
|
"Number of keys between restart points "
|
|
|
|
|
"for delta encoding of keys in index block.");
|
|
|
|
|
|
|
|
|
|
DEFINE_int32(read_amp_bytes_per_bit,
|
|
|
|
|
ROCKSDB_NAMESPACE::BlockBasedTableOptions().read_amp_bytes_per_bit,
|
|
|
|
|
"Number of bytes per bit to be used in block read-amp bitmap");
|
|
|
|
|
|
|
|
|
|
DEFINE_bool(
|
|
|
|
|
enable_index_compression,
|
|
|
|
|
ROCKSDB_NAMESPACE::BlockBasedTableOptions().enable_index_compression,
|
|
|
|
|
"Compress the index block");
|
|
|
|
|
|
|
|
|
|
DEFINE_bool(block_align,
|
|
|
|
|
ROCKSDB_NAMESPACE::BlockBasedTableOptions().block_align,
|
|
|
|
|
"Align data blocks on page size");
|
|
|
|
|
|
|
|
|
|
DEFINE_int64(prepopulate_block_cache, 0,
|
|
|
|
|
"Pre-populate hot/warm blocks in block cache. 0 to disable and 1 "
|
|
|
|
|
"to insert during flush");
|
|
|
|
|
|
|
|
|
|
DEFINE_bool(use_data_block_hash_index, false,
|
|
|
|
|
"if use kDataBlockBinaryAndHash "
|
|
|
|
|
"instead of kDataBlockBinarySearch. "
|
|
|
|
|
"This is valid if only we use BlockTable");
|
|
|
|
|
|
|
|
|
|
DEFINE_double(data_block_hash_table_util_ratio, 0.75,
|
|
|
|
|
"util ratio for data block hash index table. "
|
|
|
|
|
"This is only valid if use_data_block_hash_index is "
|
|
|
|
|
"set to true");
|
|
|
|
|
|
|
|
|
|
DEFINE_int64(compressed_cache_size, -1,
|
|
|
|
|
"Number of bytes to use as a cache of compressed data.");
|
|
|
|
|
|
|
|
|
|
DEFINE_int64(row_cache_size, 0,
|
|
|
|
|
"Number of bytes to use as a cache of individual rows"
|
|
|
|
|
" (0 = disabled).");
|
|
|
|
|
|
|
|
|
|
DEFINE_int32(open_files, ROCKSDB_NAMESPACE::Options().max_open_files,
|
|
|
|
|
"Maximum number of files to keep open at the same time"
|
|
|
|
|
" (use default if == 0)");
|
|
|
|
|
|
|
|
|
|
DEFINE_int32(file_opening_threads,
|
|
|
|
|
ROCKSDB_NAMESPACE::Options().max_file_opening_threads,
|
|
|
|
|
"If open_files is set to -1, this option set the number of "
|
|
|
|
|
"threads that will be used to open files during DB::Open()");
|
|
|
|
|
|
|
|
|
|
DEFINE_int32(compaction_readahead_size, 0, "Compaction readahead size");
|
|
|
|
|
|
|
|
|
|
DEFINE_int32(log_readahead_size, 0, "WAL and manifest readahead size");
|
|
|
|
|
|
|
|
|
|
DEFINE_int32(random_access_max_buffer_size, 1024 * 1024,
|
|
|
|
|
"Maximum windows randomaccess buffer size");
|
|
|
|
|
|
|
|
|
|
DEFINE_int32(writable_file_max_buffer_size, 1024 * 1024,
|
|
|
|
|
"Maximum write buffer for Writable File");
|
|
|
|
|
|
|
|
|
|
DEFINE_int32(bloom_bits, -1,
|
|
|
|
|
"Bloom filter bits per key. Negative means use default."
|
|
|
|
|
"Zero disables.");
|
Support optimize_filters_for_memory for Ribbon filter (#7774)
Summary:
Primarily this change refactors the optimize_filters_for_memory
code for Bloom filters, based on malloc_usable_size, to also work for
Ribbon filters.
This change also replaces the somewhat slow but general
BuiltinFilterBitsBuilder::ApproximateNumEntries with
implementation-specific versions for Ribbon (new) and Legacy Bloom
(based on a recently deleted version). The reason is to emphasize
speed in ApproximateNumEntries rather than 100% accuracy.
Justification: ApproximateNumEntries (formerly CalculateNumEntry) is
only used by RocksDB for range-partitioned filters, called each time we
start to construct one. (In theory, it should be possible to reuse the
estimate, but the abstractions provided by FilterPolicy don't really
make that workable.) But this is only used as a heuristic estimate for
hitting a desired partitioned filter size because of alignment to data
blocks, which have various numbers of unique keys or prefixes. The two
factors lead us to prioritize reasonable speed over 100% accuracy.
optimize_filters_for_memory adds extra complication, because precisely
calculating num_entries for some allowed number of bytes depends on state
with optimize_filters_for_memory enabled. And the allocator-agnostic
implementation of optimize_filters_for_memory, using malloc_usable_size,
means we would have to actually allocate memory, many times, just to
precisely determine how many entries (keys) could be added and stay below
some size budget, for the current state. (In a draft, I got this
working, and then realized the balance of speed vs. accuracy was all
wrong.)
So related to that, I have made CalculateSpace, an internal-only API
only used for testing, non-authoritative also if
optimize_filters_for_memory is enabled. This simplifies some code.
Pull Request resolved: https://github.com/facebook/rocksdb/pull/7774
Test Plan:
unit test updated, and for FilterSize test, range of tested
values is greatly expanded (still super fast)
Also tested `db_bench -benchmarks=fillrandom,stats -bloom_bits=10 -num=1000000 -partition_index_and_filters -format_version=5 [-optimize_filters_for_memory] [-use_ribbon_filter]` with temporary debug output of generated filter sizes.
Bloom+optimize_filters_for_memory:
1 Filter size: 197 (224 in memory)
134 Filter size: 3525 (3584 in memory)
107 Filter size: 4037 (4096 in memory)
Total on disk: 904,506
Total in memory: 918,752
Ribbon+optimize_filters_for_memory:
1 Filter size: 3061 (3072 in memory)
110 Filter size: 3573 (3584 in memory)
58 Filter size: 4085 (4096 in memory)
Total on disk: 633,021 (-30.0%)
Total in memory: 634,880 (-30.9%)
Bloom (no offm):
1 Filter size: 261 (320 in memory)
1 Filter size: 3333 (3584 in memory)
240 Filter size: 3717 (4096 in memory)
Total on disk: 895,674 (-1% on disk vs. +offm; known tolerable overhead of offm)
Total in memory: 986,944 (+7.4% vs. +offm)
Ribbon (no offm):
1 Filter size: 2949 (3072 in memory)
1 Filter size: 3381 (3584 in memory)
167 Filter size: 3701 (4096 in memory)
Total on disk: 624,397 (-30.3% vs. Bloom)
Total in memory: 690,688 (-30.0% vs. Bloom)
Note that optimize_filters_for_memory is even more effective for Ribbon filter than for cache-local Bloom, because it can close the unused memory gap even tighter than Bloom filter, because of 16 byte increments for Ribbon vs. 64 byte increments for Bloom.
Reviewed By: jay-zhuang
Differential Revision: D25592970
Pulled By: pdillinger
fbshipit-source-id: 606fdaa025bb790d7e9c21601e8ea86e10541912
4 years ago
|
|
|
|
|
|
|
|
DEFINE_bool(use_ribbon_filter, false, "Use Ribbon instead of Bloom filter");
|
|
|
|
|
|
|
|
|
|
DEFINE_double(memtable_bloom_size_ratio, 0,
|
|
|
|
|
"Ratio of memtable size used for bloom filter. 0 means no bloom "
|
|
|
|
|
"filter.");
|
|
|
|
|
DEFINE_bool(memtable_whole_key_filtering, false,
|
|
|
|
|
"Try to use whole key bloom filter in memtables.");
|
|
|
|
|
DEFINE_bool(memtable_use_huge_page, false,
|
|
|
|
|
"Try to use huge page in memtables.");
|
|
|
|
|
|
|
|
|
|
DEFINE_bool(whole_key_filtering,
|
|
|
|
|
ROCKSDB_NAMESPACE::BlockBasedTableOptions().whole_key_filtering,
|
|
|
|
|
"Use whole keys (in addition to prefixes) in SST bloom filter.");
|
|
|
|
|
|
|
|
|
|
DEFINE_bool(use_existing_db, false, "If true, do not destroy the existing"
|
|
|
|
|
" database. If you set this flag and also specify a benchmark that"
|
|
|
|
|
" wants a fresh database, that benchmark will fail.");
|
|
|
|
|
|
|
|
|
|
DEFINE_bool(use_existing_keys, false,
|
|
|
|
|
"If true, uses existing keys in the DB, "
|
|
|
|
|
"rather than generating new ones. This involves some startup "
|
|
|
|
|
"latency to load all keys into memory. It is supported for the "
|
|
|
|
|
"same read/overwrite benchmarks as `-use_existing_db=true`, which "
|
|
|
|
|
"must also be set for this flag to be enabled. When this flag is "
|
|
|
|
|
"set, the value for `-num` will be ignored.");
|
|
|
|
|
|
Add argument --show_table_properties to db_bench
Summary:
Add argument --show_table_properties to db_bench
-show_table_properties (If true, then per-level table properties will be
printed on every stats-interval when stats_interval is set and
stats_per_interval is on.) type: bool default: false
Test Plan:
./db_bench --show_table_properties=1 --stats_interval=100000 --stats_per_interval=1
./db_bench --show_table_properties=1 --stats_interval=100000 --stats_per_interval=1 --num_column_families=2
Sample Output:
Compaction Stats [column_family_name_000001]
Level Files Size(MB) Score Read(GB) Rn(GB) Rnp1(GB) Write(GB) Wnew(GB) Moved(GB) W-Amp Rd(MB/s) Wr(MB/s) Comp(sec) Comp(cnt) Avg(sec) Stall(cnt) KeyIn KeyDrop
---------------------------------------------------------------------------------------------------------------------------------------------------------------------
L0 3/0 5 0.8 0.0 0.0 0.0 0.0 0.0 0.0 0.0 0.0 86.3 0 17 0.021 0 0 0
L1 5/0 9 0.9 0.0 0.0 0.0 0.0 0.0 0.0 0.0 0.0 0.0 0 0 0.000 0 0 0
L2 9/0 16 0.2 0.0 0.0 0.0 0.0 0.0 0.0 0.0 0.0 0.0 0 0 0.000 0 0 0
Sum 17/0 31 0.0 0.0 0.0 0.0 0.0 0.0 0.0 1.0 0.0 86.3 0 17 0.021 0 0 0
Int 0/0 0 0.0 0.0 0.0 0.0 0.0 0.0 0.0 1.0 0.0 83.9 0 2 0.022 0 0 0
Flush(GB): cumulative 0.030, interval 0.004
Stalls(count): 0 level0_slowdown, 0 level0_numfiles, 0 memtable_compaction, 0 leveln_slowdown_soft, 0 leveln_slowdown_hard
Level[0]: # data blocks=2571; # entries=84813; raw key size=2035512; raw average key size=24.000000; raw value size=8481300; raw average value size=100.000000; data block size=5690119; index block size=82415; filter block size=0; (estimated) table size=5772534; filter policy name=N/A;
Level[1]: # data blocks=4285; # entries=141355; raw key size=3392520; raw average key size=24.000000; raw value size=14135500; raw average value size=100.000000; data block size=9487353; index block size=137377; filter block size=0; (estimated) table size=9624730; filter policy name=N/A;
Level[2]: # data blocks=7713; # entries=254439; raw key size=6106536; raw average key size=24.000000; raw value size=25443900; raw average value size=100.000000; data block size=17077893; index block size=247269; filter block size=0; (estimated) table size=17325162; filter policy name=N/A;
Level[3]: # data blocks=0; # entries=0; raw key size=0; raw average key size=0.000000; raw value size=0; raw average value size=0.000000; data block size=0; index block size=0; filter block size=0; (estimated) table size=0; filter policy name=N/A;
Level[4]: # data blocks=0; # entries=0; raw key size=0; raw average key size=0.000000; raw value size=0; raw average value size=0.000000; data block size=0; index block size=0; filter block size=0; (estimated) table size=0; filter policy name=N/A;
Level[5]: # data blocks=0; # entries=0; raw key size=0; raw average key size=0.000000; raw value size=0; raw average value size=0.000000; data block size=0; index block size=0; filter block size=0; (estimated) table size=0; filter policy name=N/A;
Level[6]: # data blocks=0; # entries=0; raw key size=0; raw average key size=0.000000; raw value size=0; raw average value size=0.000000; data block size=0; index block size=0; filter block size=0; (estimated) table size=0; filter policy name=N/A;
Reviewers: anthony, IslamAbdelRahman, MarkCallaghan, sdong, igor
Reviewed By: igor
Subscribers: dhruba, leveldb
Differential Revision: https://reviews.facebook.net/D45651
9 years ago
|
|
|
DEFINE_bool(show_table_properties, false,
|
|
|
|
|
"If true, then per-level table"
|
|
|
|
|
" properties will be printed on every stats-interval when"
|
|
|
|
|
" stats_interval is set and stats_per_interval is on.");
|
|
|
|
|
|
|
|
|
|
DEFINE_string(db, "", "Use the db with the following name.");
|
|
|
|
|
|
|
|
|
|
// Read cache flags
|
|
|
|
|
|
|
|
|
|
DEFINE_string(read_cache_path, "",
|
|
|
|
|
"If not empty string, a read cache will be used in this path");
|
|
|
|
|
|
|
|
|
|
DEFINE_int64(read_cache_size, 4LL * 1024 * 1024 * 1024,
|
|
|
|
|
"Maximum size of the read cache");
|
|
|
|
|
|
|
|
|
|
DEFINE_bool(read_cache_direct_write, true,
|
|
|
|
|
"Whether to use Direct IO for writing to the read cache");
|
|
|
|
|
|
|
|
|
|
DEFINE_bool(read_cache_direct_read, true,
|
|
|
|
|
"Whether to use Direct IO for reading from read cache");
|
|
|
|
|
|
|
|
|
|
DEFINE_bool(use_keep_filter, false, "Whether to use a noop compaction filter");
|
|
|
|
|
|
|
|
|
|
static bool ValidateCacheNumshardbits(const char* flagname, int32_t value) {
|
|
|
|
|
if (value >= 20) {
|
|
|
|
|
fprintf(stderr, "Invalid value for --%s: %d, must be < 20\n",
|
|
|
|
|
flagname, value);
|
|
|
|
|
return false;
|
|
|
|
|
}
|
|
|
|
|
return true;
|
|
|
|
|
}
|
|
|
|
|
|
|
|
|
|
DEFINE_bool(verify_checksum, true,
|
|
|
|
|
"Verify checksum for every block read"
|
|
|
|
|
" from storage");
|
|
|
|
|
|
Implement XXH3 block checksum type (#9069)
Summary:
XXH3 - latest hash function that is extremely fast on large
data, easily faster than crc32c on most any x86_64 hardware. In
integrating this hash function, I have handled the compression type byte
in a non-standard way to avoid using the streaming API (extra data
movement and active code size because of hash function complexity). This
approach got a thumbs-up from Yann Collet.
Existing functionality change:
* reject bad ChecksumType in options with InvalidArgument
This change split off from https://github.com/facebook/rocksdb/issues/9058 because context-aware checksum is
likely to be handled through different configuration than ChecksumType.
Pull Request resolved: https://github.com/facebook/rocksdb/pull/9069
Test Plan:
tests updated, and substantially expanded. Unit tests now check
that we don't accidentally change the values generated by the checksum
algorithms ("schema test") and that we properly handle
invalid/unrecognized checksum types in options or in file footer.
DBTestBase::ChangeOptions (etc.) updated from two to one configuration
changing from default CRC32c ChecksumType. The point of this test code
is to detect possible interactions among features, and the likelihood of
some bad interaction being detected by including configurations other
than XXH3 and CRC32c--and then not detected by stress/crash test--is
extremely low.
Stress/crash test also updated (manual run long enough to see it accepts
new checksum type). db_bench also updated for microbenchmarking
checksums.
### Performance microbenchmark (PORTABLE=0 DEBUG_LEVEL=0, Broadwell processor)
./db_bench -benchmarks=crc32c,xxhash,xxhash64,xxh3,crc32c,xxhash,xxhash64,xxh3,crc32c,xxhash,xxhash64,xxh3
crc32c : 0.200 micros/op 5005220 ops/sec; 19551.6 MB/s (4096 per op)
xxhash : 0.807 micros/op 1238408 ops/sec; 4837.5 MB/s (4096 per op)
xxhash64 : 0.421 micros/op 2376514 ops/sec; 9283.3 MB/s (4096 per op)
xxh3 : 0.171 micros/op 5858391 ops/sec; 22884.3 MB/s (4096 per op)
crc32c : 0.206 micros/op 4859566 ops/sec; 18982.7 MB/s (4096 per op)
xxhash : 0.793 micros/op 1260850 ops/sec; 4925.2 MB/s (4096 per op)
xxhash64 : 0.410 micros/op 2439182 ops/sec; 9528.1 MB/s (4096 per op)
xxh3 : 0.161 micros/op 6202872 ops/sec; 24230.0 MB/s (4096 per op)
crc32c : 0.203 micros/op 4924686 ops/sec; 19237.1 MB/s (4096 per op)
xxhash : 0.839 micros/op 1192388 ops/sec; 4657.8 MB/s (4096 per op)
xxhash64 : 0.424 micros/op 2357391 ops/sec; 9208.6 MB/s (4096 per op)
xxh3 : 0.162 micros/op 6182678 ops/sec; 24151.1 MB/s (4096 per op)
As you can see, especially once warmed up, xxh3 is fastest.
### Performance macrobenchmark (PORTABLE=0 DEBUG_LEVEL=0, Broadwell processor)
Test
for I in `seq 1 50`; do for CHK in 0 1 2 3 4; do TEST_TMPDIR=/dev/shm/rocksdb$CHK ./db_bench -benchmarks=fillseq -memtablerep=vector -allow_concurrent_memtable_write=false -num=30000000 -checksum_type=$CHK 2>&1 | grep 'micros/op' | tee -a results-$CHK & done; wait; done
Results (ops/sec)
for FILE in results*; do echo -n "$FILE "; awk '{ s += $5; c++; } END { print 1.0 * s / c; }' < $FILE; done
results-0 252118 # kNoChecksum
results-1 251588 # kCRC32c
results-2 251863 # kxxHash
results-3 252016 # kxxHash64
results-4 252038 # kXXH3
Reviewed By: mrambacher
Differential Revision: D31905249
Pulled By: pdillinger
fbshipit-source-id: cb9b998ebe2523fc7c400eedf62124a78bf4b4d1
3 years ago
|
|
|
DEFINE_int32(checksum_type,
|
|
|
|
|
ROCKSDB_NAMESPACE::BlockBasedTableOptions().checksum,
|
|
|
|
|
"ChecksumType as an int");
|
|
|
|
|
|
|
|
|
|
DEFINE_bool(statistics, false, "Database statistics");
|
|
|
|
|
DEFINE_int32(stats_level, ROCKSDB_NAMESPACE::StatsLevel::kExceptDetailedTimers,
|
|
|
|
|
"stats level for statistics");
|
|
|
|
|
DEFINE_string(statistics_string, "", "Serialized statistics string");
|
|
|
|
|
static class std::shared_ptr<ROCKSDB_NAMESPACE::Statistics> dbstats;
|
|
|
|
|
|
|
|
|
|
DEFINE_int64(writes, -1, "Number of write operations to do. If negative, do"
|
|
|
|
|
" --num reads.");
|
|
|
|
|
|
|
|
|
|
DEFINE_bool(finish_after_writes, false, "Write thread terminates after all writes are finished");
|
|
|
|
|
|
|
|
|
|
DEFINE_bool(sync, false, "Sync all writes to disk");
|
|
|
|
|
|
|
|
|
|
DEFINE_bool(use_fsync, false, "If true, issue fsync instead of fdatasync");
|
|
|
|
|
|
|
|
|
|
DEFINE_bool(disable_wal, false, "If true, do not write WAL for write.");
|
|
|
|
|
|
|
|
|
|
DEFINE_bool(manual_wal_flush, false,
|
|
|
|
|
"If true, buffer WAL until buffer is full or a manual FlushWAL().");
|
|
|
|
|
|
|
|
|
|
DEFINE_string(wal_compression, "none",
|
|
|
|
|
"Algorithm to use for WAL compression. none to disable.");
|
|
|
|
|
static enum ROCKSDB_NAMESPACE::CompressionType FLAGS_wal_compression_e =
|
|
|
|
|
ROCKSDB_NAMESPACE::kNoCompression;
|
|
|
|
|
|
|
|
|
|
DEFINE_string(wal_dir, "", "If not empty, use the given dir for WAL");
|
|
|
|
|
|
|
|
|
|
DEFINE_string(truth_db, "/dev/shm/truth_db/dbbench",
|
|
|
|
|
"Truth key/values used when using verify");
|
|
|
|
|
|
|
|
|
|
DEFINE_int32(num_levels, 7, "The total number of levels");
|
|
|
|
|
|
|
|
|
|
DEFINE_int64(target_file_size_base,
|
|
|
|
|
ROCKSDB_NAMESPACE::Options().target_file_size_base,
|
|
|
|
|
"Target file size at level-1");
|
|
|
|
|
|
|
|
|
|
DEFINE_int32(target_file_size_multiplier,
|
|
|
|
|
ROCKSDB_NAMESPACE::Options().target_file_size_multiplier,
|
|
|
|
|
"A multiplier to compute target level-N file size (N >= 2)");
|
|
|
|
|
|
|
|
|
|
DEFINE_uint64(max_bytes_for_level_base,
|
|
|
|
|
ROCKSDB_NAMESPACE::Options().max_bytes_for_level_base,
|
|
|
|
|
"Max bytes for level-1");
|
|
|
|
|
|
options.level_compaction_dynamic_level_bytes to allow RocksDB to pick size bases of levels dynamically.
Summary:
When having fixed max_bytes_for_level_base, the ratio of size of largest level and the second one can range from 0 to the multiplier. This makes LSM tree frequently irregular and unpredictable. It can also cause poor space amplification in some cases.
In this improvement (proposed by Igor Kabiljo), we introduce a parameter option.level_compaction_use_dynamic_max_bytes. When turning it on, RocksDB is free to pick a level base in the range of (options.max_bytes_for_level_base/options.max_bytes_for_level_multiplier, options.max_bytes_for_level_base] so that real level ratios are close to options.max_bytes_for_level_multiplier.
Test Plan: New unit tests and pass tests suites including valgrind.
Reviewers: MarkCallaghan, rven, yhchiang, igor, ikabiljo
Reviewed By: ikabiljo
Subscribers: yoshinorim, ikabiljo, dhruba, leveldb
Differential Revision: https://reviews.facebook.net/D31437
10 years ago
|
|
|
DEFINE_bool(level_compaction_dynamic_level_bytes, false,
|
|
|
|
|
"Whether level size base is dynamic");
|
|
|
|
|
|
|
|
|
|
DEFINE_double(max_bytes_for_level_multiplier, 10,
|
|
|
|
|
"A multiplier to compute max bytes for level-N (N >= 2)");
|
|
|
|
|
|
|
|
|
|
static std::vector<int> FLAGS_max_bytes_for_level_multiplier_additional_v;
|
|
|
|
|
DEFINE_string(max_bytes_for_level_multiplier_additional, "",
|
|
|
|
|
"A vector that specifies additional fanout per level");
|
|
|
|
|
|
Don't artificially inflate L0 score
Summary:
This turns out to be pretty bad because if we prioritize L0->L1 then L1 can grow artificially large, which makes L0->L1 more and more expensive. For example:
256MB @ L0 + 256MB @ L1 --> 512MB @ L1
256MB @ L0 + 512MB @ L1 --> 768MB @ L1
256MB @ L0 + 768MB @ L1 --> 1GB @ L1
....
256MB @ L0 + 10GB @ L1 --> 10.2GB @ L1
At some point we need to start compacting L1->L2 to speed up L0->L1.
Test Plan:
The performance improvement is massive for heavy write workload. This is the benchmark I ran: https://phabricator.fb.com/P19842671. Before this change, the benchmark took 47 minutes to complete. After, the benchmark finished in 2minutes. You can see full results here: https://phabricator.fb.com/P19842674
Also, we ran this diff on MongoDB on RocksDB on one replicaset. Before the change, our initial sync was so slow that it couldn't keep up with primary writes. After the change, the import finished without any issues
Reviewers: dynamike, MarkCallaghan, rven, yhchiang, sdong
Reviewed By: sdong
Subscribers: dhruba, leveldb
Differential Revision: https://reviews.facebook.net/D38637
9 years ago
|
|
|
DEFINE_int32(level0_stop_writes_trigger,
|
|
|
|
|
ROCKSDB_NAMESPACE::Options().level0_stop_writes_trigger,
|
|
|
|
|
"Number of files in level-0 that will trigger put stop.");
|
|
|
|
|
|
Don't artificially inflate L0 score
Summary:
This turns out to be pretty bad because if we prioritize L0->L1 then L1 can grow artificially large, which makes L0->L1 more and more expensive. For example:
256MB @ L0 + 256MB @ L1 --> 512MB @ L1
256MB @ L0 + 512MB @ L1 --> 768MB @ L1
256MB @ L0 + 768MB @ L1 --> 1GB @ L1
....
256MB @ L0 + 10GB @ L1 --> 10.2GB @ L1
At some point we need to start compacting L1->L2 to speed up L0->L1.
Test Plan:
The performance improvement is massive for heavy write workload. This is the benchmark I ran: https://phabricator.fb.com/P19842671. Before this change, the benchmark took 47 minutes to complete. After, the benchmark finished in 2minutes. You can see full results here: https://phabricator.fb.com/P19842674
Also, we ran this diff on MongoDB on RocksDB on one replicaset. Before the change, our initial sync was so slow that it couldn't keep up with primary writes. After the change, the import finished without any issues
Reviewers: dynamike, MarkCallaghan, rven, yhchiang, sdong
Reviewed By: sdong
Subscribers: dhruba, leveldb
Differential Revision: https://reviews.facebook.net/D38637
9 years ago
|
|
|
DEFINE_int32(level0_slowdown_writes_trigger,
|
|
|
|
|
ROCKSDB_NAMESPACE::Options().level0_slowdown_writes_trigger,
|
|
|
|
|
"Number of files in level-0 that will slow down writes.");
|
|
|
|
|
|
Don't artificially inflate L0 score
Summary:
This turns out to be pretty bad because if we prioritize L0->L1 then L1 can grow artificially large, which makes L0->L1 more and more expensive. For example:
256MB @ L0 + 256MB @ L1 --> 512MB @ L1
256MB @ L0 + 512MB @ L1 --> 768MB @ L1
256MB @ L0 + 768MB @ L1 --> 1GB @ L1
....
256MB @ L0 + 10GB @ L1 --> 10.2GB @ L1
At some point we need to start compacting L1->L2 to speed up L0->L1.
Test Plan:
The performance improvement is massive for heavy write workload. This is the benchmark I ran: https://phabricator.fb.com/P19842671. Before this change, the benchmark took 47 minutes to complete. After, the benchmark finished in 2minutes. You can see full results here: https://phabricator.fb.com/P19842674
Also, we ran this diff on MongoDB on RocksDB on one replicaset. Before the change, our initial sync was so slow that it couldn't keep up with primary writes. After the change, the import finished without any issues
Reviewers: dynamike, MarkCallaghan, rven, yhchiang, sdong
Reviewed By: sdong
Subscribers: dhruba, leveldb
Differential Revision: https://reviews.facebook.net/D38637
9 years ago
|
|
|
DEFINE_int32(level0_file_num_compaction_trigger,
|
|
|
|
|
ROCKSDB_NAMESPACE::Options().level0_file_num_compaction_trigger,
|
|
|
|
|
"Number of files in level-0 when compactions start.");
|
|
|
|
|
|
|
|
|
|
DEFINE_uint64(periodic_compaction_seconds,
|
|
|
|
|
ROCKSDB_NAMESPACE::Options().periodic_compaction_seconds,
|
|
|
|
|
"Files older than this will be picked up for compaction and"
|
|
|
|
|
" rewritten to the same level");
|
|
|
|
|
|
Try to start TTL earlier with kMinOverlappingRatio is used (#8749)
Summary:
Right now, when options.ttl is set, compactions are triggered around the time when TTL is reached. This might cause extra compactions which are often bursty. This commit tries to mitigate it by picking those files earlier in normal compaction picking process. This is only implemented using kMinOverlappingRatio with Leveled compaction as it is the default value and it is more complicated to change other styles.
When a file is aged more than ttl/2, RocksDB starts to boost the compaction priority of files in normal compaction picking process, and hope by the time TTL is reached, very few extra compaction is needed.
In order for this to work, another change is made: during a compaction, if an output level file is older than ttl/2, cut output files based on original boundary (if it is not in the last level). This is to make sure that after an old file is moved to the next level, and new data is merged from the upper level, the new data falling into this range isn't reset with old timestamp. Without this change, in many cases, most files from one level will keep having old timestamp, even if they have newer data and we stuck in it.
Pull Request resolved: https://github.com/facebook/rocksdb/pull/8749
Test Plan: Add a unit test to test the boosting logic. Will add a unit test to test it end-to-end.
Reviewed By: jay-zhuang
Differential Revision: D30735261
fbshipit-source-id: 503c2d89250b22911eb99e72b379be154de3428e
3 years ago
|
|
|
DEFINE_uint64(ttl_seconds, ROCKSDB_NAMESPACE::Options().ttl, "Set options.ttl");
|
|
|
|
|
|
|
|
|
|
static bool ValidateInt32Percent(const char* flagname, int32_t value) {
|
|
|
|
|
if (value <= 0 || value>=100) {
|
|
|
|
|
fprintf(stderr, "Invalid value for --%s: %d, 0< pct <100 \n",
|
|
|
|
|
flagname, value);
|
|
|
|
|
return false;
|
|
|
|
|
}
|
|
|
|
|
return true;
|
|
|
|
|
}
|
|
|
|
|
DEFINE_int32(readwritepercent, 90, "Ratio of reads to reads/writes (expressed"
|
|
|
|
|
" as percentage) for the ReadRandomWriteRandom workload. The "
|
|
|
|
|
"default value 90 means 90% operations out of all reads and writes"
|
|
|
|
|
" operations are reads. In other words, 9 gets for every 1 put.");
|
|
|
|
|
|
|
|
|
|
DEFINE_int32(mergereadpercent, 70, "Ratio of merges to merges&reads (expressed"
|
|
|
|
|
" as percentage) for the ReadRandomMergeRandom workload. The"
|
|
|
|
|
" default value 70 means 70% out of all read and merge operations"
|
|
|
|
|
" are merges. In other words, 7 merges for every 3 gets.");
|
|
|
|
|
|
|
|
|
|
DEFINE_int32(deletepercent, 2, "Percentage of deletes out of reads/writes/"
|
|
|
|
|
"deletes (used in RandomWithVerify only). RandomWithVerify "
|
|
|
|
|
"calculates writepercent as (100 - FLAGS_readwritepercent - "
|
|
|
|
|
"deletepercent), so deletepercent must be smaller than (100 - "
|
|
|
|
|
"FLAGS_readwritepercent)");
|
|
|
|
|
|
|
|
|
|
DEFINE_bool(optimize_filters_for_hits,
|
|
|
|
|
ROCKSDB_NAMESPACE::Options().optimize_filters_for_hits,
|
|
|
|
|
"Optimizes bloom filters for workloads for most lookups return "
|
|
|
|
|
"a value. For now this doesn't create bloom filters for the max "
|
|
|
|
|
"level of the LSM to reduce metadata that should fit in RAM. ");
|
|
|
|
|
|
|
|
|
|
DEFINE_bool(paranoid_checks, ROCKSDB_NAMESPACE::Options().paranoid_checks,
|
|
|
|
|
"RocksDB will aggressively check consistency of the data.");
|
|
|
|
|
|
|
|
|
|
DEFINE_bool(force_consistency_checks,
|
|
|
|
|
ROCKSDB_NAMESPACE::Options().force_consistency_checks,
|
|
|
|
|
"Runs consistency checks on the LSM every time a change is "
|
|
|
|
|
"applied.");
|
|
|
|
|
|
|
|
|
|
DEFINE_bool(check_flush_compaction_key_order,
|
|
|
|
|
ROCKSDB_NAMESPACE::Options().check_flush_compaction_key_order,
|
|
|
|
|
"During flush or compaction, check whether keys inserted to "
|
|
|
|
|
"output files are in order.");
|
|
|
|
|
|
|
|
|
|
DEFINE_uint64(delete_obsolete_files_period_micros, 0,
|
|
|
|
|
"Ignored. Left here for backward compatibility");
|
|
|
|
|
|
|
|
|
|
DEFINE_int64(writes_before_delete_range, 0,
|
|
|
|
|
"Number of writes before DeleteRange is called regularly.");
|
|
|
|
|
|
|
|
|
|
DEFINE_int64(writes_per_range_tombstone, 0,
|
|
|
|
|
"Number of writes between range tombstones");
|
|
|
|
|
|
|
|
|
|
DEFINE_int64(range_tombstone_width, 100, "Number of keys in tombstone's range");
|
|
|
|
|
|
|
|
|
|
DEFINE_int64(max_num_range_tombstones, 0,
|
|
|
|
|
"Maximum number of range tombstones to insert.");
|
|
|
|
|
|
|
|
|
|
DEFINE_bool(expand_range_tombstones, false,
|
|
|
|
|
"Expand range tombstone into sequential regular tombstones.");
|
|
|
|
|
|
|
|
|
|
#ifndef ROCKSDB_LITE
|
|
|
|
|
// Transactions Options
|
Pessimistic Transactions
Summary:
Initial implementation of Pessimistic Transactions. This diff contains the api changes discussed in D38913. This diff is pretty large, so let me know if people would prefer to meet up to discuss it.
MyRocks folks: please take a look at the API in include/rocksdb/utilities/transaction[_db].h and let me know if you have any issues.
Also, you'll notice a couple of TODOs in the implementation of RollbackToSavePoint(). After chatting with Siying, I'm going to send out a separate diff for an alternate implementation of this feature that implements the rollback inside of WriteBatch/WriteBatchWithIndex. We can then decide which route is preferable.
Next, I'm planning on doing some perf testing and then integrating this diff into MongoRocks for further testing.
Test Plan: Unit tests, db_bench parallel testing.
Reviewers: igor, rven, sdong, yhchiang, yoshinorim
Reviewed By: sdong
Subscribers: hermanlee4, maykov, spetrunia, leveldb, dhruba
Differential Revision: https://reviews.facebook.net/D40869
9 years ago
|
|
|
DEFINE_bool(optimistic_transaction_db, false,
|
|
|
|
|
"Open a OptimisticTransactionDB instance. "
|
|
|
|
|
"Required for randomtransaction benchmark.");
|
|
|
|
|
|
Pessimistic Transactions
Summary:
Initial implementation of Pessimistic Transactions. This diff contains the api changes discussed in D38913. This diff is pretty large, so let me know if people would prefer to meet up to discuss it.
MyRocks folks: please take a look at the API in include/rocksdb/utilities/transaction[_db].h and let me know if you have any issues.
Also, you'll notice a couple of TODOs in the implementation of RollbackToSavePoint(). After chatting with Siying, I'm going to send out a separate diff for an alternate implementation of this feature that implements the rollback inside of WriteBatch/WriteBatchWithIndex. We can then decide which route is preferable.
Next, I'm planning on doing some perf testing and then integrating this diff into MongoRocks for further testing.
Test Plan: Unit tests, db_bench parallel testing.
Reviewers: igor, rven, sdong, yhchiang, yoshinorim
Reviewed By: sdong
Subscribers: hermanlee4, maykov, spetrunia, leveldb, dhruba
Differential Revision: https://reviews.facebook.net/D40869
9 years ago
|
|
|
DEFINE_bool(transaction_db, false,
|
|
|
|
|
"Open a TransactionDB instance. "
|
|
|
|
|
"Required for randomtransaction benchmark.");
|
|
|
|
|
|
|
|
|
|
DEFINE_uint64(transaction_sets, 2,
|
|
|
|
|
"Number of keys each transaction will "
|
|
|
|
|
"modify (use in RandomTransaction only). Max: 9999");
|
|
|
|
|
|
|
|
|
|
DEFINE_bool(transaction_set_snapshot, false,
|
|
|
|
|
"Setting to true will have each transaction call SetSnapshot()"
|
|
|
|
|
" upon creation.");
|
|
|
|
|
|
|
|
|
|
DEFINE_int32(transaction_sleep, 0,
|
|
|
|
|
"Max microseconds to sleep in between "
|
|
|
|
|
"reading and writing a value (used in RandomTransaction only). ");
|
|
|
|
|
|
|
|
|
|
DEFINE_uint64(transaction_lock_timeout, 100,
|
|
|
|
|
"If using a transaction_db, specifies the lock wait timeout in"
|
|
|
|
|
" milliseconds before failing a transaction waiting on a lock");
|
|
|
|
|
DEFINE_string(
|
|
|
|
|
options_file, "",
|
|
|
|
|
"The path to a RocksDB options file. If specified, then db_bench will "
|
|
|
|
|
"run with the RocksDB options in the default column family of the "
|
|
|
|
|
"specified options file. "
|
|
|
|
|
"Note that with this setting, db_bench will ONLY accept the following "
|
|
|
|
|
"RocksDB options related command-line arguments, all other arguments "
|
|
|
|
|
"that are related to RocksDB options will be ignored:\n"
|
|
|
|
|
"\t--use_existing_db\n"
|
|
|
|
|
"\t--use_existing_keys\n"
|
|
|
|
|
"\t--statistics\n"
|
|
|
|
|
"\t--row_cache_size\n"
|
|
|
|
|
"\t--row_cache_numshardbits\n"
|
|
|
|
|
"\t--enable_io_prio\n"
|
|
|
|
|
"\t--dump_malloc_stats\n"
|
|
|
|
|
"\t--num_multi_db\n");
|
|
|
|
|
|
|
|
|
|
// FIFO Compaction Options
|
|
|
|
|
DEFINE_uint64(fifo_compaction_max_table_files_size_mb, 0,
|
|
|
|
|
"The limit of total table file sizes to trigger FIFO compaction");
|
|
|
|
|
|
|
|
|
|
DEFINE_bool(fifo_compaction_allow_compaction, true,
|
|
|
|
|
"Allow compaction in FIFO compaction.");
|
|
|
|
|
|
|
|
|
|
DEFINE_uint64(fifo_compaction_ttl, 0, "TTL for the SST Files in seconds.");
|
|
|
|
|
|
|
|
|
|
DEFINE_uint64(fifo_age_for_warm, 0, "age_for_warm for FIFO compaction.");
|
|
|
|
|
|
|
|
|
|
// Stacked BlobDB Options
|
|
|
|
|
DEFINE_bool(use_blob_db, false, "[Stacked BlobDB] Open a BlobDB instance.");
|
|
|
|
|
|
|
|
|
|
DEFINE_bool(
|
|
|
|
|
blob_db_enable_gc,
|
|
|
|
|
ROCKSDB_NAMESPACE::blob_db::BlobDBOptions().enable_garbage_collection,
|
|
|
|
|
"[Stacked BlobDB] Enable BlobDB garbage collection.");
|
|
|
|
|
|
|
|
|
|
DEFINE_double(
|
|
|
|
|
blob_db_gc_cutoff,
|
|
|
|
|
ROCKSDB_NAMESPACE::blob_db::BlobDBOptions().garbage_collection_cutoff,
|
|
|
|
|
"[Stacked BlobDB] Cutoff ratio for BlobDB garbage collection.");
|
|
|
|
|
|
|
|
|
|
DEFINE_bool(blob_db_is_fifo,
|
|
|
|
|
ROCKSDB_NAMESPACE::blob_db::BlobDBOptions().is_fifo,
|
|
|
|
|
"[Stacked BlobDB] Enable FIFO eviction strategy in BlobDB.");
|
|
|
|
|
|
|
|
|
|
DEFINE_uint64(blob_db_max_db_size,
|
|
|
|
|
ROCKSDB_NAMESPACE::blob_db::BlobDBOptions().max_db_size,
|
|
|
|
|
"[Stacked BlobDB] Max size limit of the directory where blob "
|
|
|
|
|
"files are stored.");
|
|
|
|
|
|
|
|
|
|
DEFINE_uint64(blob_db_max_ttl_range, 0,
|
|
|
|
|
"[Stacked BlobDB] TTL range to generate BlobDB data (in "
|
|
|
|
|
"seconds). 0 means no TTL.");
|
|
|
|
|
|
|
|
|
|
DEFINE_uint64(
|
|
|
|
|
blob_db_ttl_range_secs,
|
|
|
|
|
ROCKSDB_NAMESPACE::blob_db::BlobDBOptions().ttl_range_secs,
|
|
|
|
|
"[Stacked BlobDB] TTL bucket size to use when creating blob files.");
|
|
|
|
|
|
|
|
|
|
DEFINE_uint64(
|
|
|
|
|
blob_db_min_blob_size,
|
|
|
|
|
ROCKSDB_NAMESPACE::blob_db::BlobDBOptions().min_blob_size,
|
|
|
|
|
"[Stacked BlobDB] Smallest blob to store in a file. Blobs "
|
|
|
|
|
"smaller than this will be inlined with the key in the LSM tree.");
|
|
|
|
|
|
|
|
|
|
DEFINE_uint64(blob_db_bytes_per_sync,
|
|
|
|
|
ROCKSDB_NAMESPACE::blob_db::BlobDBOptions().bytes_per_sync,
|
|
|
|
|
"[Stacked BlobDB] Bytes to sync blob file at.");
|
|
|
|
|
|
|
|
|
|
DEFINE_uint64(blob_db_file_size,
|
|
|
|
|
ROCKSDB_NAMESPACE::blob_db::BlobDBOptions().blob_file_size,
|
|
|
|
|
"[Stacked BlobDB] Target size of each blob file.");
|
|
|
|
|
|
|
|
|
|
DEFINE_string(
|
|
|
|
|
blob_db_compression_type, "snappy",
|
|
|
|
|
"[Stacked BlobDB] Algorithm to use to compress blobs in blob files.");
|
|
|
|
|
static enum ROCKSDB_NAMESPACE::CompressionType
|
|
|
|
|
FLAGS_blob_db_compression_type_e = ROCKSDB_NAMESPACE::kSnappyCompression;
|
|
|
|
|
|
|
|
|
|
#endif // ROCKSDB_LITE
|
|
|
|
|
|
|
|
|
|
// Integrated BlobDB options
|
|
|
|
|
DEFINE_bool(
|
|
|
|
|
enable_blob_files,
|
|
|
|
|
ROCKSDB_NAMESPACE::AdvancedColumnFamilyOptions().enable_blob_files,
|
|
|
|
|
"[Integrated BlobDB] Enable writing large values to separate blob files.");
|
|
|
|
|
|
|
|
|
|
DEFINE_uint64(min_blob_size,
|
|
|
|
|
ROCKSDB_NAMESPACE::AdvancedColumnFamilyOptions().min_blob_size,
|
|
|
|
|
"[Integrated BlobDB] The size of the smallest value to be stored "
|
|
|
|
|
"separately in a blob file.");
|
|
|
|
|
|
|
|
|
|
DEFINE_uint64(blob_file_size,
|
|
|
|
|
ROCKSDB_NAMESPACE::AdvancedColumnFamilyOptions().blob_file_size,
|
|
|
|
|
"[Integrated BlobDB] The size limit for blob files.");
|
|
|
|
|
|
|
|
|
|
DEFINE_string(blob_compression_type, "none",
|
|
|
|
|
"[Integrated BlobDB] The compression algorithm to use for large "
|
|
|
|
|
"values stored in blob files.");
|
|
|
|
|
|
|
|
|
|
DEFINE_bool(enable_blob_garbage_collection,
|
|
|
|
|
ROCKSDB_NAMESPACE::AdvancedColumnFamilyOptions()
|
|
|
|
|
.enable_blob_garbage_collection,
|
|
|
|
|
"[Integrated BlobDB] Enable blob garbage collection.");
|
|
|
|
|
|
|
|
|
|
DEFINE_double(blob_garbage_collection_age_cutoff,
|
|
|
|
|
ROCKSDB_NAMESPACE::AdvancedColumnFamilyOptions()
|
|
|
|
|
.blob_garbage_collection_age_cutoff,
|
|
|
|
|
"[Integrated BlobDB] The cutoff in terms of blob file age for "
|
|
|
|
|
"garbage collection.");
|
|
|
|
|
|
Make it possible to force the garbage collection of the oldest blob files (#8994)
Summary:
The current BlobDB garbage collection logic works by relocating the valid
blobs from the oldest blob files as they are encountered during compaction,
and cleaning up blob files once they contain nothing but garbage. However,
with sufficiently skewed workloads, it is theoretically possible to end up in a
situation when few or no compactions get scheduled for the SST files that contain
references to the oldest blob files, which can lead to increased space amp due
to the lack of GC.
In order to efficiently handle such workloads, the patch adds a new BlobDB
configuration option called `blob_garbage_collection_force_threshold`,
which signals to BlobDB to schedule targeted compactions for the SST files
that keep alive the oldest batch of blob files if the overall ratio of garbage in
the given blob files meets the threshold *and* all the given blob files are
eligible for GC based on `blob_garbage_collection_age_cutoff`. (For example,
if the new option is set to 0.9, targeted compactions will get scheduled if the
sum of garbage bytes meets or exceeds 90% of the sum of total bytes in the
oldest blob files, assuming all affected blob files are below the age-based cutoff.)
The net result of these targeted compactions is that the valid blobs in the oldest
blob files are relocated and the oldest blob files themselves cleaned up (since
*all* SST files that rely on them get compacted away).
These targeted compactions are similar to periodic compactions in the sense
that they force certain SST files that otherwise would not get picked up to undergo
compaction and also in the sense that instead of merging files from multiple levels,
they target a single file. (Note: such compactions might still include neighboring files
from the same level due to the need of having a "clean cut" boundary but they never
include any files from any other level.)
This functionality is currently only supported with the leveled compaction style
and is inactive by default (since the default value is set to 1.0, i.e. 100%).
Pull Request resolved: https://github.com/facebook/rocksdb/pull/8994
Test Plan: Ran `make check` and tested using `db_bench` and the stress/crash tests.
Reviewed By: riversand963
Differential Revision: D31489850
Pulled By: ltamasi
fbshipit-source-id: 44057d511726a0e2a03c5d9313d7511b3f0c4eab
3 years ago
|
|
|
DEFINE_double(blob_garbage_collection_force_threshold,
|
|
|
|
|
ROCKSDB_NAMESPACE::AdvancedColumnFamilyOptions()
|
|
|
|
|
.blob_garbage_collection_force_threshold,
|
|
|
|
|
"[Integrated BlobDB] The threshold for the ratio of garbage in "
|
|
|
|
|
"the oldest blob files for forcing garbage collection.");
|
|
|
|
|
|
|
|
|
|
DEFINE_uint64(blob_compaction_readahead_size,
|
|
|
|
|
ROCKSDB_NAMESPACE::AdvancedColumnFamilyOptions()
|
|
|
|
|
.blob_compaction_readahead_size,
|
|
|
|
|
"[Integrated BlobDB] Compaction readahead for blob files.");
|
|
|
|
|
|
|
|
|
|
#ifndef ROCKSDB_LITE
|
|
|
|
|
|
|
|
|
|
// Secondary DB instance Options
|
|
|
|
|
DEFINE_bool(use_secondary_db, false,
|
|
|
|
|
"Open a RocksDB secondary instance. A primary instance can be "
|
|
|
|
|
"running in another db_bench process.");
|
|
|
|
|
|
|
|
|
|
DEFINE_string(secondary_path, "",
|
|
|
|
|
"Path to a directory used by the secondary instance to store "
|
|
|
|
|
"private files, e.g. info log.");
|
|
|
|
|
|
|
|
|
|
DEFINE_int32(secondary_update_interval, 5,
|
|
|
|
|
"Secondary instance attempts to catch up with the primary every "
|
|
|
|
|
"secondary_update_interval seconds.");
|
|
|
|
|
|
|
|
|
|
#endif // ROCKSDB_LITE
|
|
|
|
|
|
|
|
|
|
DEFINE_bool(report_bg_io_stats, false,
|
Add options.compaction_measure_io_stats to print write I/O stats in compactions
Summary:
Add options.compaction_measure_io_stats to print out / pass to listener accumulated time spent on write calls. Example outputs in info logs:
2015/08/12-16:27:59.463944 7fd428bff700 (Original Log Time 2015/08/12-16:27:59.463922) EVENT_LOG_v1 {"time_micros": 1439422079463897, "job": 6, "event": "compaction_finished", "output_level": 1, "num_output_files": 4, "total_output_size": 6900525, "num_input_records": 111483, "num_output_records": 106877, "file_write_nanos": 15663206, "file_range_sync_nanos": 649588, "file_fsync_nanos": 349614797, "file_prepare_write_nanos": 1505812, "lsm_state": [2, 4, 0, 0, 0, 0, 0]}
Add two more counters in iostats_context.
Also add a parameter of db_bench.
Test Plan: Add a unit test. Also manually verify LOG outputs in db_bench
Subscribers: leveldb, dhruba
Differential Revision: https://reviews.facebook.net/D44115
9 years ago
|
|
|
"Measure times spents on I/Os while in compactions. ");
|
|
|
|
|
|
|
|
|
|
DEFINE_bool(use_stderr_info_logger, false,
|
|
|
|
|
"Write info logs to stderr instead of to LOG file. ");
|
|
|
|
|
|
|
|
|
|
#ifndef ROCKSDB_LITE
|
|
|
|
|
|
|
|
|
|
DEFINE_string(trace_file, "", "Trace workload to a file. ");
|
|
|
|
|
|
|
|
|
|
DEFINE_double(trace_replay_fast_forward, 1.0,
|
|
|
|
|
"Fast forward trace replay, must > 0.0.");
|
|
|
|
|
DEFINE_int32(block_cache_trace_sampling_frequency, 1,
|
|
|
|
|
"Block cache trace sampling frequency, termed s. It uses spatial "
|
|
|
|
|
"downsampling and samples accesses to one out of s blocks.");
|
|
|
|
|
DEFINE_int64(
|
|
|
|
|
block_cache_trace_max_trace_file_size_in_bytes,
|
|
|
|
|
uint64_t{64} * 1024 * 1024 * 1024,
|
|
|
|
|
"The maximum block cache trace file size in bytes. Block cache accesses "
|
|
|
|
|
"will not be logged if the trace file size exceeds this threshold. Default "
|
|
|
|
|
"is 64 GB.");
|
|
|
|
|
DEFINE_string(block_cache_trace_file, "", "Block cache trace file path.");
|
|
|
|
|
DEFINE_int32(trace_replay_threads, 1,
|
|
|
|
|
"The number of threads to replay, must >=1.");
|
|
|
|
|
|
|
|
|
|
DEFINE_bool(io_uring_enabled, true,
|
|
|
|
|
"If true, enable the use of IO uring if the platform supports it");
|
|
|
|
|
extern "C" bool RocksDbIOUringEnable() { return FLAGS_io_uring_enabled; }
|
|
|
|
|
#endif // ROCKSDB_LITE
|
|
|
|
|
|
|
|
|
|
DEFINE_bool(adaptive_readahead, false,
|
|
|
|
|
"carry forward internal auto readahead size from one file to next "
|
|
|
|
|
"file at each level during iteration");
|
|
|
|
|
|
|
|
|
|
DEFINE_bool(rate_limit_user_ops, false,
|
|
|
|
|
"When true use Env::IO_USER priority level to charge internal rate "
|
|
|
|
|
"limiter for reads associated with user operations.");
|
|
|
|
|
|
|
|
|
|
DEFINE_bool(file_checksum, false,
|
|
|
|
|
"When true use FileChecksumGenCrc32cFactory for "
|
|
|
|
|
"file_checksum_gen_factory.");
|
|
|
|
|
|
Rate-limit automatic WAL flush after each user write (#9607)
Summary:
**Context:**
WAL flush is currently not rate-limited by `Options::rate_limiter`. This PR is to provide rate-limiting to auto WAL flush, the one that automatically happen after each user write operation (i.e, `Options::manual_wal_flush == false`), by adding `WriteOptions::rate_limiter_options`.
Note that we are NOT rate-limiting WAL flush that do NOT automatically happen after each user write, such as `Options::manual_wal_flush == true + manual FlushWAL()` (rate-limiting multiple WAL flushes), for the benefits of:
- being consistent with [ReadOptions::rate_limiter_priority](https://github.com/facebook/rocksdb/blob/7.0.fb/include/rocksdb/options.h#L515)
- being able to turn off some WAL flush's rate-limiting but not all (e.g, turn off specific the WAL flush of a critical user write like a service's heartbeat)
`WriteOptions::rate_limiter_options` only accept `Env::IO_USER` and `Env::IO_TOTAL` currently due to an implementation constraint.
- The constraint is that we currently queue parallel writes (including WAL writes) based on FIFO policy which does not factor rate limiter priority into this layer's scheduling. If we allow lower priorities such as `Env::IO_HIGH/MID/LOW` and such writes specified with lower priorities occurs before ones specified with higher priorities (even just by a tiny bit in arrival time), the former would have blocked the latter, leading to a "priority inversion" issue and contradictory to what we promise for rate-limiting priority. Therefore we only allow `Env::IO_USER` and `Env::IO_TOTAL` right now before improving that scheduling.
A pre-requisite to this feature is to support operation-level rate limiting in `WritableFileWriter`, which is also included in this PR.
**Summary:**
- Renamed test suite `DBRateLimiterTest to DBRateLimiterOnReadTest` for adding a new test suite
- Accept `rate_limiter_priority` in `WritableFileWriter`'s private and public write functions
- Passed `WriteOptions::rate_limiter_options` to `WritableFileWriter` in the path of automatic WAL flush.
Pull Request resolved: https://github.com/facebook/rocksdb/pull/9607
Test Plan:
- Added new unit test to verify existing flush/compaction rate-limiting does not break, since `DBTest, RateLimitingTest` is disabled and current db-level rate-limiting tests focus on read only (e.g, `db_rate_limiter_test`, `DBTest2, RateLimitedCompactionReads`).
- Added new unit test `DBRateLimiterOnWriteWALTest, AutoWalFlush`
- `strace -ftt -e trace=write ./db_bench -benchmarks=fillseq -db=/dev/shm/testdb -rate_limit_auto_wal_flush=1 -rate_limiter_bytes_per_sec=15 -rate_limiter_refill_period_us=1000000 -write_buffer_size=100000000 -disable_auto_compactions=1 -num=100`
- verified that WAL flush(i.e, system-call _write_) were chunked into 15 bytes and each _write_ was roughly 1 second apart
- verified the chunking disappeared when `-rate_limit_auto_wal_flush=0`
- crash test: `python3 tools/db_crashtest.py blackbox --disable_wal=0 --rate_limit_auto_wal_flush=1 --rate_limiter_bytes_per_sec=10485760 --interval=10` killed as normal
**Benchmarked on flush/compaction to ensure no performance regression:**
- compaction with rate-limiting (see table 1, avg over 1280-run): pre-change: **915635 micros/op**; post-change:
**907350 micros/op (improved by 0.106%)**
```
#!/bin/bash
TEST_TMPDIR=/dev/shm/testdb
START=1
NUM_DATA_ENTRY=8
N=10
rm -f compact_bmk_output.txt compact_bmk_output_2.txt dont_care_output.txt
for i in $(eval echo "{$START..$NUM_DATA_ENTRY}")
do
NUM_RUN=$(($N*(2**($i-1))))
for j in $(eval echo "{$START..$NUM_RUN}")
do
./db_bench --benchmarks=fillrandom -db=$TEST_TMPDIR -disable_auto_compactions=1 -write_buffer_size=6710886 > dont_care_output.txt && ./db_bench --benchmarks=compact -use_existing_db=1 -db=$TEST_TMPDIR -level0_file_num_compaction_trigger=1 -rate_limiter_bytes_per_sec=100000000 | egrep 'compact'
done > compact_bmk_output.txt && awk -v NUM_RUN=$NUM_RUN '{sum+=$3;sum_sqrt+=$3^2}END{print sum/NUM_RUN, sqrt(sum_sqrt/NUM_RUN-(sum/NUM_RUN)^2)}' compact_bmk_output.txt >> compact_bmk_output_2.txt
done
```
- compaction w/o rate-limiting (see table 2, avg over 640-run): pre-change: **822197 micros/op**; post-change: **823148 micros/op (regressed by 0.12%)**
```
Same as above script, except that -rate_limiter_bytes_per_sec=0
```
- flush with rate-limiting (see table 3, avg over 320-run, run on the [patch](https://github.com/hx235/rocksdb/commit/ee5c6023a9f6533fab9afdc681568daa21da4953) to augment current db_bench ): pre-change: **745752 micros/op**; post-change: **745331 micros/op (regressed by 0.06 %)**
```
#!/bin/bash
TEST_TMPDIR=/dev/shm/testdb
START=1
NUM_DATA_ENTRY=8
N=10
rm -f flush_bmk_output.txt flush_bmk_output_2.txt
for i in $(eval echo "{$START..$NUM_DATA_ENTRY}")
do
NUM_RUN=$(($N*(2**($i-1))))
for j in $(eval echo "{$START..$NUM_RUN}")
do
./db_bench -db=$TEST_TMPDIR -write_buffer_size=1048576000 -num=1000000 -rate_limiter_bytes_per_sec=100000000 -benchmarks=fillseq,flush | egrep 'flush'
done > flush_bmk_output.txt && awk -v NUM_RUN=$NUM_RUN '{sum+=$3;sum_sqrt+=$3^2}END{print sum/NUM_RUN, sqrt(sum_sqrt/NUM_RUN-(sum/NUM_RUN)^2)}' flush_bmk_output.txt >> flush_bmk_output_2.txt
done
```
- flush w/o rate-limiting (see table 4, avg over 320-run, run on the [patch](https://github.com/hx235/rocksdb/commit/ee5c6023a9f6533fab9afdc681568daa21da4953) to augment current db_bench): pre-change: **487512 micros/op**, post-change: **485856 micors/ops (improved by 0.34%)**
```
Same as above script, except that -rate_limiter_bytes_per_sec=0
```
| table 1 - compact with rate-limiting|
#-run | (pre-change) avg micros/op | std micros/op | (post-change) avg micros/op | std micros/op | change in avg micros/op (%)
-- | -- | -- | -- | -- | --
10 | 896978 | 16046.9 | 901242 | 15670.9 | 0.475373978
20 | 893718 | 15813 | 886505 | 17544.7 | -0.8070778478
40 | 900426 | 23882.2 | 894958 | 15104.5 | -0.6072681153
80 | 906635 | 21761.5 | 903332 | 23948.3 | -0.3643141948
160 | 898632 | 21098.9 | 907583 | 21145 | 0.9960695813
3.20E+02 | 905252 | 22785.5 | 908106 | 25325.5 | 0.3152713278
6.40E+02 | 905213 | 23598.6 | 906741 | 21370.5 | 0.1688000504
**1.28E+03** | **908316** | **23533.1** | **907350** | **24626.8** | **-0.1063506533**
average over #-run | 901896.25 | 21064.9625 | 901977.125 | 20592.025 | 0.008967217682
| table 2 - compact w/o rate-limiting|
#-run | (pre-change) avg micros/op | std micros/op | (post-change) avg micros/op | std micros/op | change in avg micros/op (%)
-- | -- | -- | -- | -- | --
10 | 811211 | 26996.7 | 807586 | 28456.4 | -0.4468627768
20 | 815465 | 14803.7 | 814608 | 28719.7 | -0.105093413
40 | 809203 | 26187.1 | 797835 | 25492.1 | -1.404839082
80 | 822088 | 28765.3 | 822192 | 32840.4 | 0.01265071379
160 | 821719 | 36344.7 | 821664 | 29544.9 | -0.006693285661
3.20E+02 | 820921 | 27756.4 | 821403 | 28347.7 | 0.05871454135
**6.40E+02** | **822197** | **28960.6** | **823148** | **30055.1** | **0.1156657103**
average over #-run | 8.18E+05 | 2.71E+04 | 8.15E+05 | 2.91E+04 | -0.25
| table 3 - flush with rate-limiting|
#-run | (pre-change) avg micros/op | std micros/op | (post-change) avg micros/op | std micros/op | change in avg micros/op (%)
-- | -- | -- | -- | -- | --
10 | 741721 | 11770.8 | 740345 | 5949.76 | -0.1855144994
20 | 735169 | 3561.83 | 743199 | 9755.77 | 1.09226586
40 | 743368 | 8891.03 | 742102 | 8683.22 | -0.1703059588
80 | 742129 | 8148.51 | 743417 | 9631.58| 0.1735547324
160 | 749045 | 9757.21 | 746256 | 9191.86 | -0.3723407806
**3.20E+02** | **745752** | **9819.65** | **745331** | **9840.62** | **-0.0564530836**
6.40E+02 | 749006 | 11080.5 | 748173 | 10578.7 | -0.1112140624
average over #-run | 743741.4286 | 9004.218571 | 744117.5714 | 9090.215714 | 0.05057441238
| table 4 - flush w/o rate-limiting|
#-run | (pre-change) avg micros/op | std micros/op | (post-change) avg micros/op | std micros/op | change in avg micros/op (%)
-- | -- | -- | -- | -- | --
10 | 477283 | 24719.6 | 473864 | 12379 | -0.7163464863
20 | 486743 | 20175.2 | 502296 | 23931.3 | 3.195320734
40 | 482846 | 15309.2 | 489820 | 22259.5 | 1.444352858
80 | 491490 | 21883.1 | 490071 | 23085.7 | -0.2887139108
160 | 493347 | 28074.3 | 483609 | 21211.7 | -1.973864238
**3.20E+02** | **487512** | **21401.5** | **485856** | **22195.2** | **-0.3396839462**
6.40E+02 | 490307 | 25418.6 | 485435 | 22405.2 | -0.9936631539
average over #-run | 4.87E+05 | 2.24E+04 | 4.87E+05 | 2.11E+04 | 0.00E+00
Reviewed By: ajkr
Differential Revision: D34442441
Pulled By: hx235
fbshipit-source-id: 4790f13e1e5c0a95ae1d1cc93ffcf69dc6e78bdd
2 years ago
|
|
|
DEFINE_bool(rate_limit_auto_wal_flush, false,
|
|
|
|
|
"When true use Env::IO_USER priority level to charge internal rate "
|
|
|
|
|
"limiter for automatic WAL flush (`Options::manual_wal_flush` == "
|
|
|
|
|
"false) after the user write operation.");
|
Rate-limit automatic WAL flush after each user write (#9607)
Summary:
**Context:**
WAL flush is currently not rate-limited by `Options::rate_limiter`. This PR is to provide rate-limiting to auto WAL flush, the one that automatically happen after each user write operation (i.e, `Options::manual_wal_flush == false`), by adding `WriteOptions::rate_limiter_options`.
Note that we are NOT rate-limiting WAL flush that do NOT automatically happen after each user write, such as `Options::manual_wal_flush == true + manual FlushWAL()` (rate-limiting multiple WAL flushes), for the benefits of:
- being consistent with [ReadOptions::rate_limiter_priority](https://github.com/facebook/rocksdb/blob/7.0.fb/include/rocksdb/options.h#L515)
- being able to turn off some WAL flush's rate-limiting but not all (e.g, turn off specific the WAL flush of a critical user write like a service's heartbeat)
`WriteOptions::rate_limiter_options` only accept `Env::IO_USER` and `Env::IO_TOTAL` currently due to an implementation constraint.
- The constraint is that we currently queue parallel writes (including WAL writes) based on FIFO policy which does not factor rate limiter priority into this layer's scheduling. If we allow lower priorities such as `Env::IO_HIGH/MID/LOW` and such writes specified with lower priorities occurs before ones specified with higher priorities (even just by a tiny bit in arrival time), the former would have blocked the latter, leading to a "priority inversion" issue and contradictory to what we promise for rate-limiting priority. Therefore we only allow `Env::IO_USER` and `Env::IO_TOTAL` right now before improving that scheduling.
A pre-requisite to this feature is to support operation-level rate limiting in `WritableFileWriter`, which is also included in this PR.
**Summary:**
- Renamed test suite `DBRateLimiterTest to DBRateLimiterOnReadTest` for adding a new test suite
- Accept `rate_limiter_priority` in `WritableFileWriter`'s private and public write functions
- Passed `WriteOptions::rate_limiter_options` to `WritableFileWriter` in the path of automatic WAL flush.
Pull Request resolved: https://github.com/facebook/rocksdb/pull/9607
Test Plan:
- Added new unit test to verify existing flush/compaction rate-limiting does not break, since `DBTest, RateLimitingTest` is disabled and current db-level rate-limiting tests focus on read only (e.g, `db_rate_limiter_test`, `DBTest2, RateLimitedCompactionReads`).
- Added new unit test `DBRateLimiterOnWriteWALTest, AutoWalFlush`
- `strace -ftt -e trace=write ./db_bench -benchmarks=fillseq -db=/dev/shm/testdb -rate_limit_auto_wal_flush=1 -rate_limiter_bytes_per_sec=15 -rate_limiter_refill_period_us=1000000 -write_buffer_size=100000000 -disable_auto_compactions=1 -num=100`
- verified that WAL flush(i.e, system-call _write_) were chunked into 15 bytes and each _write_ was roughly 1 second apart
- verified the chunking disappeared when `-rate_limit_auto_wal_flush=0`
- crash test: `python3 tools/db_crashtest.py blackbox --disable_wal=0 --rate_limit_auto_wal_flush=1 --rate_limiter_bytes_per_sec=10485760 --interval=10` killed as normal
**Benchmarked on flush/compaction to ensure no performance regression:**
- compaction with rate-limiting (see table 1, avg over 1280-run): pre-change: **915635 micros/op**; post-change:
**907350 micros/op (improved by 0.106%)**
```
#!/bin/bash
TEST_TMPDIR=/dev/shm/testdb
START=1
NUM_DATA_ENTRY=8
N=10
rm -f compact_bmk_output.txt compact_bmk_output_2.txt dont_care_output.txt
for i in $(eval echo "{$START..$NUM_DATA_ENTRY}")
do
NUM_RUN=$(($N*(2**($i-1))))
for j in $(eval echo "{$START..$NUM_RUN}")
do
./db_bench --benchmarks=fillrandom -db=$TEST_TMPDIR -disable_auto_compactions=1 -write_buffer_size=6710886 > dont_care_output.txt && ./db_bench --benchmarks=compact -use_existing_db=1 -db=$TEST_TMPDIR -level0_file_num_compaction_trigger=1 -rate_limiter_bytes_per_sec=100000000 | egrep 'compact'
done > compact_bmk_output.txt && awk -v NUM_RUN=$NUM_RUN '{sum+=$3;sum_sqrt+=$3^2}END{print sum/NUM_RUN, sqrt(sum_sqrt/NUM_RUN-(sum/NUM_RUN)^2)}' compact_bmk_output.txt >> compact_bmk_output_2.txt
done
```
- compaction w/o rate-limiting (see table 2, avg over 640-run): pre-change: **822197 micros/op**; post-change: **823148 micros/op (regressed by 0.12%)**
```
Same as above script, except that -rate_limiter_bytes_per_sec=0
```
- flush with rate-limiting (see table 3, avg over 320-run, run on the [patch](https://github.com/hx235/rocksdb/commit/ee5c6023a9f6533fab9afdc681568daa21da4953) to augment current db_bench ): pre-change: **745752 micros/op**; post-change: **745331 micros/op (regressed by 0.06 %)**
```
#!/bin/bash
TEST_TMPDIR=/dev/shm/testdb
START=1
NUM_DATA_ENTRY=8
N=10
rm -f flush_bmk_output.txt flush_bmk_output_2.txt
for i in $(eval echo "{$START..$NUM_DATA_ENTRY}")
do
NUM_RUN=$(($N*(2**($i-1))))
for j in $(eval echo "{$START..$NUM_RUN}")
do
./db_bench -db=$TEST_TMPDIR -write_buffer_size=1048576000 -num=1000000 -rate_limiter_bytes_per_sec=100000000 -benchmarks=fillseq,flush | egrep 'flush'
done > flush_bmk_output.txt && awk -v NUM_RUN=$NUM_RUN '{sum+=$3;sum_sqrt+=$3^2}END{print sum/NUM_RUN, sqrt(sum_sqrt/NUM_RUN-(sum/NUM_RUN)^2)}' flush_bmk_output.txt >> flush_bmk_output_2.txt
done
```
- flush w/o rate-limiting (see table 4, avg over 320-run, run on the [patch](https://github.com/hx235/rocksdb/commit/ee5c6023a9f6533fab9afdc681568daa21da4953) to augment current db_bench): pre-change: **487512 micros/op**, post-change: **485856 micors/ops (improved by 0.34%)**
```
Same as above script, except that -rate_limiter_bytes_per_sec=0
```
| table 1 - compact with rate-limiting|
#-run | (pre-change) avg micros/op | std micros/op | (post-change) avg micros/op | std micros/op | change in avg micros/op (%)
-- | -- | -- | -- | -- | --
10 | 896978 | 16046.9 | 901242 | 15670.9 | 0.475373978
20 | 893718 | 15813 | 886505 | 17544.7 | -0.8070778478
40 | 900426 | 23882.2 | 894958 | 15104.5 | -0.6072681153
80 | 906635 | 21761.5 | 903332 | 23948.3 | -0.3643141948
160 | 898632 | 21098.9 | 907583 | 21145 | 0.9960695813
3.20E+02 | 905252 | 22785.5 | 908106 | 25325.5 | 0.3152713278
6.40E+02 | 905213 | 23598.6 | 906741 | 21370.5 | 0.1688000504
**1.28E+03** | **908316** | **23533.1** | **907350** | **24626.8** | **-0.1063506533**
average over #-run | 901896.25 | 21064.9625 | 901977.125 | 20592.025 | 0.008967217682
| table 2 - compact w/o rate-limiting|
#-run | (pre-change) avg micros/op | std micros/op | (post-change) avg micros/op | std micros/op | change in avg micros/op (%)
-- | -- | -- | -- | -- | --
10 | 811211 | 26996.7 | 807586 | 28456.4 | -0.4468627768
20 | 815465 | 14803.7 | 814608 | 28719.7 | -0.105093413
40 | 809203 | 26187.1 | 797835 | 25492.1 | -1.404839082
80 | 822088 | 28765.3 | 822192 | 32840.4 | 0.01265071379
160 | 821719 | 36344.7 | 821664 | 29544.9 | -0.006693285661
3.20E+02 | 820921 | 27756.4 | 821403 | 28347.7 | 0.05871454135
**6.40E+02** | **822197** | **28960.6** | **823148** | **30055.1** | **0.1156657103**
average over #-run | 8.18E+05 | 2.71E+04 | 8.15E+05 | 2.91E+04 | -0.25
| table 3 - flush with rate-limiting|
#-run | (pre-change) avg micros/op | std micros/op | (post-change) avg micros/op | std micros/op | change in avg micros/op (%)
-- | -- | -- | -- | -- | --
10 | 741721 | 11770.8 | 740345 | 5949.76 | -0.1855144994
20 | 735169 | 3561.83 | 743199 | 9755.77 | 1.09226586
40 | 743368 | 8891.03 | 742102 | 8683.22 | -0.1703059588
80 | 742129 | 8148.51 | 743417 | 9631.58| 0.1735547324
160 | 749045 | 9757.21 | 746256 | 9191.86 | -0.3723407806
**3.20E+02** | **745752** | **9819.65** | **745331** | **9840.62** | **-0.0564530836**
6.40E+02 | 749006 | 11080.5 | 748173 | 10578.7 | -0.1112140624
average over #-run | 743741.4286 | 9004.218571 | 744117.5714 | 9090.215714 | 0.05057441238
| table 4 - flush w/o rate-limiting|
#-run | (pre-change) avg micros/op | std micros/op | (post-change) avg micros/op | std micros/op | change in avg micros/op (%)
-- | -- | -- | -- | -- | --
10 | 477283 | 24719.6 | 473864 | 12379 | -0.7163464863
20 | 486743 | 20175.2 | 502296 | 23931.3 | 3.195320734
40 | 482846 | 15309.2 | 489820 | 22259.5 | 1.444352858
80 | 491490 | 21883.1 | 490071 | 23085.7 | -0.2887139108
160 | 493347 | 28074.3 | 483609 | 21211.7 | -1.973864238
**3.20E+02** | **487512** | **21401.5** | **485856** | **22195.2** | **-0.3396839462**
6.40E+02 | 490307 | 25418.6 | 485435 | 22405.2 | -0.9936631539
average over #-run | 4.87E+05 | 2.24E+04 | 4.87E+05 | 2.11E+04 | 0.00E+00
Reviewed By: ajkr
Differential Revision: D34442441
Pulled By: hx235
fbshipit-source-id: 4790f13e1e5c0a95ae1d1cc93ffcf69dc6e78bdd
2 years ago
|
|
|
|
|
|
|
|
DEFINE_bool(async_io, false,
|
|
|
|
|
"When set true, RocksDB does asynchronous reads for internal auto "
|
|
|
|
|
"readahead prefetching.");
|
|
|
|
|
|
|
|
|
|
DEFINE_bool(reserve_table_reader_memory, false,
|
|
|
|
|
"A dynamically updating charge to block cache, loosely based on "
|
|
|
|
|
"the actual memory usage of table reader, will occur to account "
|
|
|
|
|
"the memory, if block cache available.");
|
|
|
|
|
|
|
|
|
|
static enum ROCKSDB_NAMESPACE::CompressionType StringToCompressionType(
|
|
|
|
|
const char* ctype) {
|
|
|
|
|
assert(ctype);
|
|
|
|
|
|
|
|
|
|
if (!strcasecmp(ctype, "none"))
|
|
|
|
|
return ROCKSDB_NAMESPACE::kNoCompression;
|
|
|
|
|
else if (!strcasecmp(ctype, "snappy"))
|
|
|
|
|
return ROCKSDB_NAMESPACE::kSnappyCompression;
|
|
|
|
|
else if (!strcasecmp(ctype, "zlib"))
|
|
|
|
|
return ROCKSDB_NAMESPACE::kZlibCompression;
|
|
|
|
|
else if (!strcasecmp(ctype, "bzip2"))
|
|
|
|
|
return ROCKSDB_NAMESPACE::kBZip2Compression;
|
|
|
|
|
else if (!strcasecmp(ctype, "lz4"))
|
|
|
|
|
return ROCKSDB_NAMESPACE::kLZ4Compression;
|
|
|
|
|
else if (!strcasecmp(ctype, "lz4hc"))
|
|
|
|
|
return ROCKSDB_NAMESPACE::kLZ4HCCompression;
|
|
|
|
|
else if (!strcasecmp(ctype, "xpress"))
|
|
|
|
|
return ROCKSDB_NAMESPACE::kXpressCompression;
|
|
|
|
|
else if (!strcasecmp(ctype, "zstd"))
|
|
|
|
|
return ROCKSDB_NAMESPACE::kZSTD;
|
|
|
|
|
else {
|
|
|
|
|
fprintf(stderr, "Cannot parse compression type '%s'\n", ctype);
|
|
|
|
|
exit(1);
|
|
|
|
|
}
|
|
|
|
|
}
|
|
|
|
|
|
|
|
|
|
static std::string ColumnFamilyName(size_t i) {
|
|
|
|
|
if (i == 0) {
|
|
|
|
|
return ROCKSDB_NAMESPACE::kDefaultColumnFamilyName;
|
|
|
|
|
} else {
|
|
|
|
|
char name[100];
|
|
|
|
|
snprintf(name, sizeof(name), "column_family_name_%06zu", i);
|
|
|
|
|
return std::string(name);
|
|
|
|
|
}
|
|
|
|
|
}
|
|
|
|
|
|
|
|
|
|
DEFINE_string(compression_type, "snappy",
|
|
|
|
|
"Algorithm to use to compress the database");
|
|
|
|
|
static enum ROCKSDB_NAMESPACE::CompressionType FLAGS_compression_type_e =
|
|
|
|
|
ROCKSDB_NAMESPACE::kSnappyCompression;
|
|
|
|
|
|
|
|
|
|
DEFINE_int64(sample_for_compression, 0, "Sample every N block for compression");
|
|
|
|
|
|
|
|
|
|
DEFINE_int32(compression_level, ROCKSDB_NAMESPACE::CompressionOptions().level,
|
|
|
|
|
"Compression level. The meaning of this value is library-"
|
|
|
|
|
"dependent. If unset, we try to use the default for the library "
|
|
|
|
|
"specified in `--compression_type`");
|
|
|
|
|
|
|
|
|
|
DEFINE_int32(compression_max_dict_bytes,
|
|
|
|
|
ROCKSDB_NAMESPACE::CompressionOptions().max_dict_bytes,
|
|
|
|
|
"Maximum size of dictionary used to prime the compression "
|
|
|
|
|
"library.");
|
|
|
|
|
|
|
|
|
|
DEFINE_int32(compression_zstd_max_train_bytes,
|
|
|
|
|
ROCKSDB_NAMESPACE::CompressionOptions().zstd_max_train_bytes,
|
|
|
|
|
"Maximum size of training data passed to zstd's dictionary "
|
|
|
|
|
"trainer.");
|
|
|
|
|
|
|
|
|
|
DEFINE_int32(min_level_to_compress, -1, "If non-negative, compression starts"
|
|
|
|
|
" from this level. Levels with number < min_level_to_compress are"
|
|
|
|
|
" not compressed. Otherwise, apply compression_type to "
|
|
|
|
|
"all levels.");
|
|
|
|
|
|
|
|
|
|
DEFINE_int32(compression_parallel_threads, 1,
|
|
|
|
|
"Number of threads for parallel compression.");
|
|
|
|
|
|
Limit buffering for collecting samples for compression dictionary (#7970)
Summary:
For dictionary compression, we need to collect some representative samples of the data to be compressed, which we use to either generate or train (when `CompressionOptions::zstd_max_train_bytes > 0`) a dictionary. Previously, the strategy was to buffer all the data blocks during flush, and up to the target file size during compaction. That strategy allowed us to randomly pick samples from as wide a range as possible that'd be guaranteed to land in a single output file.
However, some users try to make huge files in memory-constrained environments, where this strategy can cause OOM. This PR introduces an option, `CompressionOptions::max_dict_buffer_bytes`, that limits how much data blocks are buffered before we switch to unbuffered mode (which means creating the per-SST dictionary, writing out the buffered data, and compressing/writing new blocks as soon as they are built). It is not strict as we currently buffer more than just data blocks -- also keys are buffered. But it does make a step towards giving users predictable memory usage.
Related changes include:
- Changed sampling for dictionary compression to select unique data blocks when there is limited availability of data blocks
- Made use of `BlockBuilder::SwapAndReset()` to save an allocation+memcpy when buffering data blocks for building a dictionary
- Changed `ParseBoolean()` to accept an input containing characters after the boolean. This is necessary since, with this PR, a value for `CompressionOptions::enabled` is no longer necessarily the final component in the `CompressionOptions` string.
Pull Request resolved: https://github.com/facebook/rocksdb/pull/7970
Test Plan:
- updated `CompressionOptions` unit tests to verify limit is respected (to the extent expected in the current implementation) in various scenarios of flush/compaction to bottommost/non-bottommost level
- looked at jemalloc heap profiles right before and after switching to unbuffered mode during flush/compaction. Verified memory usage in buffering is proportional to the limit set.
Reviewed By: pdillinger
Differential Revision: D26467994
Pulled By: ajkr
fbshipit-source-id: 3da4ef9fba59974e4ef40e40c01611002c861465
3 years ago
|
|
|
DEFINE_uint64(compression_max_dict_buffer_bytes,
|
|
|
|
|
ROCKSDB_NAMESPACE::CompressionOptions().max_dict_buffer_bytes,
|
|
|
|
|
"Maximum bytes to buffer to collect samples for dictionary.");
|
|
|
|
|
|
|
|
|
|
static bool ValidateTableCacheNumshardbits(const char* flagname,
|
|
|
|
|
int32_t value) {
|
|
|
|
|
if (0 >= value || value >= 20) {
|
|
|
|
|
fprintf(stderr, "Invalid value for --%s: %d, must be 0 < val < 20\n",
|
|
|
|
|
flagname, value);
|
|
|
|
|
return false;
|
|
|
|
|
}
|
|
|
|
|
return true;
|
|
|
|
|
}
|
|
|
|
|
DEFINE_int32(table_cache_numshardbits, 4, "");
|
|
|
|
|
|
|
|
|
|
#ifndef ROCKSDB_LITE
|
|
|
|
|
DEFINE_string(env_uri, "",
|
|
|
|
|
"URI for registry Env lookup. Mutually exclusive with --fs_uri");
|
|
|
|
|
DEFINE_string(fs_uri, "",
|
|
|
|
|
"URI for registry Filesystem lookup. Mutually exclusive"
|
|
|
|
|
" with --env_uri."
|
|
|
|
|
" Creates a default environment with the specified filesystem.");
|
|
|
|
|
#endif // ROCKSDB_LITE
|
|
|
|
|
DEFINE_string(simulate_hybrid_fs_file, "",
|
|
|
|
|
"File for Store Metadata for Simulate hybrid FS. Empty means "
|
|
|
|
|
"disable the feature. Now, if it is set, "
|
|
|
|
|
"bottommost_temperature is set to kWarm.");
|
|
|
|
|
DEFINE_int32(simulate_hybrid_hdd_multipliers, 1,
|
|
|
|
|
"In simulate_hybrid_fs_file or simulate_hdd mode, how many HDDs "
|
|
|
|
|
"are simulated.");
|
|
|
|
|
DEFINE_bool(simulate_hdd, false, "Simulate read/write latency on HDD.");
|
|
|
|
|
|
|
|
|
|
static std::shared_ptr<ROCKSDB_NAMESPACE::Env> env_guard;
|
|
|
|
|
|
|
|
|
|
static ROCKSDB_NAMESPACE::Env* FLAGS_env = ROCKSDB_NAMESPACE::Env::Default();
|
|
|
|
|
|
|
|
|
|
DEFINE_int64(stats_interval, 0, "Stats are reported every N operations when "
|
|
|
|
|
"this is greater than zero. When 0 the interval grows over time.");
|
|
|
|
|
|
|
|
|
|
DEFINE_int64(stats_interval_seconds, 0, "Report stats every N seconds. This "
|
|
|
|
|
"overrides stats_interval when both are > 0.");
|
|
|
|
|
|
|
|
|
|
DEFINE_int32(stats_per_interval, 0, "Reports additional stats per interval when"
|
|
|
|
|
" this is greater than 0.");
|
|
|
|
|
|
|
|
|
|
DEFINE_uint64(slow_usecs, 1000000,
|
|
|
|
|
"A message is printed for operations that "
|
|
|
|
|
"take at least this many microseconds.");
|
|
|
|
|
|
db_bench periodically writes QPS to CSV file
Summary:
This is part of an effort to better understand and optimize RocksDB stalls under high load. I added a feature to db_bench to periodically write QPS to CSV files. That way we can nicely see how our QPS changes in time (especially when DB is stalled) and can do a better job of evaluating our stall system (i.e. we want the QPS to be as constant as possible, as opposed to having bunch of stalls)
Cool part of CSV files is that we can easily graph them -- there are a bunch of tools available.
Test Plan:
Ran ./db_bench --report_interval_seconds=10 --benchmarks=fillrandom --num=10000000
and observed this in report.csv:
secs_elapsed,interval_qps
10,2725860
20,1980480
30,1863456
40,1454359
50,1460389
Reviewers: sdong, MarkCallaghan, rven, yhchiang
Reviewed By: yhchiang
Subscribers: dhruba, leveldb
Differential Revision: https://reviews.facebook.net/D40047
9 years ago
|
|
|
DEFINE_int64(report_interval_seconds, 0,
|
|
|
|
|
"If greater than zero, it will write simple stats in CSV format "
|
db_bench periodically writes QPS to CSV file
Summary:
This is part of an effort to better understand and optimize RocksDB stalls under high load. I added a feature to db_bench to periodically write QPS to CSV files. That way we can nicely see how our QPS changes in time (especially when DB is stalled) and can do a better job of evaluating our stall system (i.e. we want the QPS to be as constant as possible, as opposed to having bunch of stalls)
Cool part of CSV files is that we can easily graph them -- there are a bunch of tools available.
Test Plan:
Ran ./db_bench --report_interval_seconds=10 --benchmarks=fillrandom --num=10000000
and observed this in report.csv:
secs_elapsed,interval_qps
10,2725860
20,1980480
30,1863456
40,1454359
50,1460389
Reviewers: sdong, MarkCallaghan, rven, yhchiang
Reviewed By: yhchiang
Subscribers: dhruba, leveldb
Differential Revision: https://reviews.facebook.net/D40047
9 years ago
|
|
|
"to --report_file every N seconds");
|
|
|
|
|
|
|
|
|
|
DEFINE_string(report_file, "report.csv",
|
|
|
|
|
"Filename where some simple stats are reported to (if "
|
|
|
|
|
"--report_interval_seconds is bigger than 0)");
|
|
|
|
|
|
|
|
|
|
DEFINE_int32(thread_status_per_interval, 0,
|
|
|
|
|
"Takes and report a snapshot of the current status of each thread"
|
|
|
|
|
" when this is greater than 0.");
|
|
|
|
|
|
|
|
|
|
DEFINE_int32(perf_level, ROCKSDB_NAMESPACE::PerfLevel::kDisable,
|
|
|
|
|
"Level of perf collection");
|
|
|
|
|
|
|
|
|
|
DEFINE_uint64(soft_pending_compaction_bytes_limit, 64ull * 1024 * 1024 * 1024,
|
|
|
|
|
"Slowdown writes if pending compaction bytes exceed this number");
|
|
|
|
|
|
|
|
|
|
DEFINE_uint64(hard_pending_compaction_bytes_limit, 128ull * 1024 * 1024 * 1024,
|
|
|
|
|
"Stop writes if pending compaction bytes exceed this number");
|
|
|
|
|
|
|
|
|
|
DEFINE_uint64(delayed_write_rate, 8388608u,
|
|
|
|
|
"Limited bytes allowed to DB when soft_rate_limit or "
|
|
|
|
|
"level0_slowdown_writes_trigger triggers");
|
|
|
|
|
|
|
|
|
|
DEFINE_bool(enable_pipelined_write, true,
|
|
|
|
|
"Allow WAL and memtable writes to be pipelined");
|
|
|
|
|
|
|
|
|
|
DEFINE_bool(
|
|
|
|
|
unordered_write, false,
|
|
|
|
|
"Enable the unordered write feature, which provides higher throughput but "
|
|
|
|
|
"relaxes the guarantees around atomic reads and immutable snapshots");
|
|
|
|
|
|
|
|
|
|
DEFINE_bool(allow_concurrent_memtable_write, true,
|
support for concurrent adds to memtable
Summary:
This diff adds support for concurrent adds to the skiplist memtable
implementations. Memory allocation is made thread-safe by the addition of
a spinlock, with small per-core buffers to avoid contention. Concurrent
memtable writes are made via an additional method and don't impose a
performance overhead on the non-concurrent case, so parallelism can be
selected on a per-batch basis.
Write thread synchronization is an increasing bottleneck for higher levels
of concurrency, so this diff adds --enable_write_thread_adaptive_yield
(default off). This feature causes threads joining a write batch
group to spin for a short time (default 100 usec) using sched_yield,
rather than going to sleep on a mutex. If the timing of the yield calls
indicates that another thread has actually run during the yield then
spinning is avoided. This option improves performance for concurrent
situations even without parallel adds, although it has the potential to
increase CPU usage (and the heuristic adaptation is not yet mature).
Parallel writes are not currently compatible with
inplace updates, update callbacks, or delete filtering.
Enable it with --allow_concurrent_memtable_write (and
--enable_write_thread_adaptive_yield). Parallel memtable writes
are performance neutral when there is no actual parallelism, and in
my experiments (SSD server-class Linux and varying contention and key
sizes for fillrandom) they are always a performance win when there is
more than one thread.
Statistics are updated earlier in the write path, dropping the number
of DB mutex acquisitions from 2 to 1 for almost all cases.
This diff was motivated and inspired by Yahoo's cLSM work. It is more
conservative than cLSM: RocksDB's write batch group leader role is
preserved (along with all of the existing flush and write throttling
logic) and concurrent writers are blocked until all memtable insertions
have completed and the sequence number has been advanced, to preserve
linearizability.
My test config is "db_bench -benchmarks=fillrandom -threads=$T
-batch_size=1 -memtablerep=skip_list -value_size=100 --num=1000000/$T
-level0_slowdown_writes_trigger=9999 -level0_stop_writes_trigger=9999
-disable_auto_compactions --max_write_buffer_number=8
-max_background_flushes=8 --disable_wal --write_buffer_size=160000000
--block_size=16384 --allow_concurrent_memtable_write" on a two-socket
Xeon E5-2660 @ 2.2Ghz with lots of memory and an SSD hard drive. With 1
thread I get ~440Kops/sec. Peak performance for 1 socket (numactl
-N1) is slightly more than 1Mops/sec, at 16 threads. Peak performance
across both sockets happens at 30 threads, and is ~900Kops/sec, although
with fewer threads there is less performance loss when the system has
background work.
Test Plan:
1. concurrent stress tests for InlineSkipList and DynamicBloom
2. make clean; make check
3. make clean; DISABLE_JEMALLOC=1 make valgrind_check; valgrind db_bench
4. make clean; COMPILE_WITH_TSAN=1 make all check; db_bench
5. make clean; COMPILE_WITH_ASAN=1 make all check; db_bench
6. make clean; OPT=-DROCKSDB_LITE make check
7. verify no perf regressions when disabled
Reviewers: igor, sdong
Reviewed By: sdong
Subscribers: MarkCallaghan, IslamAbdelRahman, anthony, yhchiang, rven, sdong, guyg8, kradhakrishnan, dhruba
Differential Revision: https://reviews.facebook.net/D50589
9 years ago
|
|
|
"Allow multi-writers to update mem tables in parallel.");
|
|
|
|
|
|
|
|
|
|
DEFINE_double(experimental_mempurge_threshold, 0.0,
|
|
|
|
|
"Maximum useful payload ratio estimate that triggers a mempurge "
|
|
|
|
|
"(memtable garbage collection).");
|
Add simple heuristics for experimental mempurge. (#8583)
Summary:
Add `experimental_mempurge_policy` option flag and introduce two new `MemPurge` (Memtable Garbage Collection) policies: 'ALWAYS' and 'ALTERNATE'. Default value: ALTERNATE.
`ALWAYS`: every flush will first go through a `MemPurge` process. If the output is too big to fit into a single memtable, then the mempurge is aborted and a regular flush process carries on. `ALWAYS` is designed for user that need to reduce the number of L0 SST file created to a strict minimum, and can afford a small dent in performance (possibly hits to CPU usage, read efficiency, and maximum burst write throughput).
`ALTERNATE`: a flush is transformed into a `MemPurge` except if one of the memtables being flushed is the product of a previous `MemPurge`. `ALTERNATE` is a good tradeoff between reduction in number of L0 SST files created and performance. `ALTERNATE` perform particularly well for completely random garbage ratios, or garbage ratios anywhere in (0%,50%], and even higher when there is a wild variability in garbage ratios.
This PR also includes support for `experimental_mempurge_policy` in `db_bench`.
Testing was done locally by replacing all the `MemPurge` policies of the unit tests with `ALTERNATE`, as well as local testing with `db_crashtest.py` `whitebox` and `blackbox`. Overall, if an `ALWAYS` mempurge policy passes the tests, there is no reasons why an `ALTERNATE` policy would fail, and therefore the mempurge policy was set to `ALWAYS` for all mempurge unit tests.
Pull Request resolved: https://github.com/facebook/rocksdb/pull/8583
Reviewed By: pdillinger
Differential Revision: D29888050
Pulled By: bjlemaire
fbshipit-source-id: e2cf26646d66679f6f5fb29842624615610759c1
3 years ago
|
|
|
|
|
|
|
|
DEFINE_bool(inplace_update_support,
|
|
|
|
|
ROCKSDB_NAMESPACE::Options().inplace_update_support,
|
|
|
|
|
"Support in-place memtable update for smaller or same-size values");
|
|
|
|
|
|
|
|
|
|
DEFINE_uint64(inplace_update_num_locks,
|
|
|
|
|
ROCKSDB_NAMESPACE::Options().inplace_update_num_locks,
|
|
|
|
|
"Number of RW locks to protect in-place memtable updates");
|
|
|
|
|
|
|
|
|
|
DEFINE_bool(enable_write_thread_adaptive_yield, true,
|
support for concurrent adds to memtable
Summary:
This diff adds support for concurrent adds to the skiplist memtable
implementations. Memory allocation is made thread-safe by the addition of
a spinlock, with small per-core buffers to avoid contention. Concurrent
memtable writes are made via an additional method and don't impose a
performance overhead on the non-concurrent case, so parallelism can be
selected on a per-batch basis.
Write thread synchronization is an increasing bottleneck for higher levels
of concurrency, so this diff adds --enable_write_thread_adaptive_yield
(default off). This feature causes threads joining a write batch
group to spin for a short time (default 100 usec) using sched_yield,
rather than going to sleep on a mutex. If the timing of the yield calls
indicates that another thread has actually run during the yield then
spinning is avoided. This option improves performance for concurrent
situations even without parallel adds, although it has the potential to
increase CPU usage (and the heuristic adaptation is not yet mature).
Parallel writes are not currently compatible with
inplace updates, update callbacks, or delete filtering.
Enable it with --allow_concurrent_memtable_write (and
--enable_write_thread_adaptive_yield). Parallel memtable writes
are performance neutral when there is no actual parallelism, and in
my experiments (SSD server-class Linux and varying contention and key
sizes for fillrandom) they are always a performance win when there is
more than one thread.
Statistics are updated earlier in the write path, dropping the number
of DB mutex acquisitions from 2 to 1 for almost all cases.
This diff was motivated and inspired by Yahoo's cLSM work. It is more
conservative than cLSM: RocksDB's write batch group leader role is
preserved (along with all of the existing flush and write throttling
logic) and concurrent writers are blocked until all memtable insertions
have completed and the sequence number has been advanced, to preserve
linearizability.
My test config is "db_bench -benchmarks=fillrandom -threads=$T
-batch_size=1 -memtablerep=skip_list -value_size=100 --num=1000000/$T
-level0_slowdown_writes_trigger=9999 -level0_stop_writes_trigger=9999
-disable_auto_compactions --max_write_buffer_number=8
-max_background_flushes=8 --disable_wal --write_buffer_size=160000000
--block_size=16384 --allow_concurrent_memtable_write" on a two-socket
Xeon E5-2660 @ 2.2Ghz with lots of memory and an SSD hard drive. With 1
thread I get ~440Kops/sec. Peak performance for 1 socket (numactl
-N1) is slightly more than 1Mops/sec, at 16 threads. Peak performance
across both sockets happens at 30 threads, and is ~900Kops/sec, although
with fewer threads there is less performance loss when the system has
background work.
Test Plan:
1. concurrent stress tests for InlineSkipList and DynamicBloom
2. make clean; make check
3. make clean; DISABLE_JEMALLOC=1 make valgrind_check; valgrind db_bench
4. make clean; COMPILE_WITH_TSAN=1 make all check; db_bench
5. make clean; COMPILE_WITH_ASAN=1 make all check; db_bench
6. make clean; OPT=-DROCKSDB_LITE make check
7. verify no perf regressions when disabled
Reviewers: igor, sdong
Reviewed By: sdong
Subscribers: MarkCallaghan, IslamAbdelRahman, anthony, yhchiang, rven, sdong, guyg8, kradhakrishnan, dhruba
Differential Revision: https://reviews.facebook.net/D50589
9 years ago
|
|
|
"Use a yielding spin loop for brief writer thread waits.");
|
|
|
|
|
|
|
|
|
|
DEFINE_uint64(
|
|
|
|
|
write_thread_max_yield_usec, 100,
|
|
|
|
|
"Maximum microseconds for enable_write_thread_adaptive_yield operation.");
|
|
|
|
|
|
|
|
|
|
DEFINE_uint64(write_thread_slow_yield_usec, 3,
|
|
|
|
|
"The threshold at which a slow yield is considered a signal that "
|
|
|
|
|
"other processes or threads want the core.");
|
|
|
|
|
|
|
|
|
|
DEFINE_uint64(rate_limiter_bytes_per_sec, 0, "Set options.rate_limiter value.");
|
|
|
|
|
|
Simplify GenericRateLimiter algorithm (#8602)
Summary:
`GenericRateLimiter` slow path handles requests that cannot be satisfied
immediately. Such requests enter a queue, and their thread stays in `Request()`
until they are granted or the rate limiter is stopped. These threads are
responsible for unblocking themselves. The work to do so is split into two main
duties.
(1) Waiting for the next refill time.
(2) Refilling the bytes and granting requests.
Prior to this PR, the slow path logic involved a leader election algorithm to
pick one thread to perform (1) followed by (2). It elected the thread whose
request was at the front of the highest priority non-empty queue since that
request was most likely to be granted. This algorithm was efficient in terms of
reducing intermediate wakeups, which is a thread waking up only to resume
waiting after finding its request is not granted. However, the conceptual
complexity of this algorithm was too high. It took me a long time to draw a
timeline to understand how it works for just one edge case yet there were so
many.
This PR drops the leader election to reduce conceptual complexity. Now, the two
duties can be performed by whichever thread acquires the lock first. The risk
of this change is increasing the number of intermediate wakeups, however, we
took steps to mitigate that.
- `wait_until_refill_pending_` flag ensures only one thread performs (1). This\
prevents the thundering herd problem at the next refill time. The remaining\
threads wait on their condition variable with an unbounded duration -- thus we\
must remember to notify them to ensure forward progress.
- (1) is typically done by a thread at the front of a queue. This is trivial\
when the queues are initially empty as the first choice that arrives must be\
the only entry in its queue. When queues are initially non-empty, we achieve\
this by having (2) notify a thread at the front of a queue (preferring higher\
priority) to perform the next duty.
- We do not require any additional wakeup for (2). Typically it will just be\
done by the thread that finished (1).
Combined, the second and third bullet points above suggest the refill/granting
will typically be done by a request at the front of its queue. This is
important because one wakeup is saved when a granted request happens to be in an
already running thread.
Note there are a few cases that still lead to intermediate wakeup, however. The
first two are existing issues that also apply to the old algorithm, however, the
third (including both subpoints) is new.
- No request may be granted (only possible when rate limit dynamically\
decreases).
- Requests from a different queue may be granted.
- (2) may be run by a non-front request thread causing it to not be granted even\
if some requests in that same queue are granted. It can happen for a couple\
(unlikely) reasons.
- A new request may sneak in and grab the lock at the refill time, before the\
thread finishing (1) can wake up and grab it.
- A new request may sneak in and grab the lock and execute (1) before (2)'s\
chosen candidate can wake up and grab the lock. Then that non-front request\
thread performing (1) can carry over to perform (2).
Pull Request resolved: https://github.com/facebook/rocksdb/pull/8602
Test Plan:
- Use existing tests. The edge cases listed in the comment are all performance\
related; I could not really think of any related to correctness. The logic\
looks the same whether a thread wakes up/finishes its work early/on-time/late,\
or whether the thread is chosen vs. "steals" the work.
- Verified write throughput and CPU overhead are basically the same with and\
without this change, even in a rate limiter heavy workload:
Test command:
```
$ rm -rf /dev/shm/dbbench/ && TEST_TMPDIR=/dev/shm /usr/bin/time ./db_bench -benchmarks=fillrandom -num_multi_db=64 -num_low_pri_threads=64 -num_high_pri_threads=64 -write_buffer_size=262144 -target_file_size_base=262144 -max_bytes_for_level_base=1048576 -rate_limiter_bytes_per_sec=16777216 -key_size=24 -value_size=1000 -num=10000 -compression_type=none -rate_limiter_refill_period_us=1000
```
Results before this PR:
```
fillrandom : 108.463 micros/op 9219 ops/sec; 9.0 MB/s
7.40user 8.84system 1:26.20elapsed 18%CPU (0avgtext+0avgdata 256140maxresident)k
```
Results after this PR:
```
fillrandom : 108.108 micros/op 9250 ops/sec; 9.0 MB/s
7.45user 8.23system 1:26.68elapsed 18%CPU (0avgtext+0avgdata 255688maxresident)k
```
Reviewed By: hx235
Differential Revision: D30048013
Pulled By: ajkr
fbshipit-source-id: 6741bba9d9dfbccab359806d725105817fef818b
3 years ago
|
|
|
DEFINE_int64(rate_limiter_refill_period_us, 100 * 1000,
|
|
|
|
|
"Set refill period on rate limiter.");
|
Simplify GenericRateLimiter algorithm (#8602)
Summary:
`GenericRateLimiter` slow path handles requests that cannot be satisfied
immediately. Such requests enter a queue, and their thread stays in `Request()`
until they are granted or the rate limiter is stopped. These threads are
responsible for unblocking themselves. The work to do so is split into two main
duties.
(1) Waiting for the next refill time.
(2) Refilling the bytes and granting requests.
Prior to this PR, the slow path logic involved a leader election algorithm to
pick one thread to perform (1) followed by (2). It elected the thread whose
request was at the front of the highest priority non-empty queue since that
request was most likely to be granted. This algorithm was efficient in terms of
reducing intermediate wakeups, which is a thread waking up only to resume
waiting after finding its request is not granted. However, the conceptual
complexity of this algorithm was too high. It took me a long time to draw a
timeline to understand how it works for just one edge case yet there were so
many.
This PR drops the leader election to reduce conceptual complexity. Now, the two
duties can be performed by whichever thread acquires the lock first. The risk
of this change is increasing the number of intermediate wakeups, however, we
took steps to mitigate that.
- `wait_until_refill_pending_` flag ensures only one thread performs (1). This\
prevents the thundering herd problem at the next refill time. The remaining\
threads wait on their condition variable with an unbounded duration -- thus we\
must remember to notify them to ensure forward progress.
- (1) is typically done by a thread at the front of a queue. This is trivial\
when the queues are initially empty as the first choice that arrives must be\
the only entry in its queue. When queues are initially non-empty, we achieve\
this by having (2) notify a thread at the front of a queue (preferring higher\
priority) to perform the next duty.
- We do not require any additional wakeup for (2). Typically it will just be\
done by the thread that finished (1).
Combined, the second and third bullet points above suggest the refill/granting
will typically be done by a request at the front of its queue. This is
important because one wakeup is saved when a granted request happens to be in an
already running thread.
Note there are a few cases that still lead to intermediate wakeup, however. The
first two are existing issues that also apply to the old algorithm, however, the
third (including both subpoints) is new.
- No request may be granted (only possible when rate limit dynamically\
decreases).
- Requests from a different queue may be granted.
- (2) may be run by a non-front request thread causing it to not be granted even\
if some requests in that same queue are granted. It can happen for a couple\
(unlikely) reasons.
- A new request may sneak in and grab the lock at the refill time, before the\
thread finishing (1) can wake up and grab it.
- A new request may sneak in and grab the lock and execute (1) before (2)'s\
chosen candidate can wake up and grab the lock. Then that non-front request\
thread performing (1) can carry over to perform (2).
Pull Request resolved: https://github.com/facebook/rocksdb/pull/8602
Test Plan:
- Use existing tests. The edge cases listed in the comment are all performance\
related; I could not really think of any related to correctness. The logic\
looks the same whether a thread wakes up/finishes its work early/on-time/late,\
or whether the thread is chosen vs. "steals" the work.
- Verified write throughput and CPU overhead are basically the same with and\
without this change, even in a rate limiter heavy workload:
Test command:
```
$ rm -rf /dev/shm/dbbench/ && TEST_TMPDIR=/dev/shm /usr/bin/time ./db_bench -benchmarks=fillrandom -num_multi_db=64 -num_low_pri_threads=64 -num_high_pri_threads=64 -write_buffer_size=262144 -target_file_size_base=262144 -max_bytes_for_level_base=1048576 -rate_limiter_bytes_per_sec=16777216 -key_size=24 -value_size=1000 -num=10000 -compression_type=none -rate_limiter_refill_period_us=1000
```
Results before this PR:
```
fillrandom : 108.463 micros/op 9219 ops/sec; 9.0 MB/s
7.40user 8.84system 1:26.20elapsed 18%CPU (0avgtext+0avgdata 256140maxresident)k
```
Results after this PR:
```
fillrandom : 108.108 micros/op 9250 ops/sec; 9.0 MB/s
7.45user 8.23system 1:26.68elapsed 18%CPU (0avgtext+0avgdata 255688maxresident)k
```
Reviewed By: hx235
Differential Revision: D30048013
Pulled By: ajkr
fbshipit-source-id: 6741bba9d9dfbccab359806d725105817fef818b
3 years ago
|
|
|
|
|
|
|
|
DEFINE_bool(rate_limiter_auto_tuned, false,
|
|
|
|
|
"Enable dynamic adjustment of rate limit according to demand for "
|
|
|
|
|
"background I/O");
|
|
|
|
|
|
|
|
|
|
|
|
|
|
|
DEFINE_bool(sine_write_rate, false,
|
|
|
|
|
"Use a sine wave write_rate_limit");
|
|
|
|
|
|
|
|
|
|
DEFINE_uint64(sine_write_rate_interval_milliseconds, 10000,
|
|
|
|
|
"Interval of which the sine wave write_rate_limit is recalculated");
|
|
|
|
|
|
|
|
|
|
DEFINE_double(sine_a, 1,
|
|
|
|
|
"A in f(x) = A sin(bx + c) + d");
|
|
|
|
|
|
|
|
|
|
DEFINE_double(sine_b, 1,
|
|
|
|
|
"B in f(x) = A sin(bx + c) + d");
|
|
|
|
|
|
|
|
|
|
DEFINE_double(sine_c, 0,
|
|
|
|
|
"C in f(x) = A sin(bx + c) + d");
|
|
|
|
|
|
|
|
|
|
DEFINE_double(sine_d, 1,
|
|
|
|
|
"D in f(x) = A sin(bx + c) + d");
|
|
|
|
|
|
|
|
|
|
DEFINE_bool(rate_limit_bg_reads, false,
|
|
|
|
|
"Use options.rate_limiter on compaction reads");
|
|
|
|
|
|
|
|
|
|
DEFINE_uint64(
|
|
|
|
|
benchmark_write_rate_limit, 0,
|
|
|
|
|
"If non-zero, db_bench will rate-limit the writes going into RocksDB. This "
|
|
|
|
|
"is the global rate in bytes/second.");
|
|
|
|
|
|
Generate mixed workload with Get, Put, Seek in db_bench (#4788)
Summary:
Based on the specific workload models (key access distribution, value size distribution, and iterator scan length distribution, the QPS variation), the MixGraph benchmark generate the synthetic workload according to these distributions which can reflect the real-world workload characteristics.
After user enable the tracing function, they will get the trace file. By analyzing the trace file with the trace_analyzer tool, user can generate a set of statistic data files including. The *_accessed_key_stats.txt, *-accessed_value_size_distribution.txt, *-iterator_length_distribution.txt, and *-qps_stats.txt are mainly used to fit the Matlab model fitting. After that, user can get the parameters of the workload distributions (the modeling details are described: [here](https://github.com/facebook/rocksdb/wiki/RocksDB-Trace%2C-Replay%2C-and-Analyzer))
The key access distribution follows the The two-term power model. The probability density function is: `f(x) = ax^{b}+c`. The corresponding parameters are key_dist_a, key_dist_b, and key_dist_c in db_bench
For the value size distribution and iterator scan length distribution, they both follow the Generalized Pareto Distribution. The probability density function is `f(x) = (1/sigma)(1+k*(x-theta)/sigma))^{-1-1/k)`. The parameters are: value_k, value_theta, value_sigma and iter_k, iter_theta, iter_sigma. For more information about the Generalized Pareto Distribution, users can find the [wiki](https://en.wikipedia.org/wiki/Generalized_Pareto_distribution) and [Matalb page](https://www.mathworks.com/help/stats/generalized-pareto-distribution.html)
As for the QPS, it follows the diurnal pattern. So Sine is a good model to fit it. `F(x) = sine_a*sin(sine_b*x + sine_c) + sine_d`. The trace_will tell you the average QPS in the print out resutls, which is sine_d. After user fit the "*-qps_stats.txt" to the Matlab model, user can get the sine_a, sine_b, and sine_c. By using the 4 parameters, user can control the QPS variation including the period, average, changes.
To use the bench mark, user can indicate the following parameters as examples:
```
-benchmarks="mixgraph" -key_dist_a=0.002312 -key_dist_b=0.3467 -value_k=0.9233 -value_sigma=226.4092 -iter_k=2.517 -iter_sigma=14.236 -mix_get_ratio=0.7 -mix_put_ratio=0.25 -mix_seek_ratio=0.05 -sine_mix_rate_interval_milliseconds=500 -sine_a=15000 -sine_b=1 -sine_d=20000
```
Pull Request resolved: https://github.com/facebook/rocksdb/pull/4788
Differential Revision: D13573940
Pulled By: sagar0
fbshipit-source-id: e184c27e07b4f1bc0b436c2be36c5090c1fb0222
6 years ago
|
|
|
// the parameters of mix_graph
|
Workload generator (Mixgraph) based on prefix hotness (#5953)
Summary:
In the previous PR https://github.com/facebook/rocksdb/issues/4788, user can use db_bench mix_graph option to generate the workload that is from the social graph. The key is generated based on the key access hotness. In this PR, user can further model the key-range hotness and fit those to two-term-exponential distribution. First, user cuts the whole key space into small key ranges (e.g., key-ranges are the same size and the key-range number is the number of SST files). Then, user calculates the average access count per key of each key-range as the key-range hotness. Next, user fits the key-range hotness to two-term-exponential distribution (f(x) = f(x) = a*exp(b*x) + c*exp(d*x)) and generate the value of a, b, c, and d. They are the parameters in db_bench: prefix_dist_a, prefix_dist_b, prefix_dist_c, and prefix_dist_d. Finally, user can run db_bench by specify the parameters.
For example:
`./db_bench --benchmarks="mixgraph" -use_direct_io_for_flush_and_compaction=true -use_direct_reads=true -cache_size=268435456 -key_dist_a=0.002312 -key_dist_b=0.3467 -keyrange_dist_a=14.18 -keyrange_dist_b=-2.917 -keyrange_dist_c=0.0164 -keyrange_dist_d=-0.08082 -keyrange_num=30 -value_k=0.2615 -value_sigma=25.45 -iter_k=2.517 -iter_sigma=14.236 -mix_get_ratio=0.85 -mix_put_ratio=0.14 -mix_seek_ratio=0.01 -sine_mix_rate_interval_milliseconds=5000 -sine_a=350 -sine_b=0.0105 -sine_d=50000 --perf_level=2 -reads=1000000 -num=5000000 -key_size=48`
Pull Request resolved: https://github.com/facebook/rocksdb/pull/5953
Test Plan: run db_bench with different parameters and checked the results.
Differential Revision: D18053527
Pulled By: zhichao-cao
fbshipit-source-id: 171f8b3142bd76462f1967c58345ad7e4f84bab7
5 years ago
|
|
|
DEFINE_double(keyrange_dist_a, 0.0,
|
|
|
|
|
"The parameter 'a' of prefix average access distribution "
|
|
|
|
|
"f(x)=a*exp(b*x)+c*exp(d*x)");
|
|
|
|
|
DEFINE_double(keyrange_dist_b, 0.0,
|
|
|
|
|
"The parameter 'b' of prefix average access distribution "
|
|
|
|
|
"f(x)=a*exp(b*x)+c*exp(d*x)");
|
|
|
|
|
DEFINE_double(keyrange_dist_c, 0.0,
|
|
|
|
|
"The parameter 'c' of prefix average access distribution"
|
|
|
|
|
"f(x)=a*exp(b*x)+c*exp(d*x)");
|
|
|
|
|
DEFINE_double(keyrange_dist_d, 0.0,
|
|
|
|
|
"The parameter 'd' of prefix average access distribution"
|
|
|
|
|
"f(x)=a*exp(b*x)+c*exp(d*x)");
|
|
|
|
|
DEFINE_int64(keyrange_num, 1,
|
|
|
|
|
"The number of key ranges that are in the same prefix "
|
|
|
|
|
"group, each prefix range will have its key access distribution");
|
Generate mixed workload with Get, Put, Seek in db_bench (#4788)
Summary:
Based on the specific workload models (key access distribution, value size distribution, and iterator scan length distribution, the QPS variation), the MixGraph benchmark generate the synthetic workload according to these distributions which can reflect the real-world workload characteristics.
After user enable the tracing function, they will get the trace file. By analyzing the trace file with the trace_analyzer tool, user can generate a set of statistic data files including. The *_accessed_key_stats.txt, *-accessed_value_size_distribution.txt, *-iterator_length_distribution.txt, and *-qps_stats.txt are mainly used to fit the Matlab model fitting. After that, user can get the parameters of the workload distributions (the modeling details are described: [here](https://github.com/facebook/rocksdb/wiki/RocksDB-Trace%2C-Replay%2C-and-Analyzer))
The key access distribution follows the The two-term power model. The probability density function is: `f(x) = ax^{b}+c`. The corresponding parameters are key_dist_a, key_dist_b, and key_dist_c in db_bench
For the value size distribution and iterator scan length distribution, they both follow the Generalized Pareto Distribution. The probability density function is `f(x) = (1/sigma)(1+k*(x-theta)/sigma))^{-1-1/k)`. The parameters are: value_k, value_theta, value_sigma and iter_k, iter_theta, iter_sigma. For more information about the Generalized Pareto Distribution, users can find the [wiki](https://en.wikipedia.org/wiki/Generalized_Pareto_distribution) and [Matalb page](https://www.mathworks.com/help/stats/generalized-pareto-distribution.html)
As for the QPS, it follows the diurnal pattern. So Sine is a good model to fit it. `F(x) = sine_a*sin(sine_b*x + sine_c) + sine_d`. The trace_will tell you the average QPS in the print out resutls, which is sine_d. After user fit the "*-qps_stats.txt" to the Matlab model, user can get the sine_a, sine_b, and sine_c. By using the 4 parameters, user can control the QPS variation including the period, average, changes.
To use the bench mark, user can indicate the following parameters as examples:
```
-benchmarks="mixgraph" -key_dist_a=0.002312 -key_dist_b=0.3467 -value_k=0.9233 -value_sigma=226.4092 -iter_k=2.517 -iter_sigma=14.236 -mix_get_ratio=0.7 -mix_put_ratio=0.25 -mix_seek_ratio=0.05 -sine_mix_rate_interval_milliseconds=500 -sine_a=15000 -sine_b=1 -sine_d=20000
```
Pull Request resolved: https://github.com/facebook/rocksdb/pull/4788
Differential Revision: D13573940
Pulled By: sagar0
fbshipit-source-id: e184c27e07b4f1bc0b436c2be36c5090c1fb0222
6 years ago
|
|
|
DEFINE_double(key_dist_a, 0.0,
|
|
|
|
|
"The parameter 'a' of key access distribution model f(x)=a*x^b");
|
Generate mixed workload with Get, Put, Seek in db_bench (#4788)
Summary:
Based on the specific workload models (key access distribution, value size distribution, and iterator scan length distribution, the QPS variation), the MixGraph benchmark generate the synthetic workload according to these distributions which can reflect the real-world workload characteristics.
After user enable the tracing function, they will get the trace file. By analyzing the trace file with the trace_analyzer tool, user can generate a set of statistic data files including. The *_accessed_key_stats.txt, *-accessed_value_size_distribution.txt, *-iterator_length_distribution.txt, and *-qps_stats.txt are mainly used to fit the Matlab model fitting. After that, user can get the parameters of the workload distributions (the modeling details are described: [here](https://github.com/facebook/rocksdb/wiki/RocksDB-Trace%2C-Replay%2C-and-Analyzer))
The key access distribution follows the The two-term power model. The probability density function is: `f(x) = ax^{b}+c`. The corresponding parameters are key_dist_a, key_dist_b, and key_dist_c in db_bench
For the value size distribution and iterator scan length distribution, they both follow the Generalized Pareto Distribution. The probability density function is `f(x) = (1/sigma)(1+k*(x-theta)/sigma))^{-1-1/k)`. The parameters are: value_k, value_theta, value_sigma and iter_k, iter_theta, iter_sigma. For more information about the Generalized Pareto Distribution, users can find the [wiki](https://en.wikipedia.org/wiki/Generalized_Pareto_distribution) and [Matalb page](https://www.mathworks.com/help/stats/generalized-pareto-distribution.html)
As for the QPS, it follows the diurnal pattern. So Sine is a good model to fit it. `F(x) = sine_a*sin(sine_b*x + sine_c) + sine_d`. The trace_will tell you the average QPS in the print out resutls, which is sine_d. After user fit the "*-qps_stats.txt" to the Matlab model, user can get the sine_a, sine_b, and sine_c. By using the 4 parameters, user can control the QPS variation including the period, average, changes.
To use the bench mark, user can indicate the following parameters as examples:
```
-benchmarks="mixgraph" -key_dist_a=0.002312 -key_dist_b=0.3467 -value_k=0.9233 -value_sigma=226.4092 -iter_k=2.517 -iter_sigma=14.236 -mix_get_ratio=0.7 -mix_put_ratio=0.25 -mix_seek_ratio=0.05 -sine_mix_rate_interval_milliseconds=500 -sine_a=15000 -sine_b=1 -sine_d=20000
```
Pull Request resolved: https://github.com/facebook/rocksdb/pull/4788
Differential Revision: D13573940
Pulled By: sagar0
fbshipit-source-id: e184c27e07b4f1bc0b436c2be36c5090c1fb0222
6 years ago
|
|
|
DEFINE_double(key_dist_b, 0.0,
|
|
|
|
|
"The parameter 'b' of key access distribution model f(x)=a*x^b");
|
Generate mixed workload with Get, Put, Seek in db_bench (#4788)
Summary:
Based on the specific workload models (key access distribution, value size distribution, and iterator scan length distribution, the QPS variation), the MixGraph benchmark generate the synthetic workload according to these distributions which can reflect the real-world workload characteristics.
After user enable the tracing function, they will get the trace file. By analyzing the trace file with the trace_analyzer tool, user can generate a set of statistic data files including. The *_accessed_key_stats.txt, *-accessed_value_size_distribution.txt, *-iterator_length_distribution.txt, and *-qps_stats.txt are mainly used to fit the Matlab model fitting. After that, user can get the parameters of the workload distributions (the modeling details are described: [here](https://github.com/facebook/rocksdb/wiki/RocksDB-Trace%2C-Replay%2C-and-Analyzer))
The key access distribution follows the The two-term power model. The probability density function is: `f(x) = ax^{b}+c`. The corresponding parameters are key_dist_a, key_dist_b, and key_dist_c in db_bench
For the value size distribution and iterator scan length distribution, they both follow the Generalized Pareto Distribution. The probability density function is `f(x) = (1/sigma)(1+k*(x-theta)/sigma))^{-1-1/k)`. The parameters are: value_k, value_theta, value_sigma and iter_k, iter_theta, iter_sigma. For more information about the Generalized Pareto Distribution, users can find the [wiki](https://en.wikipedia.org/wiki/Generalized_Pareto_distribution) and [Matalb page](https://www.mathworks.com/help/stats/generalized-pareto-distribution.html)
As for the QPS, it follows the diurnal pattern. So Sine is a good model to fit it. `F(x) = sine_a*sin(sine_b*x + sine_c) + sine_d`. The trace_will tell you the average QPS in the print out resutls, which is sine_d. After user fit the "*-qps_stats.txt" to the Matlab model, user can get the sine_a, sine_b, and sine_c. By using the 4 parameters, user can control the QPS variation including the period, average, changes.
To use the bench mark, user can indicate the following parameters as examples:
```
-benchmarks="mixgraph" -key_dist_a=0.002312 -key_dist_b=0.3467 -value_k=0.9233 -value_sigma=226.4092 -iter_k=2.517 -iter_sigma=14.236 -mix_get_ratio=0.7 -mix_put_ratio=0.25 -mix_seek_ratio=0.05 -sine_mix_rate_interval_milliseconds=500 -sine_a=15000 -sine_b=1 -sine_d=20000
```
Pull Request resolved: https://github.com/facebook/rocksdb/pull/4788
Differential Revision: D13573940
Pulled By: sagar0
fbshipit-source-id: e184c27e07b4f1bc0b436c2be36c5090c1fb0222
6 years ago
|
|
|
DEFINE_double(value_theta, 0.0,
|
|
|
|
|
"The parameter 'theta' of Generized Pareto Distribution "
|
|
|
|
|
"f(x)=(1/sigma)*(1+k*(x-theta)/sigma)^-(1/k+1)");
|
|
|
|
|
// Use reasonable defaults based on the mixgraph paper
|
|
|
|
|
DEFINE_double(value_k, 0.2615,
|
Generate mixed workload with Get, Put, Seek in db_bench (#4788)
Summary:
Based on the specific workload models (key access distribution, value size distribution, and iterator scan length distribution, the QPS variation), the MixGraph benchmark generate the synthetic workload according to these distributions which can reflect the real-world workload characteristics.
After user enable the tracing function, they will get the trace file. By analyzing the trace file with the trace_analyzer tool, user can generate a set of statistic data files including. The *_accessed_key_stats.txt, *-accessed_value_size_distribution.txt, *-iterator_length_distribution.txt, and *-qps_stats.txt are mainly used to fit the Matlab model fitting. After that, user can get the parameters of the workload distributions (the modeling details are described: [here](https://github.com/facebook/rocksdb/wiki/RocksDB-Trace%2C-Replay%2C-and-Analyzer))
The key access distribution follows the The two-term power model. The probability density function is: `f(x) = ax^{b}+c`. The corresponding parameters are key_dist_a, key_dist_b, and key_dist_c in db_bench
For the value size distribution and iterator scan length distribution, they both follow the Generalized Pareto Distribution. The probability density function is `f(x) = (1/sigma)(1+k*(x-theta)/sigma))^{-1-1/k)`. The parameters are: value_k, value_theta, value_sigma and iter_k, iter_theta, iter_sigma. For more information about the Generalized Pareto Distribution, users can find the [wiki](https://en.wikipedia.org/wiki/Generalized_Pareto_distribution) and [Matalb page](https://www.mathworks.com/help/stats/generalized-pareto-distribution.html)
As for the QPS, it follows the diurnal pattern. So Sine is a good model to fit it. `F(x) = sine_a*sin(sine_b*x + sine_c) + sine_d`. The trace_will tell you the average QPS in the print out resutls, which is sine_d. After user fit the "*-qps_stats.txt" to the Matlab model, user can get the sine_a, sine_b, and sine_c. By using the 4 parameters, user can control the QPS variation including the period, average, changes.
To use the bench mark, user can indicate the following parameters as examples:
```
-benchmarks="mixgraph" -key_dist_a=0.002312 -key_dist_b=0.3467 -value_k=0.9233 -value_sigma=226.4092 -iter_k=2.517 -iter_sigma=14.236 -mix_get_ratio=0.7 -mix_put_ratio=0.25 -mix_seek_ratio=0.05 -sine_mix_rate_interval_milliseconds=500 -sine_a=15000 -sine_b=1 -sine_d=20000
```
Pull Request resolved: https://github.com/facebook/rocksdb/pull/4788
Differential Revision: D13573940
Pulled By: sagar0
fbshipit-source-id: e184c27e07b4f1bc0b436c2be36c5090c1fb0222
6 years ago
|
|
|
"The parameter 'k' of Generized Pareto Distribution "
|
|
|
|
|
"f(x)=(1/sigma)*(1+k*(x-theta)/sigma)^-(1/k+1)");
|
|
|
|
|
// Use reasonable defaults based on the mixgraph paper
|
|
|
|
|
DEFINE_double(value_sigma, 25.45,
|
Generate mixed workload with Get, Put, Seek in db_bench (#4788)
Summary:
Based on the specific workload models (key access distribution, value size distribution, and iterator scan length distribution, the QPS variation), the MixGraph benchmark generate the synthetic workload according to these distributions which can reflect the real-world workload characteristics.
After user enable the tracing function, they will get the trace file. By analyzing the trace file with the trace_analyzer tool, user can generate a set of statistic data files including. The *_accessed_key_stats.txt, *-accessed_value_size_distribution.txt, *-iterator_length_distribution.txt, and *-qps_stats.txt are mainly used to fit the Matlab model fitting. After that, user can get the parameters of the workload distributions (the modeling details are described: [here](https://github.com/facebook/rocksdb/wiki/RocksDB-Trace%2C-Replay%2C-and-Analyzer))
The key access distribution follows the The two-term power model. The probability density function is: `f(x) = ax^{b}+c`. The corresponding parameters are key_dist_a, key_dist_b, and key_dist_c in db_bench
For the value size distribution and iterator scan length distribution, they both follow the Generalized Pareto Distribution. The probability density function is `f(x) = (1/sigma)(1+k*(x-theta)/sigma))^{-1-1/k)`. The parameters are: value_k, value_theta, value_sigma and iter_k, iter_theta, iter_sigma. For more information about the Generalized Pareto Distribution, users can find the [wiki](https://en.wikipedia.org/wiki/Generalized_Pareto_distribution) and [Matalb page](https://www.mathworks.com/help/stats/generalized-pareto-distribution.html)
As for the QPS, it follows the diurnal pattern. So Sine is a good model to fit it. `F(x) = sine_a*sin(sine_b*x + sine_c) + sine_d`. The trace_will tell you the average QPS in the print out resutls, which is sine_d. After user fit the "*-qps_stats.txt" to the Matlab model, user can get the sine_a, sine_b, and sine_c. By using the 4 parameters, user can control the QPS variation including the period, average, changes.
To use the bench mark, user can indicate the following parameters as examples:
```
-benchmarks="mixgraph" -key_dist_a=0.002312 -key_dist_b=0.3467 -value_k=0.9233 -value_sigma=226.4092 -iter_k=2.517 -iter_sigma=14.236 -mix_get_ratio=0.7 -mix_put_ratio=0.25 -mix_seek_ratio=0.05 -sine_mix_rate_interval_milliseconds=500 -sine_a=15000 -sine_b=1 -sine_d=20000
```
Pull Request resolved: https://github.com/facebook/rocksdb/pull/4788
Differential Revision: D13573940
Pulled By: sagar0
fbshipit-source-id: e184c27e07b4f1bc0b436c2be36c5090c1fb0222
6 years ago
|
|
|
"The parameter 'theta' of Generized Pareto Distribution "
|
|
|
|
|
"f(x)=(1/sigma)*(1+k*(x-theta)/sigma)^-(1/k+1)");
|
|
|
|
|
DEFINE_double(iter_theta, 0.0,
|
|
|
|
|
"The parameter 'theta' of Generized Pareto Distribution "
|
|
|
|
|
"f(x)=(1/sigma)*(1+k*(x-theta)/sigma)^-(1/k+1)");
|
|
|
|
|
// Use reasonable defaults based on the mixgraph paper
|
|
|
|
|
DEFINE_double(iter_k, 2.517,
|
Generate mixed workload with Get, Put, Seek in db_bench (#4788)
Summary:
Based on the specific workload models (key access distribution, value size distribution, and iterator scan length distribution, the QPS variation), the MixGraph benchmark generate the synthetic workload according to these distributions which can reflect the real-world workload characteristics.
After user enable the tracing function, they will get the trace file. By analyzing the trace file with the trace_analyzer tool, user can generate a set of statistic data files including. The *_accessed_key_stats.txt, *-accessed_value_size_distribution.txt, *-iterator_length_distribution.txt, and *-qps_stats.txt are mainly used to fit the Matlab model fitting. After that, user can get the parameters of the workload distributions (the modeling details are described: [here](https://github.com/facebook/rocksdb/wiki/RocksDB-Trace%2C-Replay%2C-and-Analyzer))
The key access distribution follows the The two-term power model. The probability density function is: `f(x) = ax^{b}+c`. The corresponding parameters are key_dist_a, key_dist_b, and key_dist_c in db_bench
For the value size distribution and iterator scan length distribution, they both follow the Generalized Pareto Distribution. The probability density function is `f(x) = (1/sigma)(1+k*(x-theta)/sigma))^{-1-1/k)`. The parameters are: value_k, value_theta, value_sigma and iter_k, iter_theta, iter_sigma. For more information about the Generalized Pareto Distribution, users can find the [wiki](https://en.wikipedia.org/wiki/Generalized_Pareto_distribution) and [Matalb page](https://www.mathworks.com/help/stats/generalized-pareto-distribution.html)
As for the QPS, it follows the diurnal pattern. So Sine is a good model to fit it. `F(x) = sine_a*sin(sine_b*x + sine_c) + sine_d`. The trace_will tell you the average QPS in the print out resutls, which is sine_d. After user fit the "*-qps_stats.txt" to the Matlab model, user can get the sine_a, sine_b, and sine_c. By using the 4 parameters, user can control the QPS variation including the period, average, changes.
To use the bench mark, user can indicate the following parameters as examples:
```
-benchmarks="mixgraph" -key_dist_a=0.002312 -key_dist_b=0.3467 -value_k=0.9233 -value_sigma=226.4092 -iter_k=2.517 -iter_sigma=14.236 -mix_get_ratio=0.7 -mix_put_ratio=0.25 -mix_seek_ratio=0.05 -sine_mix_rate_interval_milliseconds=500 -sine_a=15000 -sine_b=1 -sine_d=20000
```
Pull Request resolved: https://github.com/facebook/rocksdb/pull/4788
Differential Revision: D13573940
Pulled By: sagar0
fbshipit-source-id: e184c27e07b4f1bc0b436c2be36c5090c1fb0222
6 years ago
|
|
|
"The parameter 'k' of Generized Pareto Distribution "
|
|
|
|
|
"f(x)=(1/sigma)*(1+k*(x-theta)/sigma)^-(1/k+1)");
|
|
|
|
|
// Use reasonable defaults based on the mixgraph paper
|
|
|
|
|
DEFINE_double(iter_sigma, 14.236,
|
Generate mixed workload with Get, Put, Seek in db_bench (#4788)
Summary:
Based on the specific workload models (key access distribution, value size distribution, and iterator scan length distribution, the QPS variation), the MixGraph benchmark generate the synthetic workload according to these distributions which can reflect the real-world workload characteristics.
After user enable the tracing function, they will get the trace file. By analyzing the trace file with the trace_analyzer tool, user can generate a set of statistic data files including. The *_accessed_key_stats.txt, *-accessed_value_size_distribution.txt, *-iterator_length_distribution.txt, and *-qps_stats.txt are mainly used to fit the Matlab model fitting. After that, user can get the parameters of the workload distributions (the modeling details are described: [here](https://github.com/facebook/rocksdb/wiki/RocksDB-Trace%2C-Replay%2C-and-Analyzer))
The key access distribution follows the The two-term power model. The probability density function is: `f(x) = ax^{b}+c`. The corresponding parameters are key_dist_a, key_dist_b, and key_dist_c in db_bench
For the value size distribution and iterator scan length distribution, they both follow the Generalized Pareto Distribution. The probability density function is `f(x) = (1/sigma)(1+k*(x-theta)/sigma))^{-1-1/k)`. The parameters are: value_k, value_theta, value_sigma and iter_k, iter_theta, iter_sigma. For more information about the Generalized Pareto Distribution, users can find the [wiki](https://en.wikipedia.org/wiki/Generalized_Pareto_distribution) and [Matalb page](https://www.mathworks.com/help/stats/generalized-pareto-distribution.html)
As for the QPS, it follows the diurnal pattern. So Sine is a good model to fit it. `F(x) = sine_a*sin(sine_b*x + sine_c) + sine_d`. The trace_will tell you the average QPS in the print out resutls, which is sine_d. After user fit the "*-qps_stats.txt" to the Matlab model, user can get the sine_a, sine_b, and sine_c. By using the 4 parameters, user can control the QPS variation including the period, average, changes.
To use the bench mark, user can indicate the following parameters as examples:
```
-benchmarks="mixgraph" -key_dist_a=0.002312 -key_dist_b=0.3467 -value_k=0.9233 -value_sigma=226.4092 -iter_k=2.517 -iter_sigma=14.236 -mix_get_ratio=0.7 -mix_put_ratio=0.25 -mix_seek_ratio=0.05 -sine_mix_rate_interval_milliseconds=500 -sine_a=15000 -sine_b=1 -sine_d=20000
```
Pull Request resolved: https://github.com/facebook/rocksdb/pull/4788
Differential Revision: D13573940
Pulled By: sagar0
fbshipit-source-id: e184c27e07b4f1bc0b436c2be36c5090c1fb0222
6 years ago
|
|
|
"The parameter 'sigma' of Generized Pareto Distribution "
|
|
|
|
|
"f(x)=(1/sigma)*(1+k*(x-theta)/sigma)^-(1/k+1)");
|
|
|
|
|
DEFINE_double(mix_get_ratio, 1.0,
|
|
|
|
|
"The ratio of Get queries of mix_graph workload");
|
|
|
|
|
DEFINE_double(mix_put_ratio, 0.0,
|
|
|
|
|
"The ratio of Put queries of mix_graph workload");
|
|
|
|
|
DEFINE_double(mix_seek_ratio, 0.0,
|
|
|
|
|
"The ratio of Seek queries of mix_graph workload");
|
|
|
|
|
DEFINE_int64(mix_max_scan_len, 10000, "The max scan length of Iterator");
|
|
|
|
|
DEFINE_int64(mix_max_value_size, 1024, "The max value size of this workload");
|
|
|
|
|
DEFINE_double(
|
|
|
|
|
sine_mix_rate_noise, 0.0,
|
|
|
|
|
"Add the noise ratio to the sine rate, it is between 0.0 and 1.0");
|
|
|
|
|
DEFINE_bool(sine_mix_rate, false,
|
|
|
|
|
"Enable the sine QPS control on the mix workload");
|
|
|
|
|
DEFINE_uint64(
|
|
|
|
|
sine_mix_rate_interval_milliseconds, 10000,
|
|
|
|
|
"Interval of which the sine wave read_rate_limit is recalculated");
|
|
|
|
|
DEFINE_int64(mix_accesses, -1,
|
|
|
|
|
"The total query accesses of mix_graph workload");
|
|
|
|
|
|
|
|
|
|
DEFINE_uint64(
|
|
|
|
|
benchmark_read_rate_limit, 0,
|
|
|
|
|
"If non-zero, db_bench will rate-limit the reads from RocksDB. This "
|
|
|
|
|
"is the global rate in ops/second.");
|
|
|
|
|
|
|
|
|
|
DEFINE_uint64(max_compaction_bytes,
|
|
|
|
|
ROCKSDB_NAMESPACE::Options().max_compaction_bytes,
|
|
|
|
|
"Max bytes allowed in one compaction");
|
|
|
|
|
|
|
|
|
|
#ifndef ROCKSDB_LITE
|
|
|
|
|
DEFINE_bool(readonly, false, "Run read only benchmarks.");
|
|
|
|
|
|
|
|
|
|
DEFINE_bool(print_malloc_stats, false,
|
|
|
|
|
"Print malloc stats to stdout after benchmarks finish.");
|
|
|
|
|
#endif // ROCKSDB_LITE
|
|
|
|
|
|
|
|
|
|
DEFINE_bool(disable_auto_compactions, false, "Do not auto trigger compactions");
|
|
|
|
|
|
|
|
|
|
DEFINE_uint64(wal_ttl_seconds, 0, "Set the TTL for the WAL Files in seconds.");
|
|
|
|
|
DEFINE_uint64(wal_size_limit_MB, 0, "Set the size limit for the WAL Files"
|
|
|
|
|
" in MB.");
|
|
|
|
|
DEFINE_uint64(max_total_wal_size, 0, "Set total max WAL size");
|
|
|
|
|
|
|
|
|
|
DEFINE_bool(mmap_read, ROCKSDB_NAMESPACE::Options().allow_mmap_reads,
|
|
|
|
|
"Allow reads to occur via mmap-ing files");
|
|
|
|
|
|
|
|
|
|
DEFINE_bool(mmap_write, ROCKSDB_NAMESPACE::Options().allow_mmap_writes,
|
|
|
|
|
"Allow writes to occur via mmap-ing files");
|
|
|
|
|
|
|
|
|
|
DEFINE_bool(use_direct_reads, ROCKSDB_NAMESPACE::Options().use_direct_reads,
|
|
|
|
|
"Use O_DIRECT for reading data");
|
|
|
|
|
|
|
|
|
|
DEFINE_bool(use_direct_io_for_flush_and_compaction,
|
|
|
|
|
ROCKSDB_NAMESPACE::Options().use_direct_io_for_flush_and_compaction,
|
|
|
|
|
"Use O_DIRECT for background flush and compaction writes");
|
|
|
|
|
|
|
|
|
|
DEFINE_bool(advise_random_on_open,
|
|
|
|
|
ROCKSDB_NAMESPACE::Options().advise_random_on_open,
|
|
|
|
|
"Advise random access on table file open");
|
|
|
|
|
|
|
|
|
|
DEFINE_string(compaction_fadvice, "NORMAL",
|
|
|
|
|
"Access pattern advice when a file is compacted");
|
|
|
|
|
static auto FLAGS_compaction_fadvice_e =
|
|
|
|
|
ROCKSDB_NAMESPACE::Options().access_hint_on_compaction_start;
|
|
|
|
|
|
|
|
|
|
DEFINE_bool(use_tailing_iterator, false,
|
|
|
|
|
"Use tailing iterator to access a series of keys instead of get");
|
|
|
|
|
|
|
|
|
|
DEFINE_bool(use_adaptive_mutex, ROCKSDB_NAMESPACE::Options().use_adaptive_mutex,
|
|
|
|
|
"Use adaptive mutex");
|
|
|
|
|
|
|
|
|
|
DEFINE_uint64(bytes_per_sync, ROCKSDB_NAMESPACE::Options().bytes_per_sync,
|
|
|
|
|
"Allows OS to incrementally sync SST files to disk while they are"
|
|
|
|
|
" being written, in the background. Issue one request for every"
|
|
|
|
|
" bytes_per_sync written. 0 turns it off.");
|
|
|
|
|
|
|
|
|
|
DEFINE_uint64(wal_bytes_per_sync,
|
|
|
|
|
ROCKSDB_NAMESPACE::Options().wal_bytes_per_sync,
|
|
|
|
|
"Allows OS to incrementally sync WAL files to disk while they are"
|
|
|
|
|
" being written, in the background. Issue one request for every"
|
|
|
|
|
" wal_bytes_per_sync written. 0 turns it off.");
|
|
|
|
|
|
Support for SingleDelete()
Summary:
This patch fixes #7460559. It introduces SingleDelete as a new database
operation. This operation can be used to delete keys that were never
overwritten (no put following another put of the same key). If an overwritten
key is single deleted the behavior is undefined. Single deletion of a
non-existent key has no effect but multiple consecutive single deletions are
not allowed (see limitations).
In contrast to the conventional Delete() operation, the deletion entry is
removed along with the value when the two are lined up in a compaction. Note:
The semantics are similar to @igor's prototype that allowed to have this
behavior on the granularity of a column family (
https://reviews.facebook.net/D42093 ). This new patch, however, is more
aggressive when it comes to removing tombstones: It removes the SingleDelete
together with the value whenever there is no snapshot between them while the
older patch only did this when the sequence number of the deletion was older
than the earliest snapshot.
Most of the complex additions are in the Compaction Iterator, all other changes
should be relatively straightforward. The patch also includes basic support for
single deletions in db_stress and db_bench.
Limitations:
- Not compatible with cuckoo hash tables
- Single deletions cannot be used in combination with merges and normal
deletions on the same key (other keys are not affected by this)
- Consecutive single deletions are currently not allowed (and older version of
this patch supported this so it could be resurrected if needed)
Test Plan: make all check
Reviewers: yhchiang, sdong, rven, anthony, yoshinorim, igor
Reviewed By: igor
Subscribers: maykov, dhruba, leveldb
Differential Revision: https://reviews.facebook.net/D43179
9 years ago
|
|
|
DEFINE_bool(use_single_deletes, true,
|
|
|
|
|
"Use single deletes (used in RandomReplaceKeys only).");
|
|
|
|
|
|
|
|
|
|
DEFINE_double(stddev, 2000.0,
|
|
|
|
|
"Standard deviation of normal distribution used for picking keys"
|
|
|
|
|
" (used in RandomReplaceKeys only).");
|
|
|
|
|
|
|
|
|
|
DEFINE_int32(key_id_range, 100000,
|
|
|
|
|
"Range of possible value of key id (used in TimeSeries only).");
|
|
|
|
|
|
|
|
|
|
DEFINE_string(expire_style, "none",
|
|
|
|
|
"Style to remove expired time entries. Can be one of the options "
|
|
|
|
|
"below: none (do not expired data), compaction_filter (use a "
|
|
|
|
|
"compaction filter to remove expired data), delete (seek IDs and "
|
|
|
|
|
"remove expired data) (used in TimeSeries only).");
|
|
|
|
|
|
|
|
|
|
DEFINE_uint64(
|
|
|
|
|
time_range, 100000,
|
|
|
|
|
"Range of timestamp that store in the database (used in TimeSeries"
|
|
|
|
|
" only).");
|
|
|
|
|
|
|
|
|
|
DEFINE_int32(num_deletion_threads, 1,
|
|
|
|
|
"Number of threads to do deletion (used in TimeSeries and delete "
|
|
|
|
|
"expire_style only).");
|
|
|
|
|
|
|
|
|
|
DEFINE_int32(max_successive_merges, 0, "Maximum number of successive merge"
|
|
|
|
|
" operations on a key in the memtable");
|
|
|
|
|
|
|
|
|
|
static bool ValidatePrefixSize(const char* flagname, int32_t value) {
|
|
|
|
|
if (value < 0 || value>=2000000000) {
|
|
|
|
|
fprintf(stderr, "Invalid value for --%s: %d. 0<= PrefixSize <=2000000000\n",
|
|
|
|
|
flagname, value);
|
|
|
|
|
return false;
|
|
|
|
|
}
|
|
|
|
|
return true;
|
|
|
|
|
}
|
|
|
|
|
|
|
|
|
|
DEFINE_int32(prefix_size, 0, "control the prefix size for HashSkipList and "
|
|
|
|
|
"plain table");
|
|
|
|
|
DEFINE_int64(keys_per_prefix, 0, "control average number of keys generated "
|
|
|
|
|
"per prefix, 0 means no special handling of the prefix, "
|
|
|
|
|
"i.e. use the prefix comes with the generated random number.");
|
|
|
|
|
DEFINE_bool(total_order_seek, false,
|
|
|
|
|
"Enable total order seek regardless of index format.");
|
|
|
|
|
DEFINE_bool(prefix_same_as_start, false,
|
|
|
|
|
"Enforce iterator to return keys with prefix same as seek key.");
|
|
|
|
|
DEFINE_bool(
|
|
|
|
|
seek_missing_prefix, false,
|
|
|
|
|
"Iterator seek to keys with non-exist prefixes. Require prefix_size > 8");
|
|
|
|
|
|
|
|
|
|
DEFINE_int32(memtable_insert_with_hint_prefix_size, 0,
|
|
|
|
|
"If non-zero, enable "
|
|
|
|
|
"memtable insert with hint with the given prefix size.");
|
|
|
|
|
DEFINE_bool(enable_io_prio, false, "Lower the background flush/compaction "
|
|
|
|
|
"threads' IO priority");
|
|
|
|
|
DEFINE_bool(enable_cpu_prio, false, "Lower the background flush/compaction "
|
|
|
|
|
"threads' CPU priority");
|
CuckooTable: add one option to allow identity function for the first hash function
Summary:
MurmurHash becomes expensive when we do millions Get() a second in one
thread. Add this option to allow the first hash function to use identity
function as hash function. It results in QPS increase from 3.7M/s to
~4.3M/s. I did not observe improvement for end to end RocksDB
performance. This may be caused by other bottlenecks that I will address
in a separate diff.
Test Plan:
```
[ljin@dev1964 rocksdb] ./cuckoo_table_reader_test --enable_perf --file_dir=/dev/shm --write --identity_as_first_hash=0
==== Test CuckooReaderTest.WhenKeyExists
==== Test CuckooReaderTest.WhenKeyExistsWithUint64Comparator
==== Test CuckooReaderTest.CheckIterator
==== Test CuckooReaderTest.CheckIteratorUint64
==== Test CuckooReaderTest.WhenKeyNotFound
==== Test CuckooReaderTest.TestReadPerformance
With 125829120 items, utilization is 93.75%, number of hash functions: 2.
Time taken per op is 0.272us (3.7 Mqps) with batch size of 0, # of found keys 125829120
With 125829120 items, utilization is 93.75%, number of hash functions: 2.
Time taken per op is 0.138us (7.2 Mqps) with batch size of 10, # of found keys 125829120
With 125829120 items, utilization is 93.75%, number of hash functions: 2.
Time taken per op is 0.142us (7.1 Mqps) with batch size of 25, # of found keys 125829120
With 125829120 items, utilization is 93.75%, number of hash functions: 2.
Time taken per op is 0.142us (7.0 Mqps) with batch size of 50, # of found keys 125829120
With 125829120 items, utilization is 93.75%, number of hash functions: 2.
Time taken per op is 0.144us (6.9 Mqps) with batch size of 100, # of found keys 125829120
With 104857600 items, utilization is 78.12%, number of hash functions: 2.
Time taken per op is 0.201us (5.0 Mqps) with batch size of 0, # of found keys 104857600
With 104857600 items, utilization is 78.12%, number of hash functions: 2.
Time taken per op is 0.121us (8.3 Mqps) with batch size of 10, # of found keys 104857600
With 104857600 items, utilization is 78.12%, number of hash functions: 2.
Time taken per op is 0.123us (8.1 Mqps) with batch size of 25, # of found keys 104857600
With 104857600 items, utilization is 78.12%, number of hash functions: 2.
Time taken per op is 0.121us (8.3 Mqps) with batch size of 50, # of found keys 104857600
With 104857600 items, utilization is 78.12%, number of hash functions: 2.
Time taken per op is 0.112us (8.9 Mqps) with batch size of 100, # of found keys 104857600
With 83886080 items, utilization is 62.50%, number of hash functions: 2.
Time taken per op is 0.251us (4.0 Mqps) with batch size of 0, # of found keys 83886080
With 83886080 items, utilization is 62.50%, number of hash functions: 2.
Time taken per op is 0.107us (9.4 Mqps) with batch size of 10, # of found keys 83886080
With 83886080 items, utilization is 62.50%, number of hash functions: 2.
Time taken per op is 0.099us (10.1 Mqps) with batch size of 25, # of found keys 83886080
With 83886080 items, utilization is 62.50%, number of hash functions: 2.
Time taken per op is 0.100us (10.0 Mqps) with batch size of 50, # of found keys 83886080
With 83886080 items, utilization is 62.50%, number of hash functions: 2.
Time taken per op is 0.116us (8.6 Mqps) with batch size of 100, # of found keys 83886080
With 73400320 items, utilization is 54.69%, number of hash functions: 2.
Time taken per op is 0.189us (5.3 Mqps) with batch size of 0, # of found keys 73400320
With 73400320 items, utilization is 54.69%, number of hash functions: 2.
Time taken per op is 0.095us (10.5 Mqps) with batch size of 10, # of found keys 73400320
With 73400320 items, utilization is 54.69%, number of hash functions: 2.
Time taken per op is 0.096us (10.4 Mqps) with batch size of 25, # of found keys 73400320
With 73400320 items, utilization is 54.69%, number of hash functions: 2.
Time taken per op is 0.098us (10.2 Mqps) with batch size of 50, # of found keys 73400320
With 73400320 items, utilization is 54.69%, number of hash functions: 2.
Time taken per op is 0.105us (9.5 Mqps) with batch size of 100, # of found keys 73400320
[ljin@dev1964 rocksdb] ./cuckoo_table_reader_test --enable_perf --file_dir=/dev/shm --write --identity_as_first_hash=1
==== Test CuckooReaderTest.WhenKeyExists
==== Test CuckooReaderTest.WhenKeyExistsWithUint64Comparator
==== Test CuckooReaderTest.CheckIterator
==== Test CuckooReaderTest.CheckIteratorUint64
==== Test CuckooReaderTest.WhenKeyNotFound
==== Test CuckooReaderTest.TestReadPerformance
With 125829120 items, utilization is 93.75%, number of hash functions: 2.
Time taken per op is 0.230us (4.3 Mqps) with batch size of 0, # of found keys 125829120
With 125829120 items, utilization is 93.75%, number of hash functions: 2.
Time taken per op is 0.086us (11.7 Mqps) with batch size of 10, # of found keys 125829120
With 125829120 items, utilization is 93.75%, number of hash functions: 2.
Time taken per op is 0.088us (11.3 Mqps) with batch size of 25, # of found keys 125829120
With 125829120 items, utilization is 93.75%, number of hash functions: 2.
Time taken per op is 0.083us (12.1 Mqps) with batch size of 50, # of found keys 125829120
With 125829120 items, utilization is 93.75%, number of hash functions: 2.
Time taken per op is 0.083us (12.1 Mqps) with batch size of 100, # of found keys 125829120
With 104857600 items, utilization is 78.12%, number of hash functions: 2.
Time taken per op is 0.159us (6.3 Mqps) with batch size of 0, # of found keys 104857600
With 104857600 items, utilization is 78.12%, number of hash functions: 2.
Time taken per op is 0.078us (12.8 Mqps) with batch size of 10, # of found keys 104857600
With 104857600 items, utilization is 78.12%, number of hash functions: 2.
Time taken per op is 0.080us (12.6 Mqps) with batch size of 25, # of found keys 104857600
With 104857600 items, utilization is 78.12%, number of hash functions: 2.
Time taken per op is 0.080us (12.5 Mqps) with batch size of 50, # of found keys 104857600
With 104857600 items, utilization is 78.12%, number of hash functions: 2.
Time taken per op is 0.082us (12.2 Mqps) with batch size of 100, # of found keys 104857600
With 83886080 items, utilization is 62.50%, number of hash functions: 2.
Time taken per op is 0.154us (6.5 Mqps) with batch size of 0, # of found keys 83886080
With 83886080 items, utilization is 62.50%, number of hash functions: 2.
Time taken per op is 0.077us (13.0 Mqps) with batch size of 10, # of found keys 83886080
With 83886080 items, utilization is 62.50%, number of hash functions: 2.
Time taken per op is 0.077us (12.9 Mqps) with batch size of 25, # of found keys 83886080
With 83886080 items, utilization is 62.50%, number of hash functions: 2.
Time taken per op is 0.078us (12.8 Mqps) with batch size of 50, # of found keys 83886080
With 83886080 items, utilization is 62.50%, number of hash functions: 2.
Time taken per op is 0.079us (12.6 Mqps) with batch size of 100, # of found keys 83886080
With 73400320 items, utilization is 54.69%, number of hash functions: 2.
Time taken per op is 0.218us (4.6 Mqps) with batch size of 0, # of found keys 73400320
With 73400320 items, utilization is 54.69%, number of hash functions: 2.
Time taken per op is 0.083us (12.0 Mqps) with batch size of 10, # of found keys 73400320
With 73400320 items, utilization is 54.69%, number of hash functions: 2.
Time taken per op is 0.085us (11.7 Mqps) with batch size of 25, # of found keys 73400320
With 73400320 items, utilization is 54.69%, number of hash functions: 2.
Time taken per op is 0.086us (11.6 Mqps) with batch size of 50, # of found keys 73400320
With 73400320 items, utilization is 54.69%, number of hash functions: 2.
Time taken per op is 0.078us (12.8 Mqps) with batch size of 100, # of found keys 73400320
```
Reviewers: sdong, igor, yhchiang
Reviewed By: igor
Subscribers: leveldb
Differential Revision: https://reviews.facebook.net/D23451
10 years ago
|
|
|
DEFINE_bool(identity_as_first_hash, false, "the first hash function of cuckoo "
|
|
|
|
|
"table becomes an identity function. This is only valid when key "
|
|
|
|
|
"is 8 bytes");
|
|
|
|
|
DEFINE_bool(dump_malloc_stats, true, "Dump malloc stats in LOG ");
|
|
|
|
|
DEFINE_uint64(stats_dump_period_sec,
|
|
|
|
|
ROCKSDB_NAMESPACE::Options().stats_dump_period_sec,
|
|
|
|
|
"Gap between printing stats to log in seconds");
|
|
|
|
|
DEFINE_uint64(stats_persist_period_sec,
|
|
|
|
|
ROCKSDB_NAMESPACE::Options().stats_persist_period_sec,
|
|
|
|
|
"Gap between persisting stats in seconds");
|
|
|
|
|
DEFINE_bool(persist_stats_to_disk,
|
|
|
|
|
ROCKSDB_NAMESPACE::Options().persist_stats_to_disk,
|
|
|
|
|
"whether to persist stats to disk");
|
|
|
|
|
DEFINE_uint64(stats_history_buffer_size,
|
|
|
|
|
ROCKSDB_NAMESPACE::Options().stats_history_buffer_size,
|
|
|
|
|
"Max number of stats snapshots to keep in memory");
|
|
|
|
|
DEFINE_bool(avoid_flush_during_recovery,
|
|
|
|
|
ROCKSDB_NAMESPACE::Options().avoid_flush_during_recovery,
|
|
|
|
|
"If true, avoids flushing the recovered WAL data where possible.");
|
Introduce a new MultiGet batching implementation (#5011)
Summary:
This PR introduces a new MultiGet() API, with the underlying implementation grouping keys based on SST file and batching lookups in a file. The reason for the new API is twofold - the definition allows callers to allocate storage for status and values on stack instead of std::vector, as well as return values as PinnableSlices in order to avoid copying, and it keeps the original MultiGet() implementation intact while we experiment with batching.
Batching is useful when there is some spatial locality to the keys being queries, as well as larger batch sizes. The main benefits are due to -
1. Fewer function calls, especially to BlockBasedTableReader::MultiGet() and FullFilterBlockReader::KeysMayMatch()
2. Bloom filter cachelines can be prefetched, hiding the cache miss latency
The next step is to optimize the binary searches in the level_storage_info, index blocks and data blocks, since we could reduce the number of key comparisons if the keys are relatively close to each other. The batching optimizations also need to be extended to other formats, such as PlainTable and filter formats. This also needs to be added to db_stress.
Benchmark results from db_bench for various batch size/locality of reference combinations are given below. Locality was simulated by offsetting the keys in a batch by a stride length. Each SST file is about 8.6MB uncompressed and key/value size is 16/100 uncompressed. To focus on the cpu benefit of batching, the runs were single threaded and bound to the same cpu to eliminate interference from other system events. The results show a 10-25% improvement in micros/op from smaller to larger batch sizes (4 - 32).
Batch Sizes
1 | 2 | 4 | 8 | 16 | 32
Random pattern (Stride length 0)
4.158 | 4.109 | 4.026 | 4.05 | 4.1 | 4.074 - Get
4.438 | 4.302 | 4.165 | 4.122 | 4.096 | 4.075 - MultiGet (no batching)
4.461 | 4.256 | 4.277 | 4.11 | 4.182 | 4.14 - MultiGet (w/ batching)
Good locality (Stride length 16)
4.048 | 3.659 | 3.248 | 2.99 | 2.84 | 2.753
4.429 | 3.728 | 3.406 | 3.053 | 2.911 | 2.781
4.452 | 3.45 | 2.833 | 2.451 | 2.233 | 2.135
Good locality (Stride length 256)
4.066 | 3.786 | 3.581 | 3.447 | 3.415 | 3.232
4.406 | 4.005 | 3.644 | 3.49 | 3.381 | 3.268
4.393 | 3.649 | 3.186 | 2.882 | 2.676 | 2.62
Medium locality (Stride length 4096)
4.012 | 3.922 | 3.768 | 3.61 | 3.582 | 3.555
4.364 | 4.057 | 3.791 | 3.65 | 3.57 | 3.465
4.479 | 3.758 | 3.316 | 3.077 | 2.959 | 2.891
dbbench command used (on a DB with 4 levels, 12 million keys)-
TEST_TMPDIR=/dev/shm numactl -C 10 ./db_bench.tmp -use_existing_db=true -benchmarks="readseq,multireadrandom" -write_buffer_size=4194304 -target_file_size_base=4194304 -max_bytes_for_level_base=16777216 -num=12000000 -reads=12000000 -duration=90 -threads=1 -compression_type=none -cache_size=4194304000 -batch_size=32 -disable_auto_compactions=true -bloom_bits=10 -cache_index_and_filter_blocks=true -pin_l0_filter_and_index_blocks_in_cache=true -multiread_batched=true -multiread_stride=4
Pull Request resolved: https://github.com/facebook/rocksdb/pull/5011
Differential Revision: D14348703
Pulled By: anand1976
fbshipit-source-id: 774406dab3776d979c809522a67bedac6c17f84b
5 years ago
|
|
|
DEFINE_int64(multiread_stride, 0,
|
|
|
|
|
"Stride length for the keys in a MultiGet batch");
|
|
|
|
|
DEFINE_bool(multiread_batched, false, "Use the new MultiGet API");
|
|
|
|
|
|
|
|
|
|
DEFINE_string(memtablerep, "skip_list", "");
|
|
|
|
|
DEFINE_int64(hash_bucket_count, 1024 * 1024, "hash bucket count");
|
|
|
|
|
DEFINE_bool(use_plain_table, false, "if use plain table "
|
|
|
|
|
"instead of block-based table format");
|
|
|
|
|
DEFINE_bool(use_cuckoo_table, false, "if use cuckoo table format");
|
|
|
|
|
DEFINE_double(cuckoo_hash_ratio, 0.9, "Hash ratio for Cuckoo SST table.");
|
|
|
|
|
DEFINE_bool(use_hash_search, false, "if use kHashSearch "
|
|
|
|
|
"instead of kBinarySearch. "
|
|
|
|
|
"This is valid if only we use BlockTable");
|
|
|
|
|
DEFINE_bool(use_block_based_filter, false, "if use kBlockBasedFilter "
|
|
|
|
|
"instead of kFullFilter for filter block. "
|
|
|
|
|
"This is valid if only we use BlockTable");
|
|
|
|
|
DEFINE_string(merge_operator, "", "The merge operator to use with the database."
|
|
|
|
|
"If a new merge operator is specified, be sure to use fresh"
|
|
|
|
|
" database The possible merge operators are defined in"
|
|
|
|
|
" utilities/merge_operators.h");
|
SkipListRep::LookaheadIterator
Summary:
This diff introduces the `lookahead` argument to `SkipListFactory()`. This is an
optimization for the tailing use case which includes many seeks. E.g. consider
the following operations on a skip list iterator:
Seek(x), Next(), Next(), Seek(x+2), Next(), Seek(x+3), Next(), Next(), ...
If `lookahead` is positive, `SkipListRep` will return an iterator which also
keeps track of the previously visited node. Seek() then first does a linear
search starting from that node (up to `lookahead` steps). As in the tailing
example above, this may require fewer than ~log(n) comparisons as with regular
skip list search.
Test Plan:
Added a new benchmark (`fillseekseq`) which simulates the usage pattern. It
first writes N records (with consecutive keys), then measures how much time it
takes to read them by calling `Seek()` and `Next()`.
$ time ./db_bench -num 10000000 -benchmarks fillseekseq -prefix_size 1 \
-key_size 8 -write_buffer_size $[1024*1024*1024] -value_size 50 \
-seekseq_next 2 -skip_list_lookahead=0
[...]
DB path: [/dev/shm/rocksdbtest/dbbench]
fillseekseq : 0.389 micros/op 2569047 ops/sec;
real 0m21.806s
user 0m12.106s
sys 0m9.672s
$ time ./db_bench [...] -skip_list_lookahead=2
[...]
DB path: [/dev/shm/rocksdbtest/dbbench]
fillseekseq : 0.153 micros/op 6540684 ops/sec;
real 0m19.469s
user 0m10.192s
sys 0m9.252s
Reviewers: ljin, sdong, igor
Reviewed By: igor
Subscribers: dhruba, leveldb, march, lovro
Differential Revision: https://reviews.facebook.net/D23997
10 years ago
|
|
|
DEFINE_int32(skip_list_lookahead, 0, "Used with skip_list memtablerep; try "
|
|
|
|
|
"linear search first for this many steps from the previous "
|
|
|
|
|
"position");
|
|
|
|
|
DEFINE_bool(report_file_operations, false, "if report number of file "
|
|
|
|
|
"operations");
|
|
|
|
|
DEFINE_bool(report_open_timing, false, "if report open timing");
|
|
|
|
|
DEFINE_int32(readahead_size, 0, "Iterator readahead size");
|
Benchmarking for Merge Operator
Summary:
Updated db_bench and utilities/merge_operators.h to allow for dynamic benchmarking
of merge operators in db_bench. Added a new test (--benchmarks=mergerandom), which performs
a bunch of random Merge() operations over random keys. Also added a "--merge_operator=" flag
so that the tester can easily benchmark different merge operators. Currently supports
the PutOperator and UInt64Add operator. Support for stringappend or list append may come later.
Test Plan:
1. make db_bench
2. Test the PutOperator (simulating Put) as follows:
./db_bench --benchmarks=fillrandom,readrandom,updaterandom,readrandom,mergerandom,readrandom --merge_operator=put
--threads=2
3. Test the UInt64AddOperator (simulating numeric addition) similarly:
./db_bench --value_size=8 --benchmarks=fillrandom,readrandom,updaterandom,readrandom,mergerandom,readrandom
--merge_operator=uint64add --threads=2
Reviewers: haobo, dhruba, zshao, MarkCallaghan
Reviewed By: haobo
CC: leveldb
Differential Revision: https://reviews.facebook.net/D11535
11 years ago
|
|
|
|
|
|
|
|
DEFINE_bool(read_with_latest_user_timestamp, true,
|
|
|
|
|
"If true, always use the current latest timestamp for read. If "
|
|
|
|
|
"false, choose a random timestamp from the past.");
|
|
|
|
|
|
|
|
|
|
#ifndef ROCKSDB_LITE
|
|
|
|
|
DEFINE_string(secondary_cache_uri, "",
|
|
|
|
|
"Full URI for creating a custom secondary cache object");
|
|
|
|
|
static class std::shared_ptr<ROCKSDB_NAMESPACE::SecondaryCache> secondary_cache;
|
|
|
|
|
#endif // ROCKSDB_LITE
|
|
|
|
|
|
|
|
|
|
static const bool FLAGS_prefix_size_dummy __attribute__((__unused__)) =
|
|
|
|
|
RegisterFlagValidator(&FLAGS_prefix_size, &ValidatePrefixSize);
|
|
|
|
|
|
|
|
|
|
static const bool FLAGS_key_size_dummy __attribute__((__unused__)) =
|
|
|
|
|
RegisterFlagValidator(&FLAGS_key_size, &ValidateKeySize);
|
|
|
|
|
|
|
|
|
|
static const bool FLAGS_cache_numshardbits_dummy __attribute__((__unused__)) =
|
|
|
|
|
RegisterFlagValidator(&FLAGS_cache_numshardbits,
|
|
|
|
|
&ValidateCacheNumshardbits);
|
|
|
|
|
|
|
|
|
|
static const bool FLAGS_readwritepercent_dummy __attribute__((__unused__)) =
|
|
|
|
|
RegisterFlagValidator(&FLAGS_readwritepercent, &ValidateInt32Percent);
|
|
|
|
|
|
|
|
|
|
DEFINE_int32(disable_seek_compaction, false,
|
|
|
|
|
"Not used, left here for backwards compatibility");
|
|
|
|
|
|
|
|
|
|
static const bool FLAGS_deletepercent_dummy __attribute__((__unused__)) =
|
|
|
|
|
RegisterFlagValidator(&FLAGS_deletepercent, &ValidateInt32Percent);
|
|
|
|
|
static const bool FLAGS_table_cache_numshardbits_dummy __attribute__((__unused__)) =
|
|
|
|
|
RegisterFlagValidator(&FLAGS_table_cache_numshardbits,
|
|
|
|
|
&ValidateTableCacheNumshardbits);
|
|
|
|
|
|
|
|
|
|
namespace ROCKSDB_NAMESPACE {
|
|
|
|
|
namespace {
|
|
|
|
|
static Status CreateMemTableRepFactory(
|
|
|
|
|
const ConfigOptions& config_options,
|
|
|
|
|
std::shared_ptr<MemTableRepFactory>* factory) {
|
|
|
|
|
Status s;
|
|
|
|
|
if (!strcasecmp(FLAGS_memtablerep.c_str(), SkipListFactory::kNickName())) {
|
|
|
|
|
factory->reset(new SkipListFactory(FLAGS_skip_list_lookahead));
|
|
|
|
|
#ifndef ROCKSDB_LITE
|
|
|
|
|
} else if (!strcasecmp(FLAGS_memtablerep.c_str(), "prefix_hash")) {
|
|
|
|
|
factory->reset(NewHashSkipListRepFactory(FLAGS_hash_bucket_count));
|
|
|
|
|
} else if (!strcasecmp(FLAGS_memtablerep.c_str(),
|
|
|
|
|
VectorRepFactory::kNickName())) {
|
|
|
|
|
factory->reset(new VectorRepFactory());
|
|
|
|
|
} else if (!strcasecmp(FLAGS_memtablerep.c_str(), "hash_linkedlist")) {
|
|
|
|
|
factory->reset(NewHashLinkListRepFactory(FLAGS_hash_bucket_count));
|
|
|
|
|
#endif // ROCKSDB_LITE
|
|
|
|
|
} else {
|
|
|
|
|
std::unique_ptr<MemTableRepFactory> unique;
|
|
|
|
|
s = MemTableRepFactory::CreateFromString(config_options, FLAGS_memtablerep,
|
|
|
|
|
&unique);
|
|
|
|
|
if (s.ok()) {
|
|
|
|
|
factory->reset(unique.release());
|
|
|
|
|
}
|
|
|
|
|
}
|
|
|
|
|
return s;
|
|
|
|
|
}
|
|
|
|
|
|
|
|
|
|
} // namespace
|
|
|
|
|
|
|
|
|
|
enum DistributionType : unsigned char {
|
|
|
|
|
kFixed = 0,
|
|
|
|
|
kUniform,
|
|
|
|
|
kNormal
|
|
|
|
|
};
|
|
|
|
|
|
|
|
|
|
static enum DistributionType FLAGS_value_size_distribution_type_e = kFixed;
|
|
|
|
|
|
|
|
|
|
static enum DistributionType StringToDistributionType(const char* ctype) {
|
|
|
|
|
assert(ctype);
|
|
|
|
|
|
|
|
|
|
if (!strcasecmp(ctype, "fixed"))
|
|
|
|
|
return kFixed;
|
|
|
|
|
else if (!strcasecmp(ctype, "uniform"))
|
|
|
|
|
return kUniform;
|
|
|
|
|
else if (!strcasecmp(ctype, "normal"))
|
|
|
|
|
return kNormal;
|
|
|
|
|
|
|
|
|
|
fprintf(stdout, "Cannot parse distribution type '%s'\n", ctype);
|
|
|
|
|
exit(1);
|
|
|
|
|
}
|
|
|
|
|
|
|
|
|
|
class BaseDistribution {
|
|
|
|
|
public:
|
|
|
|
|
BaseDistribution(unsigned int _min, unsigned int _max)
|
|
|
|
|
: min_value_size_(_min), max_value_size_(_max) {}
|
|
|
|
|
virtual ~BaseDistribution() {}
|
|
|
|
|
|
|
|
|
|
unsigned int Generate() {
|
|
|
|
|
auto val = Get();
|
|
|
|
|
if (NeedTruncate()) {
|
|
|
|
|
val = std::max(min_value_size_, val);
|
|
|
|
|
val = std::min(max_value_size_, val);
|
|
|
|
|
}
|
|
|
|
|
return val;
|
|
|
|
|
}
|
|
|
|
|
private:
|
|
|
|
|
virtual unsigned int Get() = 0;
|
|
|
|
|
virtual bool NeedTruncate() {
|
|
|
|
|
return true;
|
|
|
|
|
}
|
|
|
|
|
unsigned int min_value_size_;
|
|
|
|
|
unsigned int max_value_size_;
|
|
|
|
|
};
|
|
|
|
|
|
|
|
|
|
class FixedDistribution : public BaseDistribution
|
|
|
|
|
{
|
|
|
|
|
public:
|
|
|
|
|
FixedDistribution(unsigned int size) :
|
|
|
|
|
BaseDistribution(size, size),
|
|
|
|
|
size_(size) {}
|
|
|
|
|
private:
|
|
|
|
|
virtual unsigned int Get() override {
|
|
|
|
|
return size_;
|
|
|
|
|
}
|
|
|
|
|
virtual bool NeedTruncate() override {
|
|
|
|
|
return false;
|
|
|
|
|
}
|
|
|
|
|
unsigned int size_;
|
|
|
|
|
};
|
|
|
|
|
|
|
|
|
|
class NormalDistribution
|
|
|
|
|
: public BaseDistribution, public std::normal_distribution<double> {
|
|
|
|
|
public:
|
|
|
|
|
NormalDistribution(unsigned int _min, unsigned int _max)
|
|
|
|
|
: BaseDistribution(_min, _max),
|
|
|
|
|
// 99.7% values within the range [min, max].
|
|
|
|
|
std::normal_distribution<double>(
|
|
|
|
|
(double)(_min + _max) / 2.0 /*mean*/,
|
|
|
|
|
(double)(_max - _min) / 6.0 /*stddev*/),
|
|
|
|
|
gen_(rd_()) {}
|
|
|
|
|
|
|
|
|
|
private:
|
|
|
|
|
virtual unsigned int Get() override {
|
|
|
|
|
return static_cast<unsigned int>((*this)(gen_));
|
|
|
|
|
}
|
|
|
|
|
std::random_device rd_;
|
|
|
|
|
std::mt19937 gen_;
|
|
|
|
|
};
|
|
|
|
|
|
|
|
|
|
class UniformDistribution
|
|
|
|
|
: public BaseDistribution,
|
|
|
|
|
public std::uniform_int_distribution<unsigned int> {
|
|
|
|
|
public:
|
|
|
|
|
UniformDistribution(unsigned int _min, unsigned int _max)
|
|
|
|
|
: BaseDistribution(_min, _max),
|
|
|
|
|
std::uniform_int_distribution<unsigned int>(_min, _max),
|
|
|
|
|
gen_(rd_()) {}
|
|
|
|
|
|
|
|
|
|
private:
|
|
|
|
|
virtual unsigned int Get() override {
|
|
|
|
|
return (*this)(gen_);
|
|
|
|
|
}
|
|
|
|
|
virtual bool NeedTruncate() override {
|
|
|
|
|
return false;
|
|
|
|
|
}
|
|
|
|
|
std::random_device rd_;
|
|
|
|
|
std::mt19937 gen_;
|
|
|
|
|
};
|
|
|
|
|
|
|
|
|
|
// Helper for quickly generating random data.
|
|
|
|
|
class RandomGenerator {
|
|
|
|
|
private:
|
|
|
|
|
std::string data_;
|
|
|
|
|
unsigned int pos_;
|
|
|
|
|
std::unique_ptr<BaseDistribution> dist_;
|
|
|
|
|
|
|
|
|
|
public:
|
|
|
|
|
|
|
|
|
|
RandomGenerator() {
|
|
|
|
|
auto max_value_size = FLAGS_value_size_max;
|
|
|
|
|
switch (FLAGS_value_size_distribution_type_e) {
|
|
|
|
|
case kUniform:
|
|
|
|
|
dist_.reset(new UniformDistribution(FLAGS_value_size_min,
|
|
|
|
|
FLAGS_value_size_max));
|
|
|
|
|
break;
|
|
|
|
|
case kNormal:
|
|
|
|
|
dist_.reset(new NormalDistribution(FLAGS_value_size_min,
|
|
|
|
|
FLAGS_value_size_max));
|
|
|
|
|
break;
|
|
|
|
|
case kFixed:
|
|
|
|
|
default:
|
|
|
|
|
dist_.reset(new FixedDistribution(value_size));
|
|
|
|
|
max_value_size = value_size;
|
|
|
|
|
}
|
|
|
|
|
// We use a limited amount of data over and over again and ensure
|
|
|
|
|
// that it is larger than the compression window (32KB), and also
|
|
|
|
|
// large enough to serve all typical value sizes we want to write.
|
|
|
|
|
Random rnd(301);
|
|
|
|
|
std::string piece;
|
|
|
|
|
while (data_.size() < (unsigned)std::max(1048576, max_value_size)) {
|
|
|
|
|
// Add a short fragment that is as compressible as specified
|
|
|
|
|
// by FLAGS_compression_ratio.
|
|
|
|
|
test::CompressibleString(&rnd, FLAGS_compression_ratio, 100, &piece);
|
|
|
|
|
data_.append(piece);
|
|
|
|
|
}
|
|
|
|
|
pos_ = 0;
|
|
|
|
|
}
|
|
|
|
|
|
|
|
|
|
Slice Generate(unsigned int len) {
|
|
|
|
|
assert(len <= data_.size());
|
|
|
|
|
if (pos_ + len > data_.size()) {
|
|
|
|
|
pos_ = 0;
|
|
|
|
|
}
|
|
|
|
|
pos_ += len;
|
|
|
|
|
return Slice(data_.data() + pos_ - len, len);
|
|
|
|
|
}
|
|
|
|
|
|
|
|
|
|
Slice Generate() {
|
|
|
|
|
auto len = dist_->Generate();
|
|
|
|
|
return Generate(len);
|
|
|
|
|
}
|
|
|
|
|
};
|
|
|
|
|
|
|
|
|
|
static void AppendWithSpace(std::string* str, Slice msg) {
|
|
|
|
|
if (msg.empty()) return;
|
|
|
|
|
if (!str->empty()) {
|
|
|
|
|
str->push_back(' ');
|
|
|
|
|
}
|
|
|
|
|
str->append(msg.data(), msg.size());
|
|
|
|
|
}
|
|
|
|
|
|
|
|
|
|
struct DBWithColumnFamilies {
|
|
|
|
|
std::vector<ColumnFamilyHandle*> cfh;
|
|
|
|
|
DB* db;
|
|
|
|
|
#ifndef ROCKSDB_LITE
|
Pessimistic Transactions
Summary:
Initial implementation of Pessimistic Transactions. This diff contains the api changes discussed in D38913. This diff is pretty large, so let me know if people would prefer to meet up to discuss it.
MyRocks folks: please take a look at the API in include/rocksdb/utilities/transaction[_db].h and let me know if you have any issues.
Also, you'll notice a couple of TODOs in the implementation of RollbackToSavePoint(). After chatting with Siying, I'm going to send out a separate diff for an alternate implementation of this feature that implements the rollback inside of WriteBatch/WriteBatchWithIndex. We can then decide which route is preferable.
Next, I'm planning on doing some perf testing and then integrating this diff into MongoRocks for further testing.
Test Plan: Unit tests, db_bench parallel testing.
Reviewers: igor, rven, sdong, yhchiang, yoshinorim
Reviewed By: sdong
Subscribers: hermanlee4, maykov, spetrunia, leveldb, dhruba
Differential Revision: https://reviews.facebook.net/D40869
9 years ago
|
|
|
OptimisticTransactionDB* opt_txn_db;
|
|
|
|
|
#endif // ROCKSDB_LITE
|
|
|
|
|
std::atomic<size_t> num_created; // Need to be updated after all the
|
|
|
|
|
// new entries in cfh are set.
|
|
|
|
|
size_t num_hot; // Number of column families to be queried at each moment.
|
|
|
|
|
// After each CreateNewCf(), another num_hot number of new
|
|
|
|
|
// Column families will be created and used to be queried.
|
|
|
|
|
port::Mutex create_cf_mutex; // Only one thread can execute CreateNewCf()
|
|
|
|
|
std::vector<int> cfh_idx_to_prob; // ith index holds probability of operating
|
|
|
|
|
// on cfh[i].
|
|
|
|
|
|
|
|
|
|
DBWithColumnFamilies()
|
|
|
|
|
: db(nullptr)
|
|
|
|
|
#ifndef ROCKSDB_LITE
|
|
|
|
|
, opt_txn_db(nullptr)
|
|
|
|
|
#endif // ROCKSDB_LITE
|
|
|
|
|
{
|
|
|
|
|
cfh.clear();
|
|
|
|
|
num_created = 0;
|
|
|
|
|
num_hot = 0;
|
|
|
|
|
}
|
|
|
|
|
|
|
|
|
|
DBWithColumnFamilies(const DBWithColumnFamilies& other)
|
|
|
|
|
: cfh(other.cfh),
|
|
|
|
|
db(other.db),
|
|
|
|
|
#ifndef ROCKSDB_LITE
|
Pessimistic Transactions
Summary:
Initial implementation of Pessimistic Transactions. This diff contains the api changes discussed in D38913. This diff is pretty large, so let me know if people would prefer to meet up to discuss it.
MyRocks folks: please take a look at the API in include/rocksdb/utilities/transaction[_db].h and let me know if you have any issues.
Also, you'll notice a couple of TODOs in the implementation of RollbackToSavePoint(). After chatting with Siying, I'm going to send out a separate diff for an alternate implementation of this feature that implements the rollback inside of WriteBatch/WriteBatchWithIndex. We can then decide which route is preferable.
Next, I'm planning on doing some perf testing and then integrating this diff into MongoRocks for further testing.
Test Plan: Unit tests, db_bench parallel testing.
Reviewers: igor, rven, sdong, yhchiang, yoshinorim
Reviewed By: sdong
Subscribers: hermanlee4, maykov, spetrunia, leveldb, dhruba
Differential Revision: https://reviews.facebook.net/D40869
9 years ago
|
|
|
opt_txn_db(other.opt_txn_db),
|
|
|
|
|
#endif // ROCKSDB_LITE
|
|
|
|
|
num_created(other.num_created.load()),
|
|
|
|
|
num_hot(other.num_hot),
|
|
|
|
|
cfh_idx_to_prob(other.cfh_idx_to_prob) {
|
|
|
|
|
}
|
|
|
|
|
|
|
|
|
|
void DeleteDBs() {
|
|
|
|
|
std::for_each(cfh.begin(), cfh.end(),
|
|
|
|
|
[](ColumnFamilyHandle* cfhi) { delete cfhi; });
|
|
|
|
|
cfh.clear();
|
|
|
|
|
#ifndef ROCKSDB_LITE
|
Pessimistic Transactions
Summary:
Initial implementation of Pessimistic Transactions. This diff contains the api changes discussed in D38913. This diff is pretty large, so let me know if people would prefer to meet up to discuss it.
MyRocks folks: please take a look at the API in include/rocksdb/utilities/transaction[_db].h and let me know if you have any issues.
Also, you'll notice a couple of TODOs in the implementation of RollbackToSavePoint(). After chatting with Siying, I'm going to send out a separate diff for an alternate implementation of this feature that implements the rollback inside of WriteBatch/WriteBatchWithIndex. We can then decide which route is preferable.
Next, I'm planning on doing some perf testing and then integrating this diff into MongoRocks for further testing.
Test Plan: Unit tests, db_bench parallel testing.
Reviewers: igor, rven, sdong, yhchiang, yoshinorim
Reviewed By: sdong
Subscribers: hermanlee4, maykov, spetrunia, leveldb, dhruba
Differential Revision: https://reviews.facebook.net/D40869
9 years ago
|
|
|
if (opt_txn_db) {
|
|
|
|
|
delete opt_txn_db;
|
|
|
|
|
opt_txn_db = nullptr;
|
|
|
|
|
} else {
|
|
|
|
|
delete db;
|
|
|
|
|
db = nullptr;
|
|
|
|
|
}
|
|
|
|
|
#else
|
|
|
|
|
delete db;
|
|
|
|
|
db = nullptr;
|
|
|
|
|
#endif // ROCKSDB_LITE
|
|
|
|
|
}
|
|
|
|
|
|
|
|
|
|
ColumnFamilyHandle* GetCfh(int64_t rand_num) {
|
|
|
|
|
assert(num_hot > 0);
|
|
|
|
|
size_t rand_offset = 0;
|
|
|
|
|
if (!cfh_idx_to_prob.empty()) {
|
|
|
|
|
assert(cfh_idx_to_prob.size() == num_hot);
|
|
|
|
|
int sum = 0;
|
|
|
|
|
while (sum + cfh_idx_to_prob[rand_offset] < rand_num % 100) {
|
|
|
|
|
sum += cfh_idx_to_prob[rand_offset];
|
|
|
|
|
++rand_offset;
|
|
|
|
|
}
|
|
|
|
|
assert(rand_offset < cfh_idx_to_prob.size());
|
|
|
|
|
} else {
|
|
|
|
|
rand_offset = rand_num % num_hot;
|
|
|
|
|
}
|
|
|
|
|
return cfh[num_created.load(std::memory_order_acquire) - num_hot +
|
|
|
|
|
rand_offset];
|
|
|
|
|
}
|
|
|
|
|
|
|
|
|
|
// stage: assume CF from 0 to stage * num_hot has be created. Need to create
|
|
|
|
|
// stage * num_hot + 1 to stage * (num_hot + 1).
|
|
|
|
|
void CreateNewCf(ColumnFamilyOptions options, int64_t stage) {
|
|
|
|
|
MutexLock l(&create_cf_mutex);
|
|
|
|
|
if ((stage + 1) * num_hot <= num_created) {
|
|
|
|
|
// Already created.
|
|
|
|
|
return;
|
|
|
|
|
}
|
|
|
|
|
auto new_num_created = num_created + num_hot;
|
|
|
|
|
assert(new_num_created <= cfh.size());
|
|
|
|
|
for (size_t i = num_created; i < new_num_created; i++) {
|
|
|
|
|
Status s =
|
|
|
|
|
db->CreateColumnFamily(options, ColumnFamilyName(i), &(cfh[i]));
|
|
|
|
|
if (!s.ok()) {
|
|
|
|
|
fprintf(stderr, "create column family error: %s\n",
|
|
|
|
|
s.ToString().c_str());
|
|
|
|
|
abort();
|
|
|
|
|
}
|
|
|
|
|
}
|
|
|
|
|
num_created.store(new_num_created, std::memory_order_release);
|
|
|
|
|
}
|
|
|
|
|
};
|
|
|
|
|
|
|
|
|
|
// A class that reports stats to CSV file.
|
db_bench periodically writes QPS to CSV file
Summary:
This is part of an effort to better understand and optimize RocksDB stalls under high load. I added a feature to db_bench to periodically write QPS to CSV files. That way we can nicely see how our QPS changes in time (especially when DB is stalled) and can do a better job of evaluating our stall system (i.e. we want the QPS to be as constant as possible, as opposed to having bunch of stalls)
Cool part of CSV files is that we can easily graph them -- there are a bunch of tools available.
Test Plan:
Ran ./db_bench --report_interval_seconds=10 --benchmarks=fillrandom --num=10000000
and observed this in report.csv:
secs_elapsed,interval_qps
10,2725860
20,1980480
30,1863456
40,1454359
50,1460389
Reviewers: sdong, MarkCallaghan, rven, yhchiang
Reviewed By: yhchiang
Subscribers: dhruba, leveldb
Differential Revision: https://reviews.facebook.net/D40047
9 years ago
|
|
|
class ReporterAgent {
|
|
|
|
|
public:
|
|
|
|
|
ReporterAgent(Env* env, const std::string& fname,
|
|
|
|
|
uint64_t report_interval_secs)
|
|
|
|
|
: env_(env),
|
|
|
|
|
total_ops_done_(0),
|
|
|
|
|
last_report_(0),
|
|
|
|
|
report_interval_secs_(report_interval_secs),
|
|
|
|
|
stop_(false) {
|
|
|
|
|
auto s = env_->NewWritableFile(fname, &report_file_, EnvOptions());
|
|
|
|
|
if (s.ok()) {
|
|
|
|
|
s = report_file_->Append(Header() + "\n");
|
|
|
|
|
}
|
|
|
|
|
if (s.ok()) {
|
|
|
|
|
s = report_file_->Flush();
|
|
|
|
|
}
|
|
|
|
|
if (!s.ok()) {
|
|
|
|
|
fprintf(stderr, "Can't open %s: %s\n", fname.c_str(),
|
|
|
|
|
s.ToString().c_str());
|
|
|
|
|
abort();
|
|
|
|
|
}
|
|
|
|
|
|
|
|
|
|
reporting_thread_ = port::Thread([&]() { SleepAndReport(); });
|
db_bench periodically writes QPS to CSV file
Summary:
This is part of an effort to better understand and optimize RocksDB stalls under high load. I added a feature to db_bench to periodically write QPS to CSV files. That way we can nicely see how our QPS changes in time (especially when DB is stalled) and can do a better job of evaluating our stall system (i.e. we want the QPS to be as constant as possible, as opposed to having bunch of stalls)
Cool part of CSV files is that we can easily graph them -- there are a bunch of tools available.
Test Plan:
Ran ./db_bench --report_interval_seconds=10 --benchmarks=fillrandom --num=10000000
and observed this in report.csv:
secs_elapsed,interval_qps
10,2725860
20,1980480
30,1863456
40,1454359
50,1460389
Reviewers: sdong, MarkCallaghan, rven, yhchiang
Reviewed By: yhchiang
Subscribers: dhruba, leveldb
Differential Revision: https://reviews.facebook.net/D40047
9 years ago
|
|
|
}
|
|
|
|
|
|
|
|
|
|
~ReporterAgent() {
|
|
|
|
|
{
|
|
|
|
|
std::unique_lock<std::mutex> lk(mutex_);
|
|
|
|
|
stop_ = true;
|
|
|
|
|
stop_cv_.notify_all();
|
|
|
|
|
}
|
|
|
|
|
reporting_thread_.join();
|
|
|
|
|
}
|
|
|
|
|
|
|
|
|
|
// thread safe
|
|
|
|
|
void ReportFinishedOps(int64_t num_ops) {
|
|
|
|
|
total_ops_done_.fetch_add(num_ops);
|
|
|
|
|
}
|
|
|
|
|
|
|
|
|
|
private:
|
|
|
|
|
std::string Header() const { return "secs_elapsed,interval_qps"; }
|
|
|
|
|
void SleepAndReport() {
|
|
|
|
|
auto* clock = env_->GetSystemClock().get();
|
|
|
|
|
auto time_started = clock->NowMicros();
|
db_bench periodically writes QPS to CSV file
Summary:
This is part of an effort to better understand and optimize RocksDB stalls under high load. I added a feature to db_bench to periodically write QPS to CSV files. That way we can nicely see how our QPS changes in time (especially when DB is stalled) and can do a better job of evaluating our stall system (i.e. we want the QPS to be as constant as possible, as opposed to having bunch of stalls)
Cool part of CSV files is that we can easily graph them -- there are a bunch of tools available.
Test Plan:
Ran ./db_bench --report_interval_seconds=10 --benchmarks=fillrandom --num=10000000
and observed this in report.csv:
secs_elapsed,interval_qps
10,2725860
20,1980480
30,1863456
40,1454359
50,1460389
Reviewers: sdong, MarkCallaghan, rven, yhchiang
Reviewed By: yhchiang
Subscribers: dhruba, leveldb
Differential Revision: https://reviews.facebook.net/D40047
9 years ago
|
|
|
while (true) {
|
|
|
|
|
{
|
|
|
|
|
std::unique_lock<std::mutex> lk(mutex_);
|
|
|
|
|
if (stop_ ||
|
|
|
|
|
stop_cv_.wait_for(lk, std::chrono::seconds(report_interval_secs_),
|
|
|
|
|
[&]() { return stop_; })) {
|
|
|
|
|
// stopping
|
|
|
|
|
break;
|
|
|
|
|
}
|
|
|
|
|
// else -> timeout, which means time for a report!
|
|
|
|
|
}
|
|
|
|
|
auto total_ops_done_snapshot = total_ops_done_.load();
|
|
|
|
|
// round the seconds elapsed
|
|
|
|
|
auto secs_elapsed =
|
|
|
|
|
(clock->NowMicros() - time_started + kMicrosInSecond / 2) /
|
db_bench periodically writes QPS to CSV file
Summary:
This is part of an effort to better understand and optimize RocksDB stalls under high load. I added a feature to db_bench to periodically write QPS to CSV files. That way we can nicely see how our QPS changes in time (especially when DB is stalled) and can do a better job of evaluating our stall system (i.e. we want the QPS to be as constant as possible, as opposed to having bunch of stalls)
Cool part of CSV files is that we can easily graph them -- there are a bunch of tools available.
Test Plan:
Ran ./db_bench --report_interval_seconds=10 --benchmarks=fillrandom --num=10000000
and observed this in report.csv:
secs_elapsed,interval_qps
10,2725860
20,1980480
30,1863456
40,1454359
50,1460389
Reviewers: sdong, MarkCallaghan, rven, yhchiang
Reviewed By: yhchiang
Subscribers: dhruba, leveldb
Differential Revision: https://reviews.facebook.net/D40047
9 years ago
|
|
|
kMicrosInSecond;
|
|
|
|
|
std::string report = ToString(secs_elapsed) + "," +
|
|
|
|
|
ToString(total_ops_done_snapshot - last_report_) +
|
|
|
|
|
"\n";
|
|
|
|
|
auto s = report_file_->Append(report);
|
|
|
|
|
if (s.ok()) {
|
|
|
|
|
s = report_file_->Flush();
|
|
|
|
|
}
|
|
|
|
|
if (!s.ok()) {
|
|
|
|
|
fprintf(stderr,
|
|
|
|
|
"Can't write to report file (%s), stopping the reporting\n",
|
|
|
|
|
s.ToString().c_str());
|
|
|
|
|
break;
|
|
|
|
|
}
|
|
|
|
|
last_report_ = total_ops_done_snapshot;
|
|
|
|
|
}
|
|
|
|
|
}
|
|
|
|
|
|
|
|
|
|
Env* env_;
|
|
|
|
|
std::unique_ptr<WritableFile> report_file_;
|
|
|
|
|
std::atomic<int64_t> total_ops_done_;
|
|
|
|
|
int64_t last_report_;
|
|
|
|
|
const uint64_t report_interval_secs_;
|
|
|
|
|
ROCKSDB_NAMESPACE::port::Thread reporting_thread_;
|
db_bench periodically writes QPS to CSV file
Summary:
This is part of an effort to better understand and optimize RocksDB stalls under high load. I added a feature to db_bench to periodically write QPS to CSV files. That way we can nicely see how our QPS changes in time (especially when DB is stalled) and can do a better job of evaluating our stall system (i.e. we want the QPS to be as constant as possible, as opposed to having bunch of stalls)
Cool part of CSV files is that we can easily graph them -- there are a bunch of tools available.
Test Plan:
Ran ./db_bench --report_interval_seconds=10 --benchmarks=fillrandom --num=10000000
and observed this in report.csv:
secs_elapsed,interval_qps
10,2725860
20,1980480
30,1863456
40,1454359
50,1460389
Reviewers: sdong, MarkCallaghan, rven, yhchiang
Reviewed By: yhchiang
Subscribers: dhruba, leveldb
Differential Revision: https://reviews.facebook.net/D40047
9 years ago
|
|
|
std::mutex mutex_;
|
|
|
|
|
// will notify on stop
|
|
|
|
|
std::condition_variable stop_cv_;
|
|
|
|
|
bool stop_;
|
|
|
|
|
};
|
|
|
|
|
|
|
|
|
|
enum OperationType : unsigned char {
|
|
|
|
|
kRead = 0,
|
|
|
|
|
kWrite,
|
|
|
|
|
kDelete,
|
|
|
|
|
kSeek,
|
|
|
|
|
kMerge,
|
|
|
|
|
kUpdate,
|
|
|
|
|
kCompress,
|
|
|
|
|
kUncompress,
|
|
|
|
|
kCrc,
|
|
|
|
|
kHash,
|
|
|
|
|
kOthers
|
|
|
|
|
};
|
|
|
|
|
|
|
|
|
|
static std::unordered_map<OperationType, std::string, std::hash<unsigned char>>
|
|
|
|
|
OperationTypeString = {
|
|
|
|
|
{kRead, "read"},
|
|
|
|
|
{kWrite, "write"},
|
|
|
|
|
{kDelete, "delete"},
|
|
|
|
|
{kSeek, "seek"},
|
|
|
|
|
{kMerge, "merge"},
|
|
|
|
|
{kUpdate, "update"},
|
|
|
|
|
{kCompress, "compress"},
|
|
|
|
|
{kCompress, "uncompress"},
|
|
|
|
|
{kCrc, "crc"},
|
|
|
|
|
{kHash, "hash"},
|
|
|
|
|
{kOthers, "op"}
|
|
|
|
|
};
|
|
|
|
|
|
|
|
|
|
class CombinedStats;
|
|
|
|
|
class Stats {
|
|
|
|
|
private:
|
|
|
|
|
SystemClock* clock_;
|
|
|
|
|
int id_;
|
|
|
|
|
uint64_t start_ = 0;
|
|
|
|
|
uint64_t sine_interval_;
|
|
|
|
|
uint64_t finish_;
|
|
|
|
|
double seconds_;
|
|
|
|
|
uint64_t done_;
|
|
|
|
|
uint64_t last_report_done_;
|
|
|
|
|
uint64_t next_report_;
|
|
|
|
|
uint64_t bytes_;
|
|
|
|
|
uint64_t last_op_finish_;
|
|
|
|
|
uint64_t last_report_finish_;
|
|
|
|
|
std::unordered_map<OperationType, std::shared_ptr<HistogramImpl>,
|
|
|
|
|
std::hash<unsigned char>> hist_;
|
|
|
|
|
std::string message_;
|
|
|
|
|
bool exclude_from_merge_;
|
db_bench periodically writes QPS to CSV file
Summary:
This is part of an effort to better understand and optimize RocksDB stalls under high load. I added a feature to db_bench to periodically write QPS to CSV files. That way we can nicely see how our QPS changes in time (especially when DB is stalled) and can do a better job of evaluating our stall system (i.e. we want the QPS to be as constant as possible, as opposed to having bunch of stalls)
Cool part of CSV files is that we can easily graph them -- there are a bunch of tools available.
Test Plan:
Ran ./db_bench --report_interval_seconds=10 --benchmarks=fillrandom --num=10000000
and observed this in report.csv:
secs_elapsed,interval_qps
10,2725860
20,1980480
30,1863456
40,1454359
50,1460389
Reviewers: sdong, MarkCallaghan, rven, yhchiang
Reviewed By: yhchiang
Subscribers: dhruba, leveldb
Differential Revision: https://reviews.facebook.net/D40047
9 years ago
|
|
|
ReporterAgent* reporter_agent_; // does not own
|
|
|
|
|
friend class CombinedStats;
|
|
|
|
|
|
|
|
|
|
public:
|
|
|
|
|
Stats() : clock_(FLAGS_env->GetSystemClock().get()) { Start(-1); }
|
|
|
|
|
|
db_bench periodically writes QPS to CSV file
Summary:
This is part of an effort to better understand and optimize RocksDB stalls under high load. I added a feature to db_bench to periodically write QPS to CSV files. That way we can nicely see how our QPS changes in time (especially when DB is stalled) and can do a better job of evaluating our stall system (i.e. we want the QPS to be as constant as possible, as opposed to having bunch of stalls)
Cool part of CSV files is that we can easily graph them -- there are a bunch of tools available.
Test Plan:
Ran ./db_bench --report_interval_seconds=10 --benchmarks=fillrandom --num=10000000
and observed this in report.csv:
secs_elapsed,interval_qps
10,2725860
20,1980480
30,1863456
40,1454359
50,1460389
Reviewers: sdong, MarkCallaghan, rven, yhchiang
Reviewed By: yhchiang
Subscribers: dhruba, leveldb
Differential Revision: https://reviews.facebook.net/D40047
9 years ago
|
|
|
void SetReporterAgent(ReporterAgent* reporter_agent) {
|
|
|
|
|
reporter_agent_ = reporter_agent;
|
|
|
|
|
}
|
|
|
|
|
|
|
|
|
|
void Start(int id) {
|
|
|
|
|
id_ = id;
|
|
|
|
|
next_report_ = FLAGS_stats_interval ? FLAGS_stats_interval : 100;
|
|
|
|
|
last_op_finish_ = start_;
|
|
|
|
|
hist_.clear();
|
|
|
|
|
done_ = 0;
|
|
|
|
|
last_report_done_ = 0;
|
|
|
|
|
bytes_ = 0;
|
|
|
|
|
seconds_ = 0;
|
|
|
|
|
start_ = clock_->NowMicros();
|
|
|
|
|
sine_interval_ = clock_->NowMicros();
|
|
|
|
|
finish_ = start_;
|
|
|
|
|
last_report_finish_ = start_;
|
|
|
|
|
message_.clear();
|
|
|
|
|
// When set, stats from this thread won't be merged with others.
|
|
|
|
|
exclude_from_merge_ = false;
|
|
|
|
|
}
|
|
|
|
|
|
|
|
|
|
void Merge(const Stats& other) {
|
|
|
|
|
if (other.exclude_from_merge_)
|
|
|
|
|
return;
|
|
|
|
|
|
|
|
|
|
for (auto it = other.hist_.begin(); it != other.hist_.end(); ++it) {
|
|
|
|
|
auto this_it = hist_.find(it->first);
|
|
|
|
|
if (this_it != hist_.end()) {
|
|
|
|
|
this_it->second->Merge(*(other.hist_.at(it->first)));
|
|
|
|
|
} else {
|
|
|
|
|
hist_.insert({ it->first, it->second });
|
|
|
|
|
}
|
|
|
|
|
}
|
|
|
|
|
|
|
|
|
|
done_ += other.done_;
|
|
|
|
|
bytes_ += other.bytes_;
|
|
|
|
|
seconds_ += other.seconds_;
|
|
|
|
|
if (other.start_ < start_) start_ = other.start_;
|
|
|
|
|
if (other.finish_ > finish_) finish_ = other.finish_;
|
|
|
|
|
|
|
|
|
|
// Just keep the messages from one thread.
|
|
|
|
|
if (message_.empty()) message_ = other.message_;
|
|
|
|
|
}
|
|
|
|
|
|
|
|
|
|
void Stop() {
|
|
|
|
|
finish_ = clock_->NowMicros();
|
|
|
|
|
seconds_ = (finish_ - start_) * 1e-6;
|
|
|
|
|
}
|
|
|
|
|
|
|
|
|
|
void AddMessage(Slice msg) {
|
|
|
|
|
AppendWithSpace(&message_, msg);
|
|
|
|
|
}
|
|
|
|
|
|
|
|
|
|
void SetId(int id) { id_ = id; }
|
|
|
|
|
void SetExcludeFromMerge() { exclude_from_merge_ = true; }
|
|
|
|
|
|
|
|
|
|
void PrintThreadStatus() {
|
|
|
|
|
std::vector<ThreadStatus> thread_list;
|
|
|
|
|
FLAGS_env->GetThreadList(&thread_list);
|
|
|
|
|
|
|
|
|
|
fprintf(stderr, "\n%18s %10s %12s %20s %13s %45s %12s %s\n",
|
|
|
|
|
"ThreadID", "ThreadType", "cfName", "Operation",
|
|
|
|
|
"ElapsedTime", "Stage", "State", "OperationProperties");
|
|
|
|
|
|
|
|
|
|
int64_t current_time = 0;
|
|
|
|
|
clock_->GetCurrentTime(¤t_time).PermitUncheckedError();
|
|
|
|
|
for (auto ts : thread_list) {
|
|
|
|
|
fprintf(stderr, "%18" PRIu64 " %10s %12s %20s %13s %45s %12s",
|
|
|
|
|
ts.thread_id,
|
|
|
|
|
ThreadStatus::GetThreadTypeName(ts.thread_type).c_str(),
|
|
|
|
|
ts.cf_name.c_str(),
|
|
|
|
|
ThreadStatus::GetOperationName(ts.operation_type).c_str(),
|
|
|
|
|
ThreadStatus::MicrosToString(ts.op_elapsed_micros).c_str(),
|
|
|
|
|
ThreadStatus::GetOperationStageName(ts.operation_stage).c_str(),
|
|
|
|
|
ThreadStatus::GetStateName(ts.state_type).c_str());
|
|
|
|
|
|
|
|
|
|
auto op_properties = ThreadStatus::InterpretOperationProperties(
|
|
|
|
|
ts.operation_type, ts.op_properties);
|
|
|
|
|
for (const auto& op_prop : op_properties) {
|
|
|
|
|
fprintf(stderr, " %s %" PRIu64" |",
|
|
|
|
|
op_prop.first.c_str(), op_prop.second);
|
|
|
|
|
}
|
|
|
|
|
fprintf(stderr, "\n");
|
|
|
|
|
}
|
|
|
|
|
}
|
|
|
|
|
|
|
|
|
|
void ResetSineInterval() { sine_interval_ = clock_->NowMicros(); }
|
|
|
|
|
|
|
|
|
|
uint64_t GetSineInterval() {
|
|
|
|
|
return sine_interval_;
|
|
|
|
|
}
|
|
|
|
|
|
|
|
|
|
uint64_t GetStart() {
|
|
|
|
|
return start_;
|
|
|
|
|
}
|
|
|
|
|
|
|
|
|
|
void ResetLastOpTime() {
|
|
|
|
|
// Set to now to avoid latency from calls to SleepForMicroseconds.
|
|
|
|
|
last_op_finish_ = clock_->NowMicros();
|
|
|
|
|
}
|
|
|
|
|
|
|
|
|
|
void FinishedOps(DBWithColumnFamilies* db_with_cfh, DB* db, int64_t num_ops,
|
|
|
|
|
enum OperationType op_type = kOthers) {
|
db_bench periodically writes QPS to CSV file
Summary:
This is part of an effort to better understand and optimize RocksDB stalls under high load. I added a feature to db_bench to periodically write QPS to CSV files. That way we can nicely see how our QPS changes in time (especially when DB is stalled) and can do a better job of evaluating our stall system (i.e. we want the QPS to be as constant as possible, as opposed to having bunch of stalls)
Cool part of CSV files is that we can easily graph them -- there are a bunch of tools available.
Test Plan:
Ran ./db_bench --report_interval_seconds=10 --benchmarks=fillrandom --num=10000000
and observed this in report.csv:
secs_elapsed,interval_qps
10,2725860
20,1980480
30,1863456
40,1454359
50,1460389
Reviewers: sdong, MarkCallaghan, rven, yhchiang
Reviewed By: yhchiang
Subscribers: dhruba, leveldb
Differential Revision: https://reviews.facebook.net/D40047
9 years ago
|
|
|
if (reporter_agent_) {
|
|
|
|
|
reporter_agent_->ReportFinishedOps(num_ops);
|
|
|
|
|
}
|
|
|
|
|
if (FLAGS_histogram) {
|
|
|
|
|
uint64_t now = clock_->NowMicros();
|
|
|
|
|
uint64_t micros = now - last_op_finish_;
|
|
|
|
|
|
|
|
|
|
if (hist_.find(op_type) == hist_.end())
|
|
|
|
|
{
|
|
|
|
|
auto hist_temp = std::make_shared<HistogramImpl>();
|
|
|
|
|
hist_.insert({op_type, std::move(hist_temp)});
|
|
|
|
|
}
|
|
|
|
|
hist_[op_type]->Add(micros);
|
|
|
|
|
|
|
|
|
|
if (micros >= FLAGS_slow_usecs && !FLAGS_stats_interval) {
|
|
|
|
|
fprintf(stderr, "long op: %" PRIu64 " micros%30s\r", micros, "");
|
|
|
|
|
fflush(stderr);
|
|
|
|
|
}
|
|
|
|
|
last_op_finish_ = now;
|
|
|
|
|
}
|
|
|
|
|
|
|
|
|
|
done_ += num_ops;
|
|
|
|
|
if (done_ >= next_report_) {
|
|
|
|
|
if (!FLAGS_stats_interval) {
|
|
|
|
|
if (next_report_ < 1000) next_report_ += 100;
|
|
|
|
|
else if (next_report_ < 5000) next_report_ += 500;
|
|
|
|
|
else if (next_report_ < 10000) next_report_ += 1000;
|
|
|
|
|
else if (next_report_ < 50000) next_report_ += 5000;
|
|
|
|
|
else if (next_report_ < 100000) next_report_ += 10000;
|
|
|
|
|
else if (next_report_ < 500000) next_report_ += 50000;
|
|
|
|
|
else next_report_ += 100000;
|
|
|
|
|
fprintf(stderr, "... finished %" PRIu64 " ops%30s\r", done_, "");
|
|
|
|
|
} else {
|
|
|
|
|
uint64_t now = clock_->NowMicros();
|
|
|
|
|
int64_t usecs_since_last = now - last_report_finish_;
|
|
|
|
|
|
|
|
|
|
// Determine whether to print status where interval is either
|
|
|
|
|
// each N operations or each N seconds.
|
|
|
|
|
|
|
|
|
|
if (FLAGS_stats_interval_seconds &&
|
|
|
|
|
usecs_since_last < (FLAGS_stats_interval_seconds * 1000000)) {
|
|
|
|
|
// Don't check again for this many operations.
|
|
|
|
|
next_report_ += FLAGS_stats_interval;
|
|
|
|
|
|
|
|
|
|
} else {
|
|
|
|
|
fprintf(stderr,
|
|
|
|
|
"%s ... thread %d: (%" PRIu64 ",%" PRIu64
|
|
|
|
|
") ops and "
|
|
|
|
|
"(%.1f,%.1f) ops/second in (%.6f,%.6f) seconds\n",
|
|
|
|
|
clock_->TimeToString(now / 1000000).c_str(), id_,
|
|
|
|
|
done_ - last_report_done_, done_,
|
|
|
|
|
(done_ - last_report_done_) / (usecs_since_last / 1000000.0),
|
|
|
|
|
done_ / ((now - start_) / 1000000.0),
|
|
|
|
|
(now - last_report_finish_) / 1000000.0,
|
|
|
|
|
(now - start_) / 1000000.0);
|
|
|
|
|
|
|
|
|
|
if (id_ == 0 && FLAGS_stats_per_interval) {
|
|
|
|
|
std::string stats;
|
|
|
|
|
|
|
|
|
|
if (db_with_cfh && db_with_cfh->num_created.load()) {
|
|
|
|
|
for (size_t i = 0; i < db_with_cfh->num_created.load(); ++i) {
|
|
|
|
|
if (db->GetProperty(db_with_cfh->cfh[i], "rocksdb.cfstats",
|
|
|
|
|
&stats))
|
|
|
|
|
fprintf(stderr, "%s\n", stats.c_str());
|
Add argument --show_table_properties to db_bench
Summary:
Add argument --show_table_properties to db_bench
-show_table_properties (If true, then per-level table properties will be
printed on every stats-interval when stats_interval is set and
stats_per_interval is on.) type: bool default: false
Test Plan:
./db_bench --show_table_properties=1 --stats_interval=100000 --stats_per_interval=1
./db_bench --show_table_properties=1 --stats_interval=100000 --stats_per_interval=1 --num_column_families=2
Sample Output:
Compaction Stats [column_family_name_000001]
Level Files Size(MB) Score Read(GB) Rn(GB) Rnp1(GB) Write(GB) Wnew(GB) Moved(GB) W-Amp Rd(MB/s) Wr(MB/s) Comp(sec) Comp(cnt) Avg(sec) Stall(cnt) KeyIn KeyDrop
---------------------------------------------------------------------------------------------------------------------------------------------------------------------
L0 3/0 5 0.8 0.0 0.0 0.0 0.0 0.0 0.0 0.0 0.0 86.3 0 17 0.021 0 0 0
L1 5/0 9 0.9 0.0 0.0 0.0 0.0 0.0 0.0 0.0 0.0 0.0 0 0 0.000 0 0 0
L2 9/0 16 0.2 0.0 0.0 0.0 0.0 0.0 0.0 0.0 0.0 0.0 0 0 0.000 0 0 0
Sum 17/0 31 0.0 0.0 0.0 0.0 0.0 0.0 0.0 1.0 0.0 86.3 0 17 0.021 0 0 0
Int 0/0 0 0.0 0.0 0.0 0.0 0.0 0.0 0.0 1.0 0.0 83.9 0 2 0.022 0 0 0
Flush(GB): cumulative 0.030, interval 0.004
Stalls(count): 0 level0_slowdown, 0 level0_numfiles, 0 memtable_compaction, 0 leveln_slowdown_soft, 0 leveln_slowdown_hard
Level[0]: # data blocks=2571; # entries=84813; raw key size=2035512; raw average key size=24.000000; raw value size=8481300; raw average value size=100.000000; data block size=5690119; index block size=82415; filter block size=0; (estimated) table size=5772534; filter policy name=N/A;
Level[1]: # data blocks=4285; # entries=141355; raw key size=3392520; raw average key size=24.000000; raw value size=14135500; raw average value size=100.000000; data block size=9487353; index block size=137377; filter block size=0; (estimated) table size=9624730; filter policy name=N/A;
Level[2]: # data blocks=7713; # entries=254439; raw key size=6106536; raw average key size=24.000000; raw value size=25443900; raw average value size=100.000000; data block size=17077893; index block size=247269; filter block size=0; (estimated) table size=17325162; filter policy name=N/A;
Level[3]: # data blocks=0; # entries=0; raw key size=0; raw average key size=0.000000; raw value size=0; raw average value size=0.000000; data block size=0; index block size=0; filter block size=0; (estimated) table size=0; filter policy name=N/A;
Level[4]: # data blocks=0; # entries=0; raw key size=0; raw average key size=0.000000; raw value size=0; raw average value size=0.000000; data block size=0; index block size=0; filter block size=0; (estimated) table size=0; filter policy name=N/A;
Level[5]: # data blocks=0; # entries=0; raw key size=0; raw average key size=0.000000; raw value size=0; raw average value size=0.000000; data block size=0; index block size=0; filter block size=0; (estimated) table size=0; filter policy name=N/A;
Level[6]: # data blocks=0; # entries=0; raw key size=0; raw average key size=0.000000; raw value size=0; raw average value size=0.000000; data block size=0; index block size=0; filter block size=0; (estimated) table size=0; filter policy name=N/A;
Reviewers: anthony, IslamAbdelRahman, MarkCallaghan, sdong, igor
Reviewed By: igor
Subscribers: dhruba, leveldb
Differential Revision: https://reviews.facebook.net/D45651
9 years ago
|
|
|
if (FLAGS_show_table_properties) {
|
|
|
|
|
for (int level = 0; level < FLAGS_num_levels; ++level) {
|
|
|
|
|
if (db->GetProperty(
|
|
|
|
|
db_with_cfh->cfh[i],
|
|
|
|
|
"rocksdb.aggregated-table-properties-at-level" +
|
|
|
|
|
ToString(level),
|
|
|
|
|
&stats)) {
|
|
|
|
|
if (stats.find("# entries=0") == std::string::npos) {
|
|
|
|
|
fprintf(stderr, "Level[%d]: %s\n", level,
|
|
|
|
|
stats.c_str());
|
|
|
|
|
}
|
|
|
|
|
}
|
|
|
|
|
}
|
|
|
|
|
}
|
|
|
|
|
}
|
|
|
|
|
} else if (db) {
|
|
|
|
|
if (db->GetProperty("rocksdb.stats", &stats)) {
|
Add number of running flushes & compactions to --stats_per_interval output (#9726)
Summary:
This is for https://github.com/facebook/rocksdb/issues/9709 and add two lines to the end of DB Stats
for num-running-compactions and num-running-flushes.
For example ...
** DB Stats **
Uptime(secs): 6.0 total, 1.0 interval
Cumulative writes: 915K writes, 915K keys, 915K commit groups, 1.0 writes per commit group, ingest: 0.11 GB, 18.95 MB/s
Cumulative WAL: 915K writes, 0 syncs, 915000.00 writes per sync, written: 0.11 GB, 18.95 MB/s
Cumulative stall: 00:00:0.000 H:M:S, 0.0 percent
Interval writes: 133K writes, 133K keys, 133K commit groups, 1.0 writes per commit group, ingest: 16.62 MB, 16.53 MB/s
Interval WAL: 133K writes, 0 syncs, 133000.00 writes per sync, written: 0.02 GB, 16.53 MB/s
Interval stall: 00:00:0.000 H:M:S, 0.0 percent
num-running-compactions: 0
num-running-flushes: 0
Pull Request resolved: https://github.com/facebook/rocksdb/pull/9726
Reviewed By: jay-zhuang
Differential Revision: D35066759
Pulled By: mdcallag
fbshipit-source-id: c161fadd3c15c5aa715a820dab6bfedb46dc099b
2 years ago
|
|
|
fprintf(stderr, "%s", stats.c_str());
|
|
|
|
|
}
|
|
|
|
|
if (db->GetProperty("rocksdb.num-running-compactions", &stats)) {
|
|
|
|
|
fprintf(stderr, "num-running-compactions: %s\n", stats.c_str());
|
|
|
|
|
}
|
|
|
|
|
if (db->GetProperty("rocksdb.num-running-flushes", &stats)) {
|
|
|
|
|
fprintf(stderr, "num-running-flushes: %s\n\n", stats.c_str());
|
Add argument --show_table_properties to db_bench
Summary:
Add argument --show_table_properties to db_bench
-show_table_properties (If true, then per-level table properties will be
printed on every stats-interval when stats_interval is set and
stats_per_interval is on.) type: bool default: false
Test Plan:
./db_bench --show_table_properties=1 --stats_interval=100000 --stats_per_interval=1
./db_bench --show_table_properties=1 --stats_interval=100000 --stats_per_interval=1 --num_column_families=2
Sample Output:
Compaction Stats [column_family_name_000001]
Level Files Size(MB) Score Read(GB) Rn(GB) Rnp1(GB) Write(GB) Wnew(GB) Moved(GB) W-Amp Rd(MB/s) Wr(MB/s) Comp(sec) Comp(cnt) Avg(sec) Stall(cnt) KeyIn KeyDrop
---------------------------------------------------------------------------------------------------------------------------------------------------------------------
L0 3/0 5 0.8 0.0 0.0 0.0 0.0 0.0 0.0 0.0 0.0 86.3 0 17 0.021 0 0 0
L1 5/0 9 0.9 0.0 0.0 0.0 0.0 0.0 0.0 0.0 0.0 0.0 0 0 0.000 0 0 0
L2 9/0 16 0.2 0.0 0.0 0.0 0.0 0.0 0.0 0.0 0.0 0.0 0 0 0.000 0 0 0
Sum 17/0 31 0.0 0.0 0.0 0.0 0.0 0.0 0.0 1.0 0.0 86.3 0 17 0.021 0 0 0
Int 0/0 0 0.0 0.0 0.0 0.0 0.0 0.0 0.0 1.0 0.0 83.9 0 2 0.022 0 0 0
Flush(GB): cumulative 0.030, interval 0.004
Stalls(count): 0 level0_slowdown, 0 level0_numfiles, 0 memtable_compaction, 0 leveln_slowdown_soft, 0 leveln_slowdown_hard
Level[0]: # data blocks=2571; # entries=84813; raw key size=2035512; raw average key size=24.000000; raw value size=8481300; raw average value size=100.000000; data block size=5690119; index block size=82415; filter block size=0; (estimated) table size=5772534; filter policy name=N/A;
Level[1]: # data blocks=4285; # entries=141355; raw key size=3392520; raw average key size=24.000000; raw value size=14135500; raw average value size=100.000000; data block size=9487353; index block size=137377; filter block size=0; (estimated) table size=9624730; filter policy name=N/A;
Level[2]: # data blocks=7713; # entries=254439; raw key size=6106536; raw average key size=24.000000; raw value size=25443900; raw average value size=100.000000; data block size=17077893; index block size=247269; filter block size=0; (estimated) table size=17325162; filter policy name=N/A;
Level[3]: # data blocks=0; # entries=0; raw key size=0; raw average key size=0.000000; raw value size=0; raw average value size=0.000000; data block size=0; index block size=0; filter block size=0; (estimated) table size=0; filter policy name=N/A;
Level[4]: # data blocks=0; # entries=0; raw key size=0; raw average key size=0.000000; raw value size=0; raw average value size=0.000000; data block size=0; index block size=0; filter block size=0; (estimated) table size=0; filter policy name=N/A;
Level[5]: # data blocks=0; # entries=0; raw key size=0; raw average key size=0.000000; raw value size=0; raw average value size=0.000000; data block size=0; index block size=0; filter block size=0; (estimated) table size=0; filter policy name=N/A;
Level[6]: # data blocks=0; # entries=0; raw key size=0; raw average key size=0.000000; raw value size=0; raw average value size=0.000000; data block size=0; index block size=0; filter block size=0; (estimated) table size=0; filter policy name=N/A;
Reviewers: anthony, IslamAbdelRahman, MarkCallaghan, sdong, igor
Reviewed By: igor
Subscribers: dhruba, leveldb
Differential Revision: https://reviews.facebook.net/D45651
9 years ago
|
|
|
}
|
|
|
|
|
if (FLAGS_show_table_properties) {
|
|
|
|
|
for (int level = 0; level < FLAGS_num_levels; ++level) {
|
|
|
|
|
if (db->GetProperty(
|
|
|
|
|
"rocksdb.aggregated-table-properties-at-level" +
|
|
|
|
|
ToString(level),
|
|
|
|
|
&stats)) {
|
|
|
|
|
if (stats.find("# entries=0") == std::string::npos) {
|
|
|
|
|
fprintf(stderr, "Level[%d]: %s\n", level, stats.c_str());
|
|
|
|
|
}
|
|
|
|
|
}
|
|
|
|
|
}
|
|
|
|
|
}
|
|
|
|
|
}
|
|
|
|
|
}
|
|
|
|
|
|
|
|
|
|
next_report_ += FLAGS_stats_interval;
|
|
|
|
|
last_report_finish_ = now;
|
|
|
|
|
last_report_done_ = done_;
|
|
|
|
|
}
|
|
|
|
|
}
|
|
|
|
|
if (id_ == 0 && FLAGS_thread_status_per_interval) {
|
|
|
|
|
PrintThreadStatus();
|
|
|
|
|
}
|
|
|
|
|
fflush(stderr);
|
|
|
|
|
}
|
|
|
|
|
}
|
|
|
|
|
|
|
|
|
|
void AddBytes(int64_t n) {
|
|
|
|
|
bytes_ += n;
|
|
|
|
|
}
|
|
|
|
|
|
|
|
|
|
void Report(const Slice& name) {
|
|
|
|
|
// Pretend at least one op was done in case we are running a benchmark
|
|
|
|
|
// that does not call FinishedOps().
|
|
|
|
|
if (done_ < 1) done_ = 1;
|
|
|
|
|
|
|
|
|
|
std::string extra;
|
|
|
|
|
if (bytes_ > 0) {
|
|
|
|
|
// Rate is computed on actual elapsed time, not the sum of per-thread
|
|
|
|
|
// elapsed times.
|
|
|
|
|
double elapsed = (finish_ - start_) * 1e-6;
|
|
|
|
|
char rate[100];
|
|
|
|
|
snprintf(rate, sizeof(rate), "%6.1f MB/s",
|
|
|
|
|
(bytes_ / 1048576.0) / elapsed);
|
|
|
|
|
extra = rate;
|
|
|
|
|
}
|
|
|
|
|
AppendWithSpace(&extra, message_);
|
|
|
|
|
double elapsed = (finish_ - start_) * 1e-6;
|
|
|
|
|
double throughput = (double)done_/elapsed;
|
|
|
|
|
|
|
|
|
|
fprintf(stdout, "%-12s : %11.3f micros/op %ld ops/sec;%s%s\n",
|
|
|
|
|
name.ToString().c_str(),
|
|
|
|
|
seconds_ * 1e6 / done_,
|
|
|
|
|
(long)throughput,
|
|
|
|
|
(extra.empty() ? "" : " "),
|
|
|
|
|
extra.c_str());
|
|
|
|
|
if (FLAGS_histogram) {
|
|
|
|
|
for (auto it = hist_.begin(); it != hist_.end(); ++it) {
|
|
|
|
|
fprintf(stdout, "Microseconds per %s:\n%s\n",
|
|
|
|
|
OperationTypeString[it->first].c_str(),
|
|
|
|
|
it->second->ToString().c_str());
|
|
|
|
|
}
|
|
|
|
|
}
|
|
|
|
|
if (FLAGS_report_file_operations) {
|
|
|
|
|
auto* counted_fs =
|
|
|
|
|
FLAGS_env->GetFileSystem()->CheckedCast<CountedFileSystem>();
|
|
|
|
|
assert(counted_fs);
|
|
|
|
|
fprintf(stdout, "%s", counted_fs->PrintCounters().c_str());
|
|
|
|
|
counted_fs->ResetCounters();
|
|
|
|
|
}
|
|
|
|
|
fflush(stdout);
|
|
|
|
|
}
|
|
|
|
|
};
|
|
|
|
|
|
|
|
|
|
class CombinedStats {
|
|
|
|
|
public:
|
|
|
|
|
void AddStats(const Stats& stat) {
|
|
|
|
|
uint64_t total_ops = stat.done_;
|
|
|
|
|
uint64_t total_bytes_ = stat.bytes_;
|
|
|
|
|
double elapsed;
|
|
|
|
|
|
|
|
|
|
if (total_ops < 1) {
|
|
|
|
|
total_ops = 1;
|
|
|
|
|
}
|
|
|
|
|
|
|
|
|
|
elapsed = (stat.finish_ - stat.start_) * 1e-6;
|
|
|
|
|
throughput_ops_.emplace_back(total_ops / elapsed);
|
|
|
|
|
|
|
|
|
|
if (total_bytes_ > 0) {
|
|
|
|
|
double mbs = (total_bytes_ / 1048576.0);
|
|
|
|
|
throughput_mbs_.emplace_back(mbs / elapsed);
|
|
|
|
|
}
|
|
|
|
|
}
|
|
|
|
|
|
|
|
|
|
void Report(const std::string& bench_name) {
|
|
|
|
|
const char* name = bench_name.c_str();
|
|
|
|
|
int num_runs = static_cast<int>(throughput_ops_.size());
|
|
|
|
|
|
|
|
|
|
if (throughput_mbs_.size() == throughput_ops_.size()) {
|
|
|
|
|
fprintf(stdout,
|
|
|
|
|
"%s [AVG %d runs] : %d ops/sec; %6.1f MB/sec\n"
|
|
|
|
|
"%s [MEDIAN %d runs] : %d ops/sec; %6.1f MB/sec\n",
|
|
|
|
|
name, num_runs, static_cast<int>(CalcAvg(throughput_ops_)),
|
|
|
|
|
CalcAvg(throughput_mbs_), name, num_runs,
|
|
|
|
|
static_cast<int>(CalcMedian(throughput_ops_)),
|
|
|
|
|
CalcMedian(throughput_mbs_));
|
|
|
|
|
} else {
|
|
|
|
|
fprintf(stdout,
|
|
|
|
|
"%s [AVG %d runs] : %d ops/sec\n"
|
|
|
|
|
"%s [MEDIAN %d runs] : %d ops/sec\n",
|
|
|
|
|
name, num_runs, static_cast<int>(CalcAvg(throughput_ops_)), name,
|
|
|
|
|
num_runs, static_cast<int>(CalcMedian(throughput_ops_)));
|
|
|
|
|
}
|
|
|
|
|
}
|
|
|
|
|
|
|
|
|
|
private:
|
|
|
|
|
double CalcAvg(std::vector<double> data) {
|
|
|
|
|
double avg = 0;
|
|
|
|
|
for (double x : data) {
|
|
|
|
|
avg += x;
|
|
|
|
|
}
|
|
|
|
|
avg = avg / data.size();
|
|
|
|
|
return avg;
|
|
|
|
|
}
|
|
|
|
|
|
|
|
|
|
double CalcMedian(std::vector<double> data) {
|
|
|
|
|
assert(data.size() > 0);
|
|
|
|
|
std::sort(data.begin(), data.end());
|
|
|
|
|
|
|
|
|
|
size_t mid = data.size() / 2;
|
|
|
|
|
if (data.size() % 2 == 1) {
|
|
|
|
|
// Odd number of entries
|
|
|
|
|
return data[mid];
|
|
|
|
|
} else {
|
|
|
|
|
// Even number of entries
|
|
|
|
|
return (data[mid] + data[mid - 1]) / 2;
|
|
|
|
|
}
|
|
|
|
|
}
|
|
|
|
|
|
|
|
|
|
std::vector<double> throughput_ops_;
|
|
|
|
|
std::vector<double> throughput_mbs_;
|
|
|
|
|
};
|
|
|
|
|
|
|
|
|
|
class TimestampEmulator {
|
|
|
|
|
private:
|
|
|
|
|
std::atomic<uint64_t> timestamp_;
|
|
|
|
|
|
|
|
|
|
public:
|
|
|
|
|
TimestampEmulator() : timestamp_(0) {}
|
|
|
|
|
uint64_t Get() const { return timestamp_.load(); }
|
|
|
|
|
void Inc() { timestamp_++; }
|
|
|
|
|
Slice Allocate(char* scratch) {
|
|
|
|
|
// TODO: support larger timestamp sizes
|
|
|
|
|
assert(FLAGS_user_timestamp_size == 8);
|
|
|
|
|
assert(scratch);
|
|
|
|
|
uint64_t ts = timestamp_.fetch_add(1);
|
|
|
|
|
EncodeFixed64(scratch, ts);
|
|
|
|
|
return Slice(scratch, FLAGS_user_timestamp_size);
|
|
|
|
|
}
|
|
|
|
|
Slice GetTimestampForRead(Random64& rand, char* scratch) {
|
|
|
|
|
assert(FLAGS_user_timestamp_size == 8);
|
|
|
|
|
assert(scratch);
|
|
|
|
|
if (FLAGS_read_with_latest_user_timestamp) {
|
|
|
|
|
return Allocate(scratch);
|
|
|
|
|
}
|
|
|
|
|
// Choose a random timestamp from the past.
|
|
|
|
|
uint64_t ts = rand.Next() % Get();
|
|
|
|
|
EncodeFixed64(scratch, ts);
|
|
|
|
|
return Slice(scratch, FLAGS_user_timestamp_size);
|
|
|
|
|
}
|
|
|
|
|
};
|
|
|
|
|
|
|
|
|
|
// State shared by all concurrent executions of the same benchmark.
|
|
|
|
|
struct SharedState {
|
|
|
|
|
port::Mutex mu;
|
|
|
|
|
port::CondVar cv;
|
|
|
|
|
int total;
|
|
|
|
|
int perf_level;
|
|
|
|
|
std::shared_ptr<RateLimiter> write_rate_limiter;
|
|
|
|
|
std::shared_ptr<RateLimiter> read_rate_limiter;
|
|
|
|
|
|
|
|
|
|
// Each thread goes through the following states:
|
|
|
|
|
// (1) initializing
|
|
|
|
|
// (2) waiting for others to be initialized
|
|
|
|
|
// (3) running
|
|
|
|
|
// (4) done
|
|
|
|
|
|
|
|
|
|
long num_initialized;
|
|
|
|
|
long num_done;
|
|
|
|
|
bool start;
|
|
|
|
|
|
|
|
|
|
SharedState() : cv(&mu), perf_level(FLAGS_perf_level) { }
|
|
|
|
|
};
|
|
|
|
|
|
|
|
|
|
// Per-thread state for concurrent executions of the same benchmark.
|
|
|
|
|
struct ThreadState {
|
|
|
|
|
int tid; // 0..n-1 when running in n threads
|
|
|
|
|
Random64 rand; // Has different seeds for different threads
|
|
|
|
|
Stats stats;
|
|
|
|
|
SharedState* shared;
|
|
|
|
|
|
|
|
|
|
explicit ThreadState(int index, int my_seed)
|
|
|
|
|
: tid(index), rand(seed_base + my_seed) {}
|
|
|
|
|
};
|
|
|
|
|
|
|
|
|
|
class Duration {
|
|
|
|
|
public:
|
|
|
|
|
Duration(uint64_t max_seconds, int64_t max_ops, int64_t ops_per_stage = 0) {
|
|
|
|
|
max_seconds_ = max_seconds;
|
|
|
|
|
max_ops_= max_ops;
|
|
|
|
|
ops_per_stage_ = (ops_per_stage > 0) ? ops_per_stage : max_ops;
|
|
|
|
|
ops_ = 0;
|
|
|
|
|
start_at_ = FLAGS_env->NowMicros();
|
|
|
|
|
}
|
|
|
|
|
|
|
|
|
|
int64_t GetStage() { return std::min(ops_, max_ops_ - 1) / ops_per_stage_; }
|
|
|
|
|
|
|
|
|
|
bool Done(int64_t increment) {
|
|
|
|
|
if (increment <= 0) increment = 1; // avoid Done(0) and infinite loops
|
|
|
|
|
ops_ += increment;
|
|
|
|
|
|
|
|
|
|
if (max_seconds_) {
|
|
|
|
|
// Recheck every appx 1000 ops (exact iff increment is factor of 1000)
|
|
|
|
|
auto granularity = FLAGS_ops_between_duration_checks;
|
|
|
|
|
if ((ops_ / granularity) != ((ops_ - increment) / granularity)) {
|
|
|
|
|
uint64_t now = FLAGS_env->NowMicros();
|
|
|
|
|
return ((now - start_at_) / 1000000) >= max_seconds_;
|
|
|
|
|
} else {
|
|
|
|
|
return false;
|
|
|
|
|
}
|
|
|
|
|
} else {
|
|
|
|
|
return ops_ > max_ops_;
|
|
|
|
|
}
|
|
|
|
|
}
|
|
|
|
|
|
|
|
|
|
private:
|
|
|
|
|
uint64_t max_seconds_;
|
|
|
|
|
int64_t max_ops_;
|
|
|
|
|
int64_t ops_per_stage_;
|
|
|
|
|
int64_t ops_;
|
|
|
|
|
uint64_t start_at_;
|
|
|
|
|
};
|
|
|
|
|
|
|
|
|
|
class Benchmark {
|
|
|
|
|
private:
|
|
|
|
|
std::shared_ptr<Cache> cache_;
|
|
|
|
|
std::shared_ptr<Cache> compressed_cache_;
|
|
|
|
|
const SliceTransform* prefix_extractor_;
|
|
|
|
|
DBWithColumnFamilies db_;
|
|
|
|
|
std::vector<DBWithColumnFamilies> multi_dbs_;
|
|
|
|
|
int64_t num_;
|
|
|
|
|
int key_size_;
|
|
|
|
|
int user_timestamp_size_;
|
|
|
|
|
int prefix_size_;
|
|
|
|
|
int total_thread_count_;
|
|
|
|
|
int64_t keys_per_prefix_;
|
|
|
|
|
int64_t entries_per_batch_;
|
|
|
|
|
int64_t writes_before_delete_range_;
|
|
|
|
|
int64_t writes_per_range_tombstone_;
|
|
|
|
|
int64_t range_tombstone_width_;
|
|
|
|
|
int64_t max_num_range_tombstones_;
|
|
|
|
|
ReadOptions read_options_;
|
|
|
|
|
WriteOptions write_options_;
|
|
|
|
|
Options open_options_; // keep options around to properly destroy db later
|
|
|
|
|
#ifndef ROCKSDB_LITE
|
|
|
|
|
TraceOptions trace_options_;
|
|
|
|
|
TraceOptions block_cache_trace_options_;
|
|
|
|
|
#endif
|
|
|
|
|
int64_t reads_;
|
|
|
|
|
int64_t deletes_;
|
|
|
|
|
double read_random_exp_range_;
|
|
|
|
|
int64_t writes_;
|
|
|
|
|
int64_t readwrites_;
|
|
|
|
|
int64_t merge_keys_;
|
|
|
|
|
bool report_file_operations_;
|
|
|
|
|
bool use_blob_db_; // Stacked BlobDB
|
|
|
|
|
bool read_operands_; // read via GetMergeOperands()
|
|
|
|
|
std::vector<std::string> keys_;
|
|
|
|
|
|
Auto recovery from out of space errors (#4164)
Summary:
This commit implements automatic recovery from a Status::NoSpace() error
during background operations such as write callback, flush and
compaction. The broad design is as follows -
1. Compaction errors are treated as soft errors and don't put the
database in read-only mode. A compaction is delayed until enough free
disk space is available to accomodate the compaction outputs, which is
estimated based on the input size. This means that users can continue to
write, and we rely on the WriteController to delay or stop writes if the
compaction debt becomes too high due to persistent low disk space
condition
2. Errors during write callback and flush are treated as hard errors,
i.e the database is put in read-only mode and goes back to read-write
only fater certain recovery actions are taken.
3. Both types of recovery rely on the SstFileManagerImpl to poll for
sufficient disk space. We assume that there is a 1-1 mapping between an
SFM and the underlying OS storage container. For cases where multiple
DBs are hosted on a single storage container, the user is expected to
allocate a single SFM instance and use the same one for all the DBs. If
no SFM is specified by the user, DBImpl::Open() will allocate one, but
this will be one per DB and each DB will recover independently. The
recovery implemented by SFM is as follows -
a) On the first occurance of an out of space error during compaction,
subsequent
compactions will be delayed until the disk free space check indicates
enough available space. The required space is computed as the sum of
input sizes.
b) The free space check requirement will be removed once the amount of
free space is greater than the size reserved by in progress
compactions when the first error occured
c) If the out of space error is a hard error, a background thread in
SFM will poll for sufficient headroom before triggering the recovery
of the database and putting it in write-only mode. The headroom is
calculated as the sum of the write_buffer_size of all the DB instances
associated with the SFM
4. EventListener callbacks will be called at the start and completion of
automatic recovery. Users can disable the auto recov ery in the start
callback, and later initiate it manually by calling DB::Resume()
Todo:
1. More extensive testing
2. Add disk full condition to db_stress (follow-on PR)
Pull Request resolved: https://github.com/facebook/rocksdb/pull/4164
Differential Revision: D9846378
Pulled By: anand1976
fbshipit-source-id: 80ea875dbd7f00205e19c82215ff6e37da10da4a
6 years ago
|
|
|
class ErrorHandlerListener : public EventListener {
|
|
|
|
|
public:
|
|
|
|
|
#ifndef ROCKSDB_LITE
|
Auto recovery from out of space errors (#4164)
Summary:
This commit implements automatic recovery from a Status::NoSpace() error
during background operations such as write callback, flush and
compaction. The broad design is as follows -
1. Compaction errors are treated as soft errors and don't put the
database in read-only mode. A compaction is delayed until enough free
disk space is available to accomodate the compaction outputs, which is
estimated based on the input size. This means that users can continue to
write, and we rely on the WriteController to delay or stop writes if the
compaction debt becomes too high due to persistent low disk space
condition
2. Errors during write callback and flush are treated as hard errors,
i.e the database is put in read-only mode and goes back to read-write
only fater certain recovery actions are taken.
3. Both types of recovery rely on the SstFileManagerImpl to poll for
sufficient disk space. We assume that there is a 1-1 mapping between an
SFM and the underlying OS storage container. For cases where multiple
DBs are hosted on a single storage container, the user is expected to
allocate a single SFM instance and use the same one for all the DBs. If
no SFM is specified by the user, DBImpl::Open() will allocate one, but
this will be one per DB and each DB will recover independently. The
recovery implemented by SFM is as follows -
a) On the first occurance of an out of space error during compaction,
subsequent
compactions will be delayed until the disk free space check indicates
enough available space. The required space is computed as the sum of
input sizes.
b) The free space check requirement will be removed once the amount of
free space is greater than the size reserved by in progress
compactions when the first error occured
c) If the out of space error is a hard error, a background thread in
SFM will poll for sufficient headroom before triggering the recovery
of the database and putting it in write-only mode. The headroom is
calculated as the sum of the write_buffer_size of all the DB instances
associated with the SFM
4. EventListener callbacks will be called at the start and completion of
automatic recovery. Users can disable the auto recov ery in the start
callback, and later initiate it manually by calling DB::Resume()
Todo:
1. More extensive testing
2. Add disk full condition to db_stress (follow-on PR)
Pull Request resolved: https://github.com/facebook/rocksdb/pull/4164
Differential Revision: D9846378
Pulled By: anand1976
fbshipit-source-id: 80ea875dbd7f00205e19c82215ff6e37da10da4a
6 years ago
|
|
|
ErrorHandlerListener()
|
|
|
|
|
: mutex_(),
|
|
|
|
|
cv_(&mutex_),
|
|
|
|
|
no_auto_recovery_(false),
|
|
|
|
|
recovery_complete_(false) {}
|
|
|
|
|
|
|
|
|
|
~ErrorHandlerListener() override {}
|
Auto recovery from out of space errors (#4164)
Summary:
This commit implements automatic recovery from a Status::NoSpace() error
during background operations such as write callback, flush and
compaction. The broad design is as follows -
1. Compaction errors are treated as soft errors and don't put the
database in read-only mode. A compaction is delayed until enough free
disk space is available to accomodate the compaction outputs, which is
estimated based on the input size. This means that users can continue to
write, and we rely on the WriteController to delay or stop writes if the
compaction debt becomes too high due to persistent low disk space
condition
2. Errors during write callback and flush are treated as hard errors,
i.e the database is put in read-only mode and goes back to read-write
only fater certain recovery actions are taken.
3. Both types of recovery rely on the SstFileManagerImpl to poll for
sufficient disk space. We assume that there is a 1-1 mapping between an
SFM and the underlying OS storage container. For cases where multiple
DBs are hosted on a single storage container, the user is expected to
allocate a single SFM instance and use the same one for all the DBs. If
no SFM is specified by the user, DBImpl::Open() will allocate one, but
this will be one per DB and each DB will recover independently. The
recovery implemented by SFM is as follows -
a) On the first occurance of an out of space error during compaction,
subsequent
compactions will be delayed until the disk free space check indicates
enough available space. The required space is computed as the sum of
input sizes.
b) The free space check requirement will be removed once the amount of
free space is greater than the size reserved by in progress
compactions when the first error occured
c) If the out of space error is a hard error, a background thread in
SFM will poll for sufficient headroom before triggering the recovery
of the database and putting it in write-only mode. The headroom is
calculated as the sum of the write_buffer_size of all the DB instances
associated with the SFM
4. EventListener callbacks will be called at the start and completion of
automatic recovery. Users can disable the auto recov ery in the start
callback, and later initiate it manually by calling DB::Resume()
Todo:
1. More extensive testing
2. Add disk full condition to db_stress (follow-on PR)
Pull Request resolved: https://github.com/facebook/rocksdb/pull/4164
Differential Revision: D9846378
Pulled By: anand1976
fbshipit-source-id: 80ea875dbd7f00205e19c82215ff6e37da10da4a
6 years ago
|
|
|
|
|
|
|
|
const char* Name() const override { return kClassName(); }
|
|
|
|
|
static const char* kClassName() { return "ErrorHandlerListener"; }
|
|
|
|
|
|
Auto recovery from out of space errors (#4164)
Summary:
This commit implements automatic recovery from a Status::NoSpace() error
during background operations such as write callback, flush and
compaction. The broad design is as follows -
1. Compaction errors are treated as soft errors and don't put the
database in read-only mode. A compaction is delayed until enough free
disk space is available to accomodate the compaction outputs, which is
estimated based on the input size. This means that users can continue to
write, and we rely on the WriteController to delay or stop writes if the
compaction debt becomes too high due to persistent low disk space
condition
2. Errors during write callback and flush are treated as hard errors,
i.e the database is put in read-only mode and goes back to read-write
only fater certain recovery actions are taken.
3. Both types of recovery rely on the SstFileManagerImpl to poll for
sufficient disk space. We assume that there is a 1-1 mapping between an
SFM and the underlying OS storage container. For cases where multiple
DBs are hosted on a single storage container, the user is expected to
allocate a single SFM instance and use the same one for all the DBs. If
no SFM is specified by the user, DBImpl::Open() will allocate one, but
this will be one per DB and each DB will recover independently. The
recovery implemented by SFM is as follows -
a) On the first occurance of an out of space error during compaction,
subsequent
compactions will be delayed until the disk free space check indicates
enough available space. The required space is computed as the sum of
input sizes.
b) The free space check requirement will be removed once the amount of
free space is greater than the size reserved by in progress
compactions when the first error occured
c) If the out of space error is a hard error, a background thread in
SFM will poll for sufficient headroom before triggering the recovery
of the database and putting it in write-only mode. The headroom is
calculated as the sum of the write_buffer_size of all the DB instances
associated with the SFM
4. EventListener callbacks will be called at the start and completion of
automatic recovery. Users can disable the auto recov ery in the start
callback, and later initiate it manually by calling DB::Resume()
Todo:
1. More extensive testing
2. Add disk full condition to db_stress (follow-on PR)
Pull Request resolved: https://github.com/facebook/rocksdb/pull/4164
Differential Revision: D9846378
Pulled By: anand1976
fbshipit-source-id: 80ea875dbd7f00205e19c82215ff6e37da10da4a
6 years ago
|
|
|
void OnErrorRecoveryBegin(BackgroundErrorReason /*reason*/,
|
|
|
|
|
Status /*bg_error*/,
|
|
|
|
|
bool* auto_recovery) override {
|
Auto recovery from out of space errors (#4164)
Summary:
This commit implements automatic recovery from a Status::NoSpace() error
during background operations such as write callback, flush and
compaction. The broad design is as follows -
1. Compaction errors are treated as soft errors and don't put the
database in read-only mode. A compaction is delayed until enough free
disk space is available to accomodate the compaction outputs, which is
estimated based on the input size. This means that users can continue to
write, and we rely on the WriteController to delay or stop writes if the
compaction debt becomes too high due to persistent low disk space
condition
2. Errors during write callback and flush are treated as hard errors,
i.e the database is put in read-only mode and goes back to read-write
only fater certain recovery actions are taken.
3. Both types of recovery rely on the SstFileManagerImpl to poll for
sufficient disk space. We assume that there is a 1-1 mapping between an
SFM and the underlying OS storage container. For cases where multiple
DBs are hosted on a single storage container, the user is expected to
allocate a single SFM instance and use the same one for all the DBs. If
no SFM is specified by the user, DBImpl::Open() will allocate one, but
this will be one per DB and each DB will recover independently. The
recovery implemented by SFM is as follows -
a) On the first occurance of an out of space error during compaction,
subsequent
compactions will be delayed until the disk free space check indicates
enough available space. The required space is computed as the sum of
input sizes.
b) The free space check requirement will be removed once the amount of
free space is greater than the size reserved by in progress
compactions when the first error occured
c) If the out of space error is a hard error, a background thread in
SFM will poll for sufficient headroom before triggering the recovery
of the database and putting it in write-only mode. The headroom is
calculated as the sum of the write_buffer_size of all the DB instances
associated with the SFM
4. EventListener callbacks will be called at the start and completion of
automatic recovery. Users can disable the auto recov ery in the start
callback, and later initiate it manually by calling DB::Resume()
Todo:
1. More extensive testing
2. Add disk full condition to db_stress (follow-on PR)
Pull Request resolved: https://github.com/facebook/rocksdb/pull/4164
Differential Revision: D9846378
Pulled By: anand1976
fbshipit-source-id: 80ea875dbd7f00205e19c82215ff6e37da10da4a
6 years ago
|
|
|
if (*auto_recovery && no_auto_recovery_) {
|
|
|
|
|
*auto_recovery = false;
|
|
|
|
|
}
|
|
|
|
|
}
|
|
|
|
|
|
|
|
|
|
void OnErrorRecoveryCompleted(Status /*old_bg_error*/) override {
|
Auto recovery from out of space errors (#4164)
Summary:
This commit implements automatic recovery from a Status::NoSpace() error
during background operations such as write callback, flush and
compaction. The broad design is as follows -
1. Compaction errors are treated as soft errors and don't put the
database in read-only mode. A compaction is delayed until enough free
disk space is available to accomodate the compaction outputs, which is
estimated based on the input size. This means that users can continue to
write, and we rely on the WriteController to delay or stop writes if the
compaction debt becomes too high due to persistent low disk space
condition
2. Errors during write callback and flush are treated as hard errors,
i.e the database is put in read-only mode and goes back to read-write
only fater certain recovery actions are taken.
3. Both types of recovery rely on the SstFileManagerImpl to poll for
sufficient disk space. We assume that there is a 1-1 mapping between an
SFM and the underlying OS storage container. For cases where multiple
DBs are hosted on a single storage container, the user is expected to
allocate a single SFM instance and use the same one for all the DBs. If
no SFM is specified by the user, DBImpl::Open() will allocate one, but
this will be one per DB and each DB will recover independently. The
recovery implemented by SFM is as follows -
a) On the first occurance of an out of space error during compaction,
subsequent
compactions will be delayed until the disk free space check indicates
enough available space. The required space is computed as the sum of
input sizes.
b) The free space check requirement will be removed once the amount of
free space is greater than the size reserved by in progress
compactions when the first error occured
c) If the out of space error is a hard error, a background thread in
SFM will poll for sufficient headroom before triggering the recovery
of the database and putting it in write-only mode. The headroom is
calculated as the sum of the write_buffer_size of all the DB instances
associated with the SFM
4. EventListener callbacks will be called at the start and completion of
automatic recovery. Users can disable the auto recov ery in the start
callback, and later initiate it manually by calling DB::Resume()
Todo:
1. More extensive testing
2. Add disk full condition to db_stress (follow-on PR)
Pull Request resolved: https://github.com/facebook/rocksdb/pull/4164
Differential Revision: D9846378
Pulled By: anand1976
fbshipit-source-id: 80ea875dbd7f00205e19c82215ff6e37da10da4a
6 years ago
|
|
|
InstrumentedMutexLock l(&mutex_);
|
|
|
|
|
recovery_complete_ = true;
|
|
|
|
|
cv_.SignalAll();
|
|
|
|
|
}
|
|
|
|
|
|
|
|
|
|
bool WaitForRecovery(uint64_t abs_time_us) {
|
Auto recovery from out of space errors (#4164)
Summary:
This commit implements automatic recovery from a Status::NoSpace() error
during background operations such as write callback, flush and
compaction. The broad design is as follows -
1. Compaction errors are treated as soft errors and don't put the
database in read-only mode. A compaction is delayed until enough free
disk space is available to accomodate the compaction outputs, which is
estimated based on the input size. This means that users can continue to
write, and we rely on the WriteController to delay or stop writes if the
compaction debt becomes too high due to persistent low disk space
condition
2. Errors during write callback and flush are treated as hard errors,
i.e the database is put in read-only mode and goes back to read-write
only fater certain recovery actions are taken.
3. Both types of recovery rely on the SstFileManagerImpl to poll for
sufficient disk space. We assume that there is a 1-1 mapping between an
SFM and the underlying OS storage container. For cases where multiple
DBs are hosted on a single storage container, the user is expected to
allocate a single SFM instance and use the same one for all the DBs. If
no SFM is specified by the user, DBImpl::Open() will allocate one, but
this will be one per DB and each DB will recover independently. The
recovery implemented by SFM is as follows -
a) On the first occurance of an out of space error during compaction,
subsequent
compactions will be delayed until the disk free space check indicates
enough available space. The required space is computed as the sum of
input sizes.
b) The free space check requirement will be removed once the amount of
free space is greater than the size reserved by in progress
compactions when the first error occured
c) If the out of space error is a hard error, a background thread in
SFM will poll for sufficient headroom before triggering the recovery
of the database and putting it in write-only mode. The headroom is
calculated as the sum of the write_buffer_size of all the DB instances
associated with the SFM
4. EventListener callbacks will be called at the start and completion of
automatic recovery. Users can disable the auto recov ery in the start
callback, and later initiate it manually by calling DB::Resume()
Todo:
1. More extensive testing
2. Add disk full condition to db_stress (follow-on PR)
Pull Request resolved: https://github.com/facebook/rocksdb/pull/4164
Differential Revision: D9846378
Pulled By: anand1976
fbshipit-source-id: 80ea875dbd7f00205e19c82215ff6e37da10da4a
6 years ago
|
|
|
InstrumentedMutexLock l(&mutex_);
|
|
|
|
|
if (!recovery_complete_) {
|
|
|
|
|
cv_.TimedWait(abs_time_us);
|
Auto recovery from out of space errors (#4164)
Summary:
This commit implements automatic recovery from a Status::NoSpace() error
during background operations such as write callback, flush and
compaction. The broad design is as follows -
1. Compaction errors are treated as soft errors and don't put the
database in read-only mode. A compaction is delayed until enough free
disk space is available to accomodate the compaction outputs, which is
estimated based on the input size. This means that users can continue to
write, and we rely on the WriteController to delay or stop writes if the
compaction debt becomes too high due to persistent low disk space
condition
2. Errors during write callback and flush are treated as hard errors,
i.e the database is put in read-only mode and goes back to read-write
only fater certain recovery actions are taken.
3. Both types of recovery rely on the SstFileManagerImpl to poll for
sufficient disk space. We assume that there is a 1-1 mapping between an
SFM and the underlying OS storage container. For cases where multiple
DBs are hosted on a single storage container, the user is expected to
allocate a single SFM instance and use the same one for all the DBs. If
no SFM is specified by the user, DBImpl::Open() will allocate one, but
this will be one per DB and each DB will recover independently. The
recovery implemented by SFM is as follows -
a) On the first occurance of an out of space error during compaction,
subsequent
compactions will be delayed until the disk free space check indicates
enough available space. The required space is computed as the sum of
input sizes.
b) The free space check requirement will be removed once the amount of
free space is greater than the size reserved by in progress
compactions when the first error occured
c) If the out of space error is a hard error, a background thread in
SFM will poll for sufficient headroom before triggering the recovery
of the database and putting it in write-only mode. The headroom is
calculated as the sum of the write_buffer_size of all the DB instances
associated with the SFM
4. EventListener callbacks will be called at the start and completion of
automatic recovery. Users can disable the auto recov ery in the start
callback, and later initiate it manually by calling DB::Resume()
Todo:
1. More extensive testing
2. Add disk full condition to db_stress (follow-on PR)
Pull Request resolved: https://github.com/facebook/rocksdb/pull/4164
Differential Revision: D9846378
Pulled By: anand1976
fbshipit-source-id: 80ea875dbd7f00205e19c82215ff6e37da10da4a
6 years ago
|
|
|
}
|
|
|
|
|
if (recovery_complete_) {
|
|
|
|
|
recovery_complete_ = false;
|
|
|
|
|
return true;
|
|
|
|
|
}
|
|
|
|
|
return false;
|
|
|
|
|
}
|
|
|
|
|
|
|
|
|
|
void EnableAutoRecovery(bool enable = true) { no_auto_recovery_ = !enable; }
|
|
|
|
|
|
|
|
|
|
private:
|
|
|
|
|
InstrumentedMutex mutex_;
|
|
|
|
|
InstrumentedCondVar cv_;
|
|
|
|
|
bool no_auto_recovery_;
|
|
|
|
|
bool recovery_complete_;
|
|
|
|
|
#else // ROCKSDB_LITE
|
|
|
|
|
bool WaitForRecovery(uint64_t /*abs_time_us*/) { return true; }
|
|
|
|
|
void EnableAutoRecovery(bool /*enable*/) {}
|
|
|
|
|
#endif // ROCKSDB_LITE
|
Auto recovery from out of space errors (#4164)
Summary:
This commit implements automatic recovery from a Status::NoSpace() error
during background operations such as write callback, flush and
compaction. The broad design is as follows -
1. Compaction errors are treated as soft errors and don't put the
database in read-only mode. A compaction is delayed until enough free
disk space is available to accomodate the compaction outputs, which is
estimated based on the input size. This means that users can continue to
write, and we rely on the WriteController to delay or stop writes if the
compaction debt becomes too high due to persistent low disk space
condition
2. Errors during write callback and flush are treated as hard errors,
i.e the database is put in read-only mode and goes back to read-write
only fater certain recovery actions are taken.
3. Both types of recovery rely on the SstFileManagerImpl to poll for
sufficient disk space. We assume that there is a 1-1 mapping between an
SFM and the underlying OS storage container. For cases where multiple
DBs are hosted on a single storage container, the user is expected to
allocate a single SFM instance and use the same one for all the DBs. If
no SFM is specified by the user, DBImpl::Open() will allocate one, but
this will be one per DB and each DB will recover independently. The
recovery implemented by SFM is as follows -
a) On the first occurance of an out of space error during compaction,
subsequent
compactions will be delayed until the disk free space check indicates
enough available space. The required space is computed as the sum of
input sizes.
b) The free space check requirement will be removed once the amount of
free space is greater than the size reserved by in progress
compactions when the first error occured
c) If the out of space error is a hard error, a background thread in
SFM will poll for sufficient headroom before triggering the recovery
of the database and putting it in write-only mode. The headroom is
calculated as the sum of the write_buffer_size of all the DB instances
associated with the SFM
4. EventListener callbacks will be called at the start and completion of
automatic recovery. Users can disable the auto recov ery in the start
callback, and later initiate it manually by calling DB::Resume()
Todo:
1. More extensive testing
2. Add disk full condition to db_stress (follow-on PR)
Pull Request resolved: https://github.com/facebook/rocksdb/pull/4164
Differential Revision: D9846378
Pulled By: anand1976
fbshipit-source-id: 80ea875dbd7f00205e19c82215ff6e37da10da4a
6 years ago
|
|
|
};
|
|
|
|
|
|
|
|
|
|
std::shared_ptr<ErrorHandlerListener> listener_;
|
|
|
|
|
|
|
|
|
|
std::unique_ptr<TimestampEmulator> mock_app_clock_;
|
|
|
|
|
|
|
|
|
|
bool SanityCheck() {
|
|
|
|
|
if (FLAGS_compression_ratio > 1) {
|
|
|
|
|
fprintf(stderr, "compression_ratio should be between 0 and 1\n");
|
|
|
|
|
return false;
|
|
|
|
|
}
|
|
|
|
|
return true;
|
|
|
|
|
}
|
|
|
|
|
|
|
|
|
|
inline bool CompressSlice(const CompressionInfo& compression_info,
|
|
|
|
|
const Slice& input, std::string* compressed) {
|
|
|
|
|
constexpr uint32_t compress_format_version = 2;
|
|
|
|
|
|
|
|
|
|
return CompressData(input, compression_info, compress_format_version,
|
|
|
|
|
compressed);
|
|
|
|
|
}
|
|
|
|
|
|
|
|
|
|
void PrintHeader(const Options& options) {
|
|
|
|
|
PrintEnvironment();
|
|
|
|
|
fprintf(stdout,
|
|
|
|
|
"Keys: %d bytes each (+ %d bytes user-defined timestamp)\n",
|
|
|
|
|
FLAGS_key_size, FLAGS_user_timestamp_size);
|
|
|
|
|
auto avg_value_size = FLAGS_value_size;
|
|
|
|
|
if (FLAGS_value_size_distribution_type_e == kFixed) {
|
|
|
|
|
fprintf(stdout, "Values: %d bytes each (%d bytes after compression)\n",
|
|
|
|
|
avg_value_size,
|
|
|
|
|
static_cast<int>(avg_value_size * FLAGS_compression_ratio + 0.5));
|
|
|
|
|
} else {
|
|
|
|
|
avg_value_size = (FLAGS_value_size_min + FLAGS_value_size_max) / 2;
|
|
|
|
|
fprintf(stdout, "Values: %d avg bytes each (%d bytes after compression)\n",
|
|
|
|
|
avg_value_size,
|
|
|
|
|
static_cast<int>(avg_value_size * FLAGS_compression_ratio + 0.5));
|
|
|
|
|
fprintf(stdout, "Values Distribution: %s (min: %d, max: %d)\n",
|
|
|
|
|
FLAGS_value_size_distribution_type.c_str(),
|
|
|
|
|
FLAGS_value_size_min, FLAGS_value_size_max);
|
|
|
|
|
}
|
|
|
|
|
fprintf(stdout, "Entries: %" PRIu64 "\n", num_);
|
|
|
|
|
fprintf(stdout, "Prefix: %d bytes\n", FLAGS_prefix_size);
|
|
|
|
|
fprintf(stdout, "Keys per prefix: %" PRIu64 "\n", keys_per_prefix_);
|
|
|
|
|
fprintf(stdout, "RawSize: %.1f MB (estimated)\n",
|
|
|
|
|
((static_cast<int64_t>(FLAGS_key_size + avg_value_size) * num_)
|
|
|
|
|
/ 1048576.0));
|
|
|
|
|
fprintf(stdout, "FileSize: %.1f MB (estimated)\n",
|
|
|
|
|
(((FLAGS_key_size + avg_value_size * FLAGS_compression_ratio)
|
|
|
|
|
* num_)
|
|
|
|
|
/ 1048576.0));
|
|
|
|
|
fprintf(stdout, "Write rate: %" PRIu64 " bytes/second\n",
|
|
|
|
|
FLAGS_benchmark_write_rate_limit);
|
|
|
|
|
fprintf(stdout, "Read rate: %" PRIu64 " ops/second\n",
|
|
|
|
|
FLAGS_benchmark_read_rate_limit);
|
|
|
|
|
if (FLAGS_enable_numa) {
|
|
|
|
|
fprintf(stderr, "Running in NUMA enabled mode.\n");
|
|
|
|
|
#ifndef NUMA
|
|
|
|
|
fprintf(stderr, "NUMA is not defined in the system.\n");
|
|
|
|
|
exit(1);
|
|
|
|
|
#else
|
|
|
|
|
if (numa_available() == -1) {
|
|
|
|
|
fprintf(stderr, "NUMA is not supported by the system.\n");
|
|
|
|
|
exit(1);
|
|
|
|
|
}
|
|
|
|
|
#endif
|
|
|
|
|
}
|
|
|
|
|
|
|
|
|
|
auto compression = CompressionTypeToString(FLAGS_compression_type_e);
|
|
|
|
|
fprintf(stdout, "Compression: %s\n", compression.c_str());
|
|
|
|
|
fprintf(stdout, "Compression sampling rate: %" PRId64 "\n",
|
|
|
|
|
FLAGS_sample_for_compression);
|
|
|
|
|
if (options.memtable_factory != nullptr) {
|
|
|
|
|
fprintf(stdout, "Memtablerep: %s\n",
|
|
|
|
|
options.memtable_factory->GetId().c_str());
|
|
|
|
|
}
|
|
|
|
|
fprintf(stdout, "Perf Level: %d\n", FLAGS_perf_level);
|
|
|
|
|
|
|
|
|
|
PrintWarnings(compression.c_str());
|
|
|
|
|
fprintf(stdout, "------------------------------------------------\n");
|
|
|
|
|
}
|
|
|
|
|
|
|
|
|
|
void PrintWarnings(const char* compression) {
|
|
|
|
|
#if defined(__GNUC__) && !defined(__OPTIMIZE__)
|
|
|
|
|
fprintf(stdout,
|
|
|
|
|
"WARNING: Optimization is disabled: benchmarks unnecessarily slow\n"
|
|
|
|
|
);
|
|
|
|
|
#endif
|
|
|
|
|
#ifndef NDEBUG
|
|
|
|
|
fprintf(stdout,
|
|
|
|
|
"WARNING: Assertions are enabled; benchmarks unnecessarily slow\n");
|
|
|
|
|
#endif
|
|
|
|
|
if (FLAGS_compression_type_e != ROCKSDB_NAMESPACE::kNoCompression) {
|
|
|
|
|
// The test string should not be too small.
|
|
|
|
|
const int len = FLAGS_block_size;
|
|
|
|
|
std::string input_str(len, 'y');
|
|
|
|
|
std::string compressed;
|
|
|
|
|
CompressionOptions opts;
|
|
|
|
|
CompressionContext context(FLAGS_compression_type_e);
|
|
|
|
|
CompressionInfo info(opts, context, CompressionDict::GetEmptyDict(),
|
|
|
|
|
FLAGS_compression_type_e,
|
|
|
|
|
FLAGS_sample_for_compression);
|
|
|
|
|
bool result = CompressSlice(info, Slice(input_str), &compressed);
|
|
|
|
|
|
|
|
|
|
if (!result) {
|
|
|
|
|
fprintf(stdout, "WARNING: %s compression is not enabled\n",
|
|
|
|
|
compression);
|
|
|
|
|
} else if (compressed.size() >= input_str.size()) {
|
|
|
|
|
fprintf(stdout, "WARNING: %s compression is not effective\n",
|
|
|
|
|
compression);
|
|
|
|
|
}
|
|
|
|
|
}
|
|
|
|
|
}
|
|
|
|
|
|
|
|
|
|
// Current the following isn't equivalent to OS_LINUX.
|
|
|
|
|
#if defined(__linux)
|
|
|
|
|
static Slice TrimSpace(Slice s) {
|
|
|
|
|
unsigned int start = 0;
|
|
|
|
|
while (start < s.size() && isspace(s[start])) {
|
|
|
|
|
start++;
|
|
|
|
|
}
|
|
|
|
|
unsigned int limit = static_cast<unsigned int>(s.size());
|
|
|
|
|
while (limit > start && isspace(s[limit-1])) {
|
|
|
|
|
limit--;
|
|
|
|
|
}
|
|
|
|
|
return Slice(s.data() + start, limit - start);
|
|
|
|
|
}
|
|
|
|
|
#endif
|
|
|
|
|
|
|
|
|
|
void PrintEnvironment() {
|
|
|
|
|
fprintf(stderr, "RocksDB: version %d.%d\n",
|
|
|
|
|
kMajorVersion, kMinorVersion);
|
|
|
|
|
|
|
|
|
|
#if defined(__linux) || defined(__APPLE__) || defined(__FreeBSD__)
|
|
|
|
|
time_t now = time(nullptr);
|
|
|
|
|
char buf[52];
|
|
|
|
|
// Lint complains about ctime() usage, so replace it with ctime_r(). The
|
|
|
|
|
// requirement is to provide a buffer which is at least 26 bytes.
|
|
|
|
|
fprintf(stderr, "Date: %s",
|
|
|
|
|
ctime_r(&now, buf)); // ctime_r() adds newline
|
|
|
|
|
|
|
|
|
|
#if defined(__linux)
|
|
|
|
|
FILE* cpuinfo = fopen("/proc/cpuinfo", "r");
|
|
|
|
|
if (cpuinfo != nullptr) {
|
|
|
|
|
char line[1000];
|
|
|
|
|
int num_cpus = 0;
|
|
|
|
|
std::string cpu_type;
|
|
|
|
|
std::string cache_size;
|
|
|
|
|
while (fgets(line, sizeof(line), cpuinfo) != nullptr) {
|
|
|
|
|
const char* sep = strchr(line, ':');
|
|
|
|
|
if (sep == nullptr) {
|
|
|
|
|
continue;
|
|
|
|
|
}
|
|
|
|
|
Slice key = TrimSpace(Slice(line, sep - 1 - line));
|
|
|
|
|
Slice val = TrimSpace(Slice(sep + 1));
|
|
|
|
|
if (key == "model name") {
|
|
|
|
|
++num_cpus;
|
|
|
|
|
cpu_type = val.ToString();
|
|
|
|
|
} else if (key == "cache size") {
|
|
|
|
|
cache_size = val.ToString();
|
|
|
|
|
}
|
|
|
|
|
}
|
|
|
|
|
fclose(cpuinfo);
|
|
|
|
|
fprintf(stderr, "CPU: %d * %s\n", num_cpus, cpu_type.c_str());
|
|
|
|
|
fprintf(stderr, "CPUCache: %s\n", cache_size.c_str());
|
|
|
|
|
}
|
|
|
|
|
#elif defined(__APPLE__)
|
|
|
|
|
struct host_basic_info h;
|
|
|
|
|
size_t hlen = HOST_BASIC_INFO_COUNT;
|
|
|
|
|
if (host_info(mach_host_self(), HOST_BASIC_INFO, (host_info_t)&h,
|
|
|
|
|
(uint32_t*)&hlen) == KERN_SUCCESS) {
|
|
|
|
|
std::string cpu_type;
|
|
|
|
|
std::string cache_size;
|
|
|
|
|
size_t hcache_size;
|
|
|
|
|
hlen = sizeof(hcache_size);
|
|
|
|
|
if (sysctlbyname("hw.cachelinesize", &hcache_size, &hlen, NULL, 0) == 0) {
|
|
|
|
|
cache_size = std::to_string(hcache_size);
|
|
|
|
|
}
|
|
|
|
|
switch (h.cpu_type) {
|
|
|
|
|
case CPU_TYPE_X86_64:
|
|
|
|
|
cpu_type = "x86_64";
|
|
|
|
|
break;
|
|
|
|
|
case CPU_TYPE_ARM64:
|
|
|
|
|
cpu_type = "arm64";
|
|
|
|
|
break;
|
|
|
|
|
default:
|
|
|
|
|
break;
|
|
|
|
|
}
|
|
|
|
|
fprintf(stderr, "CPU: %d * %s\n", h.max_cpus, cpu_type.c_str());
|
|
|
|
|
fprintf(stderr, "CPUCache: %s\n", cache_size.c_str());
|
|
|
|
|
}
|
|
|
|
|
#elif defined(__FreeBSD__)
|
|
|
|
|
int ncpus;
|
|
|
|
|
size_t len = sizeof(ncpus);
|
|
|
|
|
int mib[2] = {CTL_HW, HW_NCPU};
|
|
|
|
|
if (sysctl(mib, 2, &ncpus, &len, nullptr, 0) == 0) {
|
|
|
|
|
char cpu_type[16];
|
|
|
|
|
len = sizeof(cpu_type) - 1;
|
|
|
|
|
mib[1] = HW_MACHINE;
|
|
|
|
|
if (sysctl(mib, 2, cpu_type, &len, nullptr, 0) == 0) cpu_type[len] = 0;
|
|
|
|
|
|
|
|
|
|
fprintf(stderr, "CPU: %d * %s\n", ncpus, cpu_type);
|
|
|
|
|
// no programmatic way to get the cache line size except on PPC
|
|
|
|
|
}
|
|
|
|
|
#endif
|
|
|
|
|
#endif
|
|
|
|
|
}
|
|
|
|
|
|
|
|
|
|
static bool KeyExpired(const TimestampEmulator* timestamp_emulator,
|
|
|
|
|
const Slice& key) {
|
|
|
|
|
const char* pos = key.data();
|
|
|
|
|
pos += 8;
|
|
|
|
|
uint64_t timestamp = 0;
|
|
|
|
|
if (port::kLittleEndian) {
|
|
|
|
|
int bytes_to_fill = 8;
|
|
|
|
|
for (int i = 0; i < bytes_to_fill; ++i) {
|
|
|
|
|
timestamp |= (static_cast<uint64_t>(static_cast<unsigned char>(pos[i]))
|
|
|
|
|
<< ((bytes_to_fill - i - 1) << 3));
|
|
|
|
|
}
|
|
|
|
|
} else {
|
|
|
|
|
memcpy(×tamp, pos, sizeof(timestamp));
|
|
|
|
|
}
|
|
|
|
|
return timestamp_emulator->Get() - timestamp > FLAGS_time_range;
|
|
|
|
|
}
|
|
|
|
|
|
|
|
|
|
class ExpiredTimeFilter : public CompactionFilter {
|
|
|
|
|
public:
|
|
|
|
|
explicit ExpiredTimeFilter(
|
|
|
|
|
const std::shared_ptr<TimestampEmulator>& timestamp_emulator)
|
|
|
|
|
: timestamp_emulator_(timestamp_emulator) {}
|
|
|
|
|
bool Filter(int /*level*/, const Slice& key,
|
|
|
|
|
const Slice& /*existing_value*/, std::string* /*new_value*/,
|
|
|
|
|
bool* /*value_changed*/) const override {
|
|
|
|
|
return KeyExpired(timestamp_emulator_.get(), key);
|
|
|
|
|
}
|
|
|
|
|
const char* Name() const override { return "ExpiredTimeFilter"; }
|
|
|
|
|
|
|
|
|
|
private:
|
|
|
|
|
std::shared_ptr<TimestampEmulator> timestamp_emulator_;
|
|
|
|
|
};
|
|
|
|
|
|
|
|
|
|
class KeepFilter : public CompactionFilter {
|
|
|
|
|
public:
|
|
|
|
|
bool Filter(int /*level*/, const Slice& /*key*/, const Slice& /*value*/,
|
|
|
|
|
std::string* /*new_value*/,
|
|
|
|
|
bool* /*value_changed*/) const override {
|
|
|
|
|
return false;
|
|
|
|
|
}
|
|
|
|
|
|
|
|
|
|
const char* Name() const override { return "KeepFilter"; }
|
|
|
|
|
};
|
|
|
|
|
|
|
|
|
|
std::shared_ptr<Cache> NewCache(int64_t capacity) {
|
|
|
|
|
if (capacity <= 0) {
|
|
|
|
|
return nullptr;
|
|
|
|
|
}
|
|
|
|
|
if (FLAGS_use_clock_cache) {
|
|
|
|
|
auto cache = NewClockCache(static_cast<size_t>(capacity),
|
|
|
|
|
FLAGS_cache_numshardbits);
|
|
|
|
|
if (!cache) {
|
|
|
|
|
fprintf(stderr, "Clock cache not supported.");
|
|
|
|
|
exit(1);
|
|
|
|
|
}
|
|
|
|
|
return cache;
|
|
|
|
|
} else {
|
|
|
|
|
LRUCacheOptions opts(
|
|
|
|
|
static_cast<size_t>(capacity), FLAGS_cache_numshardbits,
|
|
|
|
|
false /*strict_capacity_limit*/, FLAGS_cache_high_pri_pool_ratio,
|
Provide an allocator for new memory type to be used with RocksDB block cache (#6214)
Summary:
New memory technologies are being developed by various hardware vendors (Intel DCPMM is one such technology currently available). These new memory types require different libraries for allocation and management (such as PMDK and memkind). The high capacities available make it possible to provision large caches (up to several TBs in size), beyond what is achievable with DRAM.
The new allocator provided in this PR uses the memkind library to allocate memory on different media.
**Performance**
We tested the new allocator using db_bench.
- For each test, we vary the size of the block cache (relative to the size of the uncompressed data in the database).
- The database is filled sequentially. Throughput is then measured with a readrandom benchmark.
- We use a uniform distribution as a worst-case scenario.
The plot shows throughput (ops/s) relative to a configuration with no block cache and default allocator.
For all tests, p99 latency is below 500 us.

**Changes**
- Add MemkindKmemAllocator
- Add --use_cache_memkind_kmem_allocator db_bench option (to create an LRU block cache with the new allocator)
- Add detection of memkind library with KMEM DAX support
- Add test for MemkindKmemAllocator
**Minimum Requirements**
- kernel 5.3.12
- ndctl v67 - https://github.com/pmem/ndctl
- memkind v1.10.0 - https://github.com/memkind/memkind
**Memory Configuration**
The allocator uses the MEMKIND_DAX_KMEM memory kind. Follow the instructions on[ memkind’s GitHub page](https://github.com/memkind/memkind) to set up NVDIMM memory accordingly.
Note on memory allocation with NVDIMM memory exposed as system memory.
- The MemkindKmemAllocator will only allocate from NVDIMM memory (using memkind_malloc with MEMKIND_DAX_KMEM kind).
- The default allocator is not restricted to RAM by default. Based on NUMA node latency, the kernel should allocate from local RAM preferentially, but it’s a kernel decision. numactl --preferred/--membind can be used to allocate preferentially/exclusively from the local RAM node.
**Usage**
When creating an LRU cache, pass a MemkindKmemAllocator object as argument.
For example (replace capacity with the desired value in bytes):
```
#include "rocksdb/cache.h"
#include "memory/memkind_kmem_allocator.h"
NewLRUCache(
capacity /*size_t*/,
6 /*cache_numshardbits*/,
false /*strict_capacity_limit*/,
false /*cache_high_pri_pool_ratio*/,
std::make_shared<MemkindKmemAllocator>());
```
Refer to [RocksDB’s block cache documentation](https://github.com/facebook/rocksdb/wiki/Block-Cache) to assign the LRU cache as block cache for a database.
Pull Request resolved: https://github.com/facebook/rocksdb/pull/6214
Reviewed By: cheng-chang
Differential Revision: D19292435
fbshipit-source-id: 7202f47b769e7722b539c86c2ffd669f64d7b4e1
4 years ago
|
|
|
#ifdef MEMKIND
|
|
|
|
|
FLAGS_use_cache_memkind_kmem_allocator
|
|
|
|
|
? std::make_shared<MemkindKmemAllocator>()
|
|
|
|
|
: nullptr
|
Provide an allocator for new memory type to be used with RocksDB block cache (#6214)
Summary:
New memory technologies are being developed by various hardware vendors (Intel DCPMM is one such technology currently available). These new memory types require different libraries for allocation and management (such as PMDK and memkind). The high capacities available make it possible to provision large caches (up to several TBs in size), beyond what is achievable with DRAM.
The new allocator provided in this PR uses the memkind library to allocate memory on different media.
**Performance**
We tested the new allocator using db_bench.
- For each test, we vary the size of the block cache (relative to the size of the uncompressed data in the database).
- The database is filled sequentially. Throughput is then measured with a readrandom benchmark.
- We use a uniform distribution as a worst-case scenario.
The plot shows throughput (ops/s) relative to a configuration with no block cache and default allocator.
For all tests, p99 latency is below 500 us.

**Changes**
- Add MemkindKmemAllocator
- Add --use_cache_memkind_kmem_allocator db_bench option (to create an LRU block cache with the new allocator)
- Add detection of memkind library with KMEM DAX support
- Add test for MemkindKmemAllocator
**Minimum Requirements**
- kernel 5.3.12
- ndctl v67 - https://github.com/pmem/ndctl
- memkind v1.10.0 - https://github.com/memkind/memkind
**Memory Configuration**
The allocator uses the MEMKIND_DAX_KMEM memory kind. Follow the instructions on[ memkind’s GitHub page](https://github.com/memkind/memkind) to set up NVDIMM memory accordingly.
Note on memory allocation with NVDIMM memory exposed as system memory.
- The MemkindKmemAllocator will only allocate from NVDIMM memory (using memkind_malloc with MEMKIND_DAX_KMEM kind).
- The default allocator is not restricted to RAM by default. Based on NUMA node latency, the kernel should allocate from local RAM preferentially, but it’s a kernel decision. numactl --preferred/--membind can be used to allocate preferentially/exclusively from the local RAM node.
**Usage**
When creating an LRU cache, pass a MemkindKmemAllocator object as argument.
For example (replace capacity with the desired value in bytes):
```
#include "rocksdb/cache.h"
#include "memory/memkind_kmem_allocator.h"
NewLRUCache(
capacity /*size_t*/,
6 /*cache_numshardbits*/,
false /*strict_capacity_limit*/,
false /*cache_high_pri_pool_ratio*/,
std::make_shared<MemkindKmemAllocator>());
```
Refer to [RocksDB’s block cache documentation](https://github.com/facebook/rocksdb/wiki/Block-Cache) to assign the LRU cache as block cache for a database.
Pull Request resolved: https://github.com/facebook/rocksdb/pull/6214
Reviewed By: cheng-chang
Differential Revision: D19292435
fbshipit-source-id: 7202f47b769e7722b539c86c2ffd669f64d7b4e1
4 years ago
|
|
|
#else
|
|
|
|
|
nullptr
|
|
|
|
|
#endif
|
|
|
|
|
);
|
|
|
|
|
if (FLAGS_use_cache_memkind_kmem_allocator) {
|
|
|
|
|
#ifndef MEMKIND
|
Provide an allocator for new memory type to be used with RocksDB block cache (#6214)
Summary:
New memory technologies are being developed by various hardware vendors (Intel DCPMM is one such technology currently available). These new memory types require different libraries for allocation and management (such as PMDK and memkind). The high capacities available make it possible to provision large caches (up to several TBs in size), beyond what is achievable with DRAM.
The new allocator provided in this PR uses the memkind library to allocate memory on different media.
**Performance**
We tested the new allocator using db_bench.
- For each test, we vary the size of the block cache (relative to the size of the uncompressed data in the database).
- The database is filled sequentially. Throughput is then measured with a readrandom benchmark.
- We use a uniform distribution as a worst-case scenario.
The plot shows throughput (ops/s) relative to a configuration with no block cache and default allocator.
For all tests, p99 latency is below 500 us.

**Changes**
- Add MemkindKmemAllocator
- Add --use_cache_memkind_kmem_allocator db_bench option (to create an LRU block cache with the new allocator)
- Add detection of memkind library with KMEM DAX support
- Add test for MemkindKmemAllocator
**Minimum Requirements**
- kernel 5.3.12
- ndctl v67 - https://github.com/pmem/ndctl
- memkind v1.10.0 - https://github.com/memkind/memkind
**Memory Configuration**
The allocator uses the MEMKIND_DAX_KMEM memory kind. Follow the instructions on[ memkind’s GitHub page](https://github.com/memkind/memkind) to set up NVDIMM memory accordingly.
Note on memory allocation with NVDIMM memory exposed as system memory.
- The MemkindKmemAllocator will only allocate from NVDIMM memory (using memkind_malloc with MEMKIND_DAX_KMEM kind).
- The default allocator is not restricted to RAM by default. Based on NUMA node latency, the kernel should allocate from local RAM preferentially, but it’s a kernel decision. numactl --preferred/--membind can be used to allocate preferentially/exclusively from the local RAM node.
**Usage**
When creating an LRU cache, pass a MemkindKmemAllocator object as argument.
For example (replace capacity with the desired value in bytes):
```
#include "rocksdb/cache.h"
#include "memory/memkind_kmem_allocator.h"
NewLRUCache(
capacity /*size_t*/,
6 /*cache_numshardbits*/,
false /*strict_capacity_limit*/,
false /*cache_high_pri_pool_ratio*/,
std::make_shared<MemkindKmemAllocator>());
```
Refer to [RocksDB’s block cache documentation](https://github.com/facebook/rocksdb/wiki/Block-Cache) to assign the LRU cache as block cache for a database.
Pull Request resolved: https://github.com/facebook/rocksdb/pull/6214
Reviewed By: cheng-chang
Differential Revision: D19292435
fbshipit-source-id: 7202f47b769e7722b539c86c2ffd669f64d7b4e1
4 years ago
|
|
|
fprintf(stderr, "Memkind library is not linked with the binary.");
|
|
|
|
|
exit(1);
|
|
|
|
|
#endif
|
|
|
|
|
}
|
|
|
|
|
#ifndef ROCKSDB_LITE
|
|
|
|
|
if (!FLAGS_secondary_cache_uri.empty()) {
|
|
|
|
|
Status s = SecondaryCache::CreateFromString(
|
|
|
|
|
ConfigOptions(), FLAGS_secondary_cache_uri, &secondary_cache);
|
|
|
|
|
if (secondary_cache == nullptr) {
|
|
|
|
|
fprintf(
|
|
|
|
|
stderr,
|
|
|
|
|
"No secondary cache registered matching string: %s status=%s\n",
|
|
|
|
|
FLAGS_secondary_cache_uri.c_str(), s.ToString().c_str());
|
|
|
|
|
exit(1);
|
|
|
|
|
}
|
|
|
|
|
opts.secondary_cache = secondary_cache;
|
|
|
|
|
}
|
|
|
|
|
#endif // ROCKSDB_LITE
|
|
|
|
|
|
|
|
|
|
if (FLAGS_use_compressed_secondary_cache) {
|
|
|
|
|
CompressedSecondaryCacheOptions secondary_cache_opts;
|
|
|
|
|
secondary_cache_opts.capacity = FLAGS_compressed_secondary_cache_size;
|
|
|
|
|
secondary_cache_opts.num_shard_bits =
|
|
|
|
|
FLAGS_compressed_secondary_cache_numshardbits;
|
|
|
|
|
secondary_cache_opts.high_pri_pool_ratio =
|
|
|
|
|
FLAGS_compressed_secondary_cache_high_pri_pool_ratio;
|
|
|
|
|
secondary_cache_opts.compression_type =
|
|
|
|
|
FLAGS_compressed_secondary_cache_compression_type_e;
|
|
|
|
|
secondary_cache_opts.compress_format_version =
|
|
|
|
|
FLAGS_compressed_secondary_cache_compress_format_version;
|
|
|
|
|
opts.secondary_cache =
|
|
|
|
|
NewCompressedSecondaryCache(secondary_cache_opts);
|
|
|
|
|
}
|
|
|
|
|
|
|
|
|
|
return NewLRUCache(opts);
|
|
|
|
|
}
|
|
|
|
|
}
|
|
|
|
|
|
|
|
|
|
public:
|
|
|
|
|
Benchmark()
|
|
|
|
|
: cache_(NewCache(FLAGS_cache_size)),
|
|
|
|
|
compressed_cache_(NewCache(FLAGS_compressed_cache_size)),
|
|
|
|
|
prefix_extractor_(NewFixedPrefixTransform(FLAGS_prefix_size)),
|
|
|
|
|
num_(FLAGS_num),
|
|
|
|
|
key_size_(FLAGS_key_size),
|
|
|
|
|
user_timestamp_size_(FLAGS_user_timestamp_size),
|
|
|
|
|
prefix_size_(FLAGS_prefix_size),
|
|
|
|
|
total_thread_count_(0),
|
|
|
|
|
keys_per_prefix_(FLAGS_keys_per_prefix),
|
|
|
|
|
entries_per_batch_(1),
|
|
|
|
|
reads_(FLAGS_reads < 0 ? FLAGS_num : FLAGS_reads),
|
|
|
|
|
read_random_exp_range_(0.0),
|
|
|
|
|
writes_(FLAGS_writes < 0 ? FLAGS_num : FLAGS_writes),
|
|
|
|
|
readwrites_(
|
|
|
|
|
(FLAGS_writes < 0 && FLAGS_reads < 0)
|
|
|
|
|
? FLAGS_num
|
|
|
|
|
: ((FLAGS_writes > FLAGS_reads) ? FLAGS_writes : FLAGS_reads)),
|
|
|
|
|
merge_keys_(FLAGS_merge_keys < 0 ? FLAGS_num : FLAGS_merge_keys),
|
|
|
|
|
report_file_operations_(FLAGS_report_file_operations),
|
|
|
|
|
#ifndef ROCKSDB_LITE
|
|
|
|
|
use_blob_db_(FLAGS_use_blob_db), // Stacked BlobDB
|
|
|
|
|
#else
|
|
|
|
|
use_blob_db_(false), // Stacked BlobDB
|
|
|
|
|
#endif // !ROCKSDB_LITE
|
|
|
|
|
read_operands_(false) {
|
|
|
|
|
// use simcache instead of cache
|
|
|
|
|
if (FLAGS_simcache_size >= 0) {
|
|
|
|
|
if (FLAGS_cache_numshardbits >= 1) {
|
|
|
|
|
cache_ =
|
|
|
|
|
NewSimCache(cache_, FLAGS_simcache_size, FLAGS_cache_numshardbits);
|
|
|
|
|
} else {
|
|
|
|
|
cache_ = NewSimCache(cache_, FLAGS_simcache_size, 0);
|
|
|
|
|
}
|
|
|
|
|
}
|
|
|
|
|
|
|
|
|
|
if (report_file_operations_) {
|
|
|
|
|
FLAGS_env = new CompositeEnvWrapper(
|
|
|
|
|
FLAGS_env,
|
|
|
|
|
std::make_shared<CountedFileSystem>(FLAGS_env->GetFileSystem()));
|
|
|
|
|
}
|
|
|
|
|
|
|
|
|
|
if (FLAGS_prefix_size > FLAGS_key_size) {
|
|
|
|
|
fprintf(stderr, "prefix size is larger than key size");
|
|
|
|
|
exit(1);
|
|
|
|
|
}
|
|
|
|
|
|
|
|
|
|
std::vector<std::string> files;
|
|
|
|
|
FLAGS_env->GetChildren(FLAGS_db, &files);
|
|
|
|
|
for (size_t i = 0; i < files.size(); i++) {
|
|
|
|
|
if (Slice(files[i]).starts_with("heap-")) {
|
|
|
|
|
FLAGS_env->DeleteFile(FLAGS_db + "/" + files[i]);
|
|
|
|
|
}
|
|
|
|
|
}
|
|
|
|
|
if (!FLAGS_use_existing_db) {
|
benchmark.sh won't run through all tests properly if one specifies wal_dir to be different than db directory.
Summary:
A command line like this to run all the tests:
source benchmark.config.sh && nohup ./benchmark.sh 'bulkload,fillseq,overwrite,filluniquerandom,readrandom,readwhilewriting'
where
benchmark.config.sh is:
export DB_DIR=/data/mysql/rocksdata
export WAL_DIR=/txlogs/rockswal
export OUTPUT_DIR=/root/rocks_benchmarking/output
Will fail for the tests that need a new DB .
Also 1) set disable_data_sync=0 and 2) add debug mode to run through all the tests more quickly
Test Plan: run ./benchmark.sh 'debug,bulkload,fillseq,overwrite,filluniquerandom,readrandom,readwhilewriting' and verify that there are no complaints about WAL dir not being empty.
Reviewers: sdong, yhchiang, rven, igor
Reviewed By: igor
Subscribers: dhruba
Differential Revision: https://reviews.facebook.net/D30909
10 years ago
|
|
|
Options options;
|
|
|
|
|
options.env = FLAGS_env;
|
benchmark.sh won't run through all tests properly if one specifies wal_dir to be different than db directory.
Summary:
A command line like this to run all the tests:
source benchmark.config.sh && nohup ./benchmark.sh 'bulkload,fillseq,overwrite,filluniquerandom,readrandom,readwhilewriting'
where
benchmark.config.sh is:
export DB_DIR=/data/mysql/rocksdata
export WAL_DIR=/txlogs/rockswal
export OUTPUT_DIR=/root/rocks_benchmarking/output
Will fail for the tests that need a new DB .
Also 1) set disable_data_sync=0 and 2) add debug mode to run through all the tests more quickly
Test Plan: run ./benchmark.sh 'debug,bulkload,fillseq,overwrite,filluniquerandom,readrandom,readwhilewriting' and verify that there are no complaints about WAL dir not being empty.
Reviewers: sdong, yhchiang, rven, igor
Reviewed By: igor
Subscribers: dhruba
Differential Revision: https://reviews.facebook.net/D30909
10 years ago
|
|
|
if (!FLAGS_wal_dir.empty()) {
|
|
|
|
|
options.wal_dir = FLAGS_wal_dir;
|
|
|
|
|
}
|
|
|
|
|
#ifndef ROCKSDB_LITE
|
|
|
|
|
if (use_blob_db_) {
|
|
|
|
|
// Stacked BlobDB
|
|
|
|
|
blob_db::DestroyBlobDB(FLAGS_db, options, blob_db::BlobDBOptions());
|
|
|
|
|
}
|
|
|
|
|
#endif // !ROCKSDB_LITE
|
benchmark.sh won't run through all tests properly if one specifies wal_dir to be different than db directory.
Summary:
A command line like this to run all the tests:
source benchmark.config.sh && nohup ./benchmark.sh 'bulkload,fillseq,overwrite,filluniquerandom,readrandom,readwhilewriting'
where
benchmark.config.sh is:
export DB_DIR=/data/mysql/rocksdata
export WAL_DIR=/txlogs/rockswal
export OUTPUT_DIR=/root/rocks_benchmarking/output
Will fail for the tests that need a new DB .
Also 1) set disable_data_sync=0 and 2) add debug mode to run through all the tests more quickly
Test Plan: run ./benchmark.sh 'debug,bulkload,fillseq,overwrite,filluniquerandom,readrandom,readwhilewriting' and verify that there are no complaints about WAL dir not being empty.
Reviewers: sdong, yhchiang, rven, igor
Reviewed By: igor
Subscribers: dhruba
Differential Revision: https://reviews.facebook.net/D30909
10 years ago
|
|
|
DestroyDB(FLAGS_db, options);
|
|
|
|
|
if (!FLAGS_wal_dir.empty()) {
|
|
|
|
|
FLAGS_env->DeleteDir(FLAGS_wal_dir);
|
|
|
|
|
}
|
|
|
|
|
|
|
|
|
|
if (FLAGS_num_multi_db > 1) {
|
|
|
|
|
FLAGS_env->CreateDir(FLAGS_db);
|
|
|
|
|
if (!FLAGS_wal_dir.empty()) {
|
|
|
|
|
FLAGS_env->CreateDir(FLAGS_wal_dir);
|
|
|
|
|
}
|
|
|
|
|
}
|
|
|
|
|
}
|
Auto recovery from out of space errors (#4164)
Summary:
This commit implements automatic recovery from a Status::NoSpace() error
during background operations such as write callback, flush and
compaction. The broad design is as follows -
1. Compaction errors are treated as soft errors and don't put the
database in read-only mode. A compaction is delayed until enough free
disk space is available to accomodate the compaction outputs, which is
estimated based on the input size. This means that users can continue to
write, and we rely on the WriteController to delay or stop writes if the
compaction debt becomes too high due to persistent low disk space
condition
2. Errors during write callback and flush are treated as hard errors,
i.e the database is put in read-only mode and goes back to read-write
only fater certain recovery actions are taken.
3. Both types of recovery rely on the SstFileManagerImpl to poll for
sufficient disk space. We assume that there is a 1-1 mapping between an
SFM and the underlying OS storage container. For cases where multiple
DBs are hosted on a single storage container, the user is expected to
allocate a single SFM instance and use the same one for all the DBs. If
no SFM is specified by the user, DBImpl::Open() will allocate one, but
this will be one per DB and each DB will recover independently. The
recovery implemented by SFM is as follows -
a) On the first occurance of an out of space error during compaction,
subsequent
compactions will be delayed until the disk free space check indicates
enough available space. The required space is computed as the sum of
input sizes.
b) The free space check requirement will be removed once the amount of
free space is greater than the size reserved by in progress
compactions when the first error occured
c) If the out of space error is a hard error, a background thread in
SFM will poll for sufficient headroom before triggering the recovery
of the database and putting it in write-only mode. The headroom is
calculated as the sum of the write_buffer_size of all the DB instances
associated with the SFM
4. EventListener callbacks will be called at the start and completion of
automatic recovery. Users can disable the auto recov ery in the start
callback, and later initiate it manually by calling DB::Resume()
Todo:
1. More extensive testing
2. Add disk full condition to db_stress (follow-on PR)
Pull Request resolved: https://github.com/facebook/rocksdb/pull/4164
Differential Revision: D9846378
Pulled By: anand1976
fbshipit-source-id: 80ea875dbd7f00205e19c82215ff6e37da10da4a
6 years ago
|
|
|
|
|
|
|
|
listener_.reset(new ErrorHandlerListener());
|
|
|
|
|
if (user_timestamp_size_ > 0) {
|
|
|
|
|
mock_app_clock_.reset(new TimestampEmulator());
|
|
|
|
|
}
|
|
|
|
|
}
|
|
|
|
|
|
|
|
|
|
void DeleteDBs() {
|
|
|
|
|
db_.DeleteDBs();
|
|
|
|
|
for (const DBWithColumnFamilies& dbwcf : multi_dbs_) {
|
|
|
|
|
delete dbwcf.db;
|
|
|
|
|
}
|
|
|
|
|
}
|
|
|
|
|
|
|
|
|
|
~Benchmark() {
|
|
|
|
|
DeleteDBs();
|
|
|
|
|
delete prefix_extractor_;
|
|
|
|
|
if (cache_.get() != nullptr) {
|
Use deleters to label cache entries and collect stats (#8297)
Summary:
This change gathers and publishes statistics about the
kinds of items in block cache. This is especially important for
profiling relative usage of cache by index vs. filter vs. data blocks.
It works by iterating over the cache during periodic stats dump
(InternalStats, stats_dump_period_sec) or on demand when
DB::Get(Map)Property(kBlockCacheEntryStats), except that for
efficiency and sharing among column families, saved data from
the last scan is used when the data is not considered too old.
The new information can be seen in info LOG, for example:
Block cache LRUCache@0x7fca62229330 capacity: 95.37 MB collections: 8 last_copies: 0 last_secs: 0.00178 secs_since: 0
Block cache entry stats(count,size,portion): DataBlock(7092,28.24 MB,29.6136%) FilterBlock(215,867.90 KB,0.888728%) FilterMetaBlock(2,5.31 KB,0.00544%) IndexBlock(217,180.11 KB,0.184432%) WriteBuffer(1,256.00 KB,0.262144%) Misc(1,0.00 KB,0%)
And also through DB::GetProperty and GetMapProperty (here using
ldb just for demonstration):
$ ./ldb --db=/dev/shm/dbbench/ get_property rocksdb.block-cache-entry-stats
rocksdb.block-cache-entry-stats.bytes.data-block: 0
rocksdb.block-cache-entry-stats.bytes.deprecated-filter-block: 0
rocksdb.block-cache-entry-stats.bytes.filter-block: 0
rocksdb.block-cache-entry-stats.bytes.filter-meta-block: 0
rocksdb.block-cache-entry-stats.bytes.index-block: 178992
rocksdb.block-cache-entry-stats.bytes.misc: 0
rocksdb.block-cache-entry-stats.bytes.other-block: 0
rocksdb.block-cache-entry-stats.bytes.write-buffer: 0
rocksdb.block-cache-entry-stats.capacity: 8388608
rocksdb.block-cache-entry-stats.count.data-block: 0
rocksdb.block-cache-entry-stats.count.deprecated-filter-block: 0
rocksdb.block-cache-entry-stats.count.filter-block: 0
rocksdb.block-cache-entry-stats.count.filter-meta-block: 0
rocksdb.block-cache-entry-stats.count.index-block: 215
rocksdb.block-cache-entry-stats.count.misc: 1
rocksdb.block-cache-entry-stats.count.other-block: 0
rocksdb.block-cache-entry-stats.count.write-buffer: 0
rocksdb.block-cache-entry-stats.id: LRUCache@0x7f3636661290
rocksdb.block-cache-entry-stats.percent.data-block: 0.000000
rocksdb.block-cache-entry-stats.percent.deprecated-filter-block: 0.000000
rocksdb.block-cache-entry-stats.percent.filter-block: 0.000000
rocksdb.block-cache-entry-stats.percent.filter-meta-block: 0.000000
rocksdb.block-cache-entry-stats.percent.index-block: 2.133751
rocksdb.block-cache-entry-stats.percent.misc: 0.000000
rocksdb.block-cache-entry-stats.percent.other-block: 0.000000
rocksdb.block-cache-entry-stats.percent.write-buffer: 0.000000
rocksdb.block-cache-entry-stats.secs_for_last_collection: 0.000052
rocksdb.block-cache-entry-stats.secs_since_last_collection: 0
Solution detail - We need some way to flag what kind of blocks each
entry belongs to, preferably without changing the Cache API.
One of the complications is that Cache is a general interface that could
have other users that don't adhere to whichever convention we decide
on for keys and values. Or we would pay for an extra field in the Handle
that would only be used for this purpose.
This change uses a back-door approach, the deleter, to indicate the
"role" of a Cache entry (in addition to the value type, implicitly).
This has the added benefit of ensuring proper code origin whenever we
recognize a particular role for a cache entry; if the entry came from
some other part of the code, it will use an unrecognized deleter, which
we simply attribute to the "Misc" role.
An internal API makes for simple instantiation and automatic
registration of Cache deleters for a given value type and "role".
Another internal API, CacheEntryStatsCollector, solves the problem of
caching the results of a scan and sharing them, to ensure scans are
neither excessive nor redundant so as not to harm Cache performance.
Because code is added to BlocklikeTraits, it is pulled out of
block_based_table_reader.cc into its own file.
This is a reformulation of https://github.com/facebook/rocksdb/issues/8276, without the type checking option
(could still be added), and with actual stat gathering.
Pull Request resolved: https://github.com/facebook/rocksdb/pull/8297
Test Plan: manual testing with db_bench, and a couple of basic unit tests
Reviewed By: ltamasi
Differential Revision: D28488721
Pulled By: pdillinger
fbshipit-source-id: 472f524a9691b5afb107934be2d41d84f2b129fb
3 years ago
|
|
|
// Clear cache reference first
|
|
|
|
|
open_options_.write_buffer_manager.reset();
|
|
|
|
|
// this will leak, but we're shutting down so nobody cares
|
|
|
|
|
cache_->DisownData();
|
|
|
|
|
}
|
|
|
|
|
}
|
|
|
|
|
|
|
|
|
|
Slice AllocateKey(std::unique_ptr<const char[]>* key_guard) {
|
|
|
|
|
char* data = new char[key_size_];
|
|
|
|
|
const char* const_data = data;
|
|
|
|
|
key_guard->reset(const_data);
|
|
|
|
|
return Slice(key_guard->get(), key_size_);
|
|
|
|
|
}
|
|
|
|
|
|
|
|
|
|
// Generate key according to the given specification and random number.
|
|
|
|
|
// The resulting key will have the following format:
|
|
|
|
|
// - If keys_per_prefix_ is positive, extra trailing bytes are either cut
|
|
|
|
|
// off or padded with '0'.
|
|
|
|
|
// The prefix value is derived from key value.
|
|
|
|
|
// ----------------------------
|
|
|
|
|
// | prefix 00000 | key 00000 |
|
|
|
|
|
// ----------------------------
|
|
|
|
|
//
|
|
|
|
|
// - If keys_per_prefix_ is 0, the key is simply a binary representation of
|
|
|
|
|
// random number followed by trailing '0's
|
|
|
|
|
// ----------------------------
|
|
|
|
|
// | key 00000 |
|
|
|
|
|
// ----------------------------
|
|
|
|
|
void GenerateKeyFromInt(uint64_t v, int64_t num_keys, Slice* key) {
|
|
|
|
|
if (!keys_.empty()) {
|
|
|
|
|
assert(FLAGS_use_existing_keys);
|
|
|
|
|
assert(keys_.size() == static_cast<size_t>(num_keys));
|
|
|
|
|
assert(v < static_cast<uint64_t>(num_keys));
|
|
|
|
|
*key = keys_[v];
|
|
|
|
|
return;
|
|
|
|
|
}
|
|
|
|
|
char* start = const_cast<char*>(key->data());
|
|
|
|
|
char* pos = start;
|
|
|
|
|
if (keys_per_prefix_ > 0) {
|
|
|
|
|
int64_t num_prefix = num_keys / keys_per_prefix_;
|
|
|
|
|
int64_t prefix = v % num_prefix;
|
|
|
|
|
int bytes_to_fill = std::min(prefix_size_, 8);
|
|
|
|
|
if (port::kLittleEndian) {
|
|
|
|
|
for (int i = 0; i < bytes_to_fill; ++i) {
|
|
|
|
|
pos[i] = (prefix >> ((bytes_to_fill - i - 1) << 3)) & 0xFF;
|
|
|
|
|
}
|
|
|
|
|
} else {
|
|
|
|
|
memcpy(pos, static_cast<void*>(&prefix), bytes_to_fill);
|
|
|
|
|
}
|
|
|
|
|
if (prefix_size_ > 8) {
|
|
|
|
|
// fill the rest with 0s
|
|
|
|
|
memset(pos + 8, '0', prefix_size_ - 8);
|
|
|
|
|
}
|
|
|
|
|
pos += prefix_size_;
|
|
|
|
|
}
|
|
|
|
|
|
|
|
|
|
int bytes_to_fill = std::min(key_size_ - static_cast<int>(pos - start), 8);
|
|
|
|
|
if (port::kLittleEndian) {
|
|
|
|
|
for (int i = 0; i < bytes_to_fill; ++i) {
|
|
|
|
|
pos[i] = (v >> ((bytes_to_fill - i - 1) << 3)) & 0xFF;
|
|
|
|
|
}
|
|
|
|
|
} else {
|
|
|
|
|
memcpy(pos, static_cast<void*>(&v), bytes_to_fill);
|
|
|
|
|
}
|
|
|
|
|
pos += bytes_to_fill;
|
|
|
|
|
if (key_size_ > pos - start) {
|
|
|
|
|
memset(pos, '0', key_size_ - (pos - start));
|
|
|
|
|
}
|
|
|
|
|
}
|
|
|
|
|
|
|
|
|
|
void GenerateKeyFromIntForSeek(uint64_t v, int64_t num_keys, Slice* key) {
|
|
|
|
|
GenerateKeyFromInt(v, num_keys, key);
|
|
|
|
|
if (FLAGS_seek_missing_prefix) {
|
|
|
|
|
assert(prefix_size_ > 8);
|
|
|
|
|
char* key_ptr = const_cast<char*>(key->data());
|
|
|
|
|
// This rely on GenerateKeyFromInt filling paddings with '0's.
|
|
|
|
|
// Putting a '1' will create a non-existing prefix.
|
|
|
|
|
key_ptr[8] = '1';
|
|
|
|
|
}
|
|
|
|
|
}
|
|
|
|
|
|
|
|
|
|
std::string GetPathForMultiple(std::string base_name, size_t id) {
|
|
|
|
|
if (!base_name.empty()) {
|
|
|
|
|
#ifndef OS_WIN
|
|
|
|
|
if (base_name.back() != '/') {
|
|
|
|
|
base_name += '/';
|
|
|
|
|
}
|
|
|
|
|
#else
|
|
|
|
|
if (base_name.back() != '\\') {
|
|
|
|
|
base_name += '\\';
|
|
|
|
|
}
|
|
|
|
|
#endif
|
|
|
|
|
}
|
|
|
|
|
return base_name + ToString(id);
|
|
|
|
|
}
|
|
|
|
|
|
|
|
|
|
void VerifyDBFromDB(std::string& truth_db_name) {
|
|
|
|
|
DBWithColumnFamilies truth_db;
|
|
|
|
|
auto s = DB::OpenForReadOnly(open_options_, truth_db_name, &truth_db.db);
|
|
|
|
|
if (!s.ok()) {
|
|
|
|
|
fprintf(stderr, "open error: %s\n", s.ToString().c_str());
|
|
|
|
|
exit(1);
|
|
|
|
|
}
|
|
|
|
|
ReadOptions ro;
|
|
|
|
|
ro.total_order_seek = true;
|
|
|
|
|
std::unique_ptr<Iterator> truth_iter(truth_db.db->NewIterator(ro));
|
|
|
|
|
std::unique_ptr<Iterator> db_iter(db_.db->NewIterator(ro));
|
|
|
|
|
// Verify that all the key/values in truth_db are retrivable in db with
|
|
|
|
|
// ::Get
|
|
|
|
|
fprintf(stderr, "Verifying db >= truth_db with ::Get...\n");
|
|
|
|
|
for (truth_iter->SeekToFirst(); truth_iter->Valid(); truth_iter->Next()) {
|
|
|
|
|
std::string value;
|
|
|
|
|
s = db_.db->Get(ro, truth_iter->key(), &value);
|
|
|
|
|
assert(s.ok());
|
|
|
|
|
// TODO(myabandeh): provide debugging hints
|
|
|
|
|
assert(Slice(value) == truth_iter->value());
|
|
|
|
|
}
|
|
|
|
|
// Verify that the db iterator does not give any extra key/value
|
|
|
|
|
fprintf(stderr, "Verifying db == truth_db...\n");
|
|
|
|
|
for (db_iter->SeekToFirst(), truth_iter->SeekToFirst(); db_iter->Valid();
|
|
|
|
|
db_iter->Next(), truth_iter->Next()) {
|
|
|
|
|
assert(truth_iter->Valid());
|
|
|
|
|
assert(truth_iter->value() == db_iter->value());
|
|
|
|
|
}
|
|
|
|
|
// No more key should be left unchecked in truth_db
|
|
|
|
|
assert(!truth_iter->Valid());
|
|
|
|
|
fprintf(stderr, "...Verified\n");
|
|
|
|
|
}
|
|
|
|
|
|
|
|
|
|
void ErrorExit() {
|
|
|
|
|
DeleteDBs();
|
|
|
|
|
exit(1);
|
|
|
|
|
}
|
|
|
|
|
|
|
|
|
|
void Run() {
|
|
|
|
|
if (!SanityCheck()) {
|
|
|
|
|
ErrorExit();
|
|
|
|
|
}
|
|
|
|
|
Open(&open_options_);
|
|
|
|
|
PrintHeader(open_options_);
|
|
|
|
|
std::stringstream benchmark_stream(FLAGS_benchmarks);
|
|
|
|
|
std::string name;
|
|
|
|
|
std::unique_ptr<ExpiredTimeFilter> filter;
|
|
|
|
|
while (std::getline(benchmark_stream, name, ',')) {
|
|
|
|
|
// Sanitize parameters
|
|
|
|
|
num_ = FLAGS_num;
|
|
|
|
|
reads_ = (FLAGS_reads < 0 ? FLAGS_num : FLAGS_reads);
|
|
|
|
|
writes_ = (FLAGS_writes < 0 ? FLAGS_num : FLAGS_writes);
|
|
|
|
|
deletes_ = (FLAGS_deletes < 0 ? FLAGS_num : FLAGS_deletes);
|
|
|
|
|
value_size = FLAGS_value_size;
|
|
|
|
|
key_size_ = FLAGS_key_size;
|
|
|
|
|
entries_per_batch_ = FLAGS_batch_size;
|
|
|
|
|
writes_before_delete_range_ = FLAGS_writes_before_delete_range;
|
|
|
|
|
writes_per_range_tombstone_ = FLAGS_writes_per_range_tombstone;
|
|
|
|
|
range_tombstone_width_ = FLAGS_range_tombstone_width;
|
|
|
|
|
max_num_range_tombstones_ = FLAGS_max_num_range_tombstones;
|
|
|
|
|
write_options_ = WriteOptions();
|
|
|
|
|
read_random_exp_range_ = FLAGS_read_random_exp_range;
|
|
|
|
|
if (FLAGS_sync) {
|
|
|
|
|
write_options_.sync = true;
|
|
|
|
|
}
|
|
|
|
|
write_options_.disableWAL = FLAGS_disable_wal;
|
Rate-limit automatic WAL flush after each user write (#9607)
Summary:
**Context:**
WAL flush is currently not rate-limited by `Options::rate_limiter`. This PR is to provide rate-limiting to auto WAL flush, the one that automatically happen after each user write operation (i.e, `Options::manual_wal_flush == false`), by adding `WriteOptions::rate_limiter_options`.
Note that we are NOT rate-limiting WAL flush that do NOT automatically happen after each user write, such as `Options::manual_wal_flush == true + manual FlushWAL()` (rate-limiting multiple WAL flushes), for the benefits of:
- being consistent with [ReadOptions::rate_limiter_priority](https://github.com/facebook/rocksdb/blob/7.0.fb/include/rocksdb/options.h#L515)
- being able to turn off some WAL flush's rate-limiting but not all (e.g, turn off specific the WAL flush of a critical user write like a service's heartbeat)
`WriteOptions::rate_limiter_options` only accept `Env::IO_USER` and `Env::IO_TOTAL` currently due to an implementation constraint.
- The constraint is that we currently queue parallel writes (including WAL writes) based on FIFO policy which does not factor rate limiter priority into this layer's scheduling. If we allow lower priorities such as `Env::IO_HIGH/MID/LOW` and such writes specified with lower priorities occurs before ones specified with higher priorities (even just by a tiny bit in arrival time), the former would have blocked the latter, leading to a "priority inversion" issue and contradictory to what we promise for rate-limiting priority. Therefore we only allow `Env::IO_USER` and `Env::IO_TOTAL` right now before improving that scheduling.
A pre-requisite to this feature is to support operation-level rate limiting in `WritableFileWriter`, which is also included in this PR.
**Summary:**
- Renamed test suite `DBRateLimiterTest to DBRateLimiterOnReadTest` for adding a new test suite
- Accept `rate_limiter_priority` in `WritableFileWriter`'s private and public write functions
- Passed `WriteOptions::rate_limiter_options` to `WritableFileWriter` in the path of automatic WAL flush.
Pull Request resolved: https://github.com/facebook/rocksdb/pull/9607
Test Plan:
- Added new unit test to verify existing flush/compaction rate-limiting does not break, since `DBTest, RateLimitingTest` is disabled and current db-level rate-limiting tests focus on read only (e.g, `db_rate_limiter_test`, `DBTest2, RateLimitedCompactionReads`).
- Added new unit test `DBRateLimiterOnWriteWALTest, AutoWalFlush`
- `strace -ftt -e trace=write ./db_bench -benchmarks=fillseq -db=/dev/shm/testdb -rate_limit_auto_wal_flush=1 -rate_limiter_bytes_per_sec=15 -rate_limiter_refill_period_us=1000000 -write_buffer_size=100000000 -disable_auto_compactions=1 -num=100`
- verified that WAL flush(i.e, system-call _write_) were chunked into 15 bytes and each _write_ was roughly 1 second apart
- verified the chunking disappeared when `-rate_limit_auto_wal_flush=0`
- crash test: `python3 tools/db_crashtest.py blackbox --disable_wal=0 --rate_limit_auto_wal_flush=1 --rate_limiter_bytes_per_sec=10485760 --interval=10` killed as normal
**Benchmarked on flush/compaction to ensure no performance regression:**
- compaction with rate-limiting (see table 1, avg over 1280-run): pre-change: **915635 micros/op**; post-change:
**907350 micros/op (improved by 0.106%)**
```
#!/bin/bash
TEST_TMPDIR=/dev/shm/testdb
START=1
NUM_DATA_ENTRY=8
N=10
rm -f compact_bmk_output.txt compact_bmk_output_2.txt dont_care_output.txt
for i in $(eval echo "{$START..$NUM_DATA_ENTRY}")
do
NUM_RUN=$(($N*(2**($i-1))))
for j in $(eval echo "{$START..$NUM_RUN}")
do
./db_bench --benchmarks=fillrandom -db=$TEST_TMPDIR -disable_auto_compactions=1 -write_buffer_size=6710886 > dont_care_output.txt && ./db_bench --benchmarks=compact -use_existing_db=1 -db=$TEST_TMPDIR -level0_file_num_compaction_trigger=1 -rate_limiter_bytes_per_sec=100000000 | egrep 'compact'
done > compact_bmk_output.txt && awk -v NUM_RUN=$NUM_RUN '{sum+=$3;sum_sqrt+=$3^2}END{print sum/NUM_RUN, sqrt(sum_sqrt/NUM_RUN-(sum/NUM_RUN)^2)}' compact_bmk_output.txt >> compact_bmk_output_2.txt
done
```
- compaction w/o rate-limiting (see table 2, avg over 640-run): pre-change: **822197 micros/op**; post-change: **823148 micros/op (regressed by 0.12%)**
```
Same as above script, except that -rate_limiter_bytes_per_sec=0
```
- flush with rate-limiting (see table 3, avg over 320-run, run on the [patch](https://github.com/hx235/rocksdb/commit/ee5c6023a9f6533fab9afdc681568daa21da4953) to augment current db_bench ): pre-change: **745752 micros/op**; post-change: **745331 micros/op (regressed by 0.06 %)**
```
#!/bin/bash
TEST_TMPDIR=/dev/shm/testdb
START=1
NUM_DATA_ENTRY=8
N=10
rm -f flush_bmk_output.txt flush_bmk_output_2.txt
for i in $(eval echo "{$START..$NUM_DATA_ENTRY}")
do
NUM_RUN=$(($N*(2**($i-1))))
for j in $(eval echo "{$START..$NUM_RUN}")
do
./db_bench -db=$TEST_TMPDIR -write_buffer_size=1048576000 -num=1000000 -rate_limiter_bytes_per_sec=100000000 -benchmarks=fillseq,flush | egrep 'flush'
done > flush_bmk_output.txt && awk -v NUM_RUN=$NUM_RUN '{sum+=$3;sum_sqrt+=$3^2}END{print sum/NUM_RUN, sqrt(sum_sqrt/NUM_RUN-(sum/NUM_RUN)^2)}' flush_bmk_output.txt >> flush_bmk_output_2.txt
done
```
- flush w/o rate-limiting (see table 4, avg over 320-run, run on the [patch](https://github.com/hx235/rocksdb/commit/ee5c6023a9f6533fab9afdc681568daa21da4953) to augment current db_bench): pre-change: **487512 micros/op**, post-change: **485856 micors/ops (improved by 0.34%)**
```
Same as above script, except that -rate_limiter_bytes_per_sec=0
```
| table 1 - compact with rate-limiting|
#-run | (pre-change) avg micros/op | std micros/op | (post-change) avg micros/op | std micros/op | change in avg micros/op (%)
-- | -- | -- | -- | -- | --
10 | 896978 | 16046.9 | 901242 | 15670.9 | 0.475373978
20 | 893718 | 15813 | 886505 | 17544.7 | -0.8070778478
40 | 900426 | 23882.2 | 894958 | 15104.5 | -0.6072681153
80 | 906635 | 21761.5 | 903332 | 23948.3 | -0.3643141948
160 | 898632 | 21098.9 | 907583 | 21145 | 0.9960695813
3.20E+02 | 905252 | 22785.5 | 908106 | 25325.5 | 0.3152713278
6.40E+02 | 905213 | 23598.6 | 906741 | 21370.5 | 0.1688000504
**1.28E+03** | **908316** | **23533.1** | **907350** | **24626.8** | **-0.1063506533**
average over #-run | 901896.25 | 21064.9625 | 901977.125 | 20592.025 | 0.008967217682
| table 2 - compact w/o rate-limiting|
#-run | (pre-change) avg micros/op | std micros/op | (post-change) avg micros/op | std micros/op | change in avg micros/op (%)
-- | -- | -- | -- | -- | --
10 | 811211 | 26996.7 | 807586 | 28456.4 | -0.4468627768
20 | 815465 | 14803.7 | 814608 | 28719.7 | -0.105093413
40 | 809203 | 26187.1 | 797835 | 25492.1 | -1.404839082
80 | 822088 | 28765.3 | 822192 | 32840.4 | 0.01265071379
160 | 821719 | 36344.7 | 821664 | 29544.9 | -0.006693285661
3.20E+02 | 820921 | 27756.4 | 821403 | 28347.7 | 0.05871454135
**6.40E+02** | **822197** | **28960.6** | **823148** | **30055.1** | **0.1156657103**
average over #-run | 8.18E+05 | 2.71E+04 | 8.15E+05 | 2.91E+04 | -0.25
| table 3 - flush with rate-limiting|
#-run | (pre-change) avg micros/op | std micros/op | (post-change) avg micros/op | std micros/op | change in avg micros/op (%)
-- | -- | -- | -- | -- | --
10 | 741721 | 11770.8 | 740345 | 5949.76 | -0.1855144994
20 | 735169 | 3561.83 | 743199 | 9755.77 | 1.09226586
40 | 743368 | 8891.03 | 742102 | 8683.22 | -0.1703059588
80 | 742129 | 8148.51 | 743417 | 9631.58| 0.1735547324
160 | 749045 | 9757.21 | 746256 | 9191.86 | -0.3723407806
**3.20E+02** | **745752** | **9819.65** | **745331** | **9840.62** | **-0.0564530836**
6.40E+02 | 749006 | 11080.5 | 748173 | 10578.7 | -0.1112140624
average over #-run | 743741.4286 | 9004.218571 | 744117.5714 | 9090.215714 | 0.05057441238
| table 4 - flush w/o rate-limiting|
#-run | (pre-change) avg micros/op | std micros/op | (post-change) avg micros/op | std micros/op | change in avg micros/op (%)
-- | -- | -- | -- | -- | --
10 | 477283 | 24719.6 | 473864 | 12379 | -0.7163464863
20 | 486743 | 20175.2 | 502296 | 23931.3 | 3.195320734
40 | 482846 | 15309.2 | 489820 | 22259.5 | 1.444352858
80 | 491490 | 21883.1 | 490071 | 23085.7 | -0.2887139108
160 | 493347 | 28074.3 | 483609 | 21211.7 | -1.973864238
**3.20E+02** | **487512** | **21401.5** | **485856** | **22195.2** | **-0.3396839462**
6.40E+02 | 490307 | 25418.6 | 485435 | 22405.2 | -0.9936631539
average over #-run | 4.87E+05 | 2.24E+04 | 4.87E+05 | 2.11E+04 | 0.00E+00
Reviewed By: ajkr
Differential Revision: D34442441
Pulled By: hx235
fbshipit-source-id: 4790f13e1e5c0a95ae1d1cc93ffcf69dc6e78bdd
2 years ago
|
|
|
write_options_.rate_limiter_priority =
|
|
|
|
|
FLAGS_rate_limit_auto_wal_flush ? Env::IO_USER : Env::IO_TOTAL;
|
|
|
|
|
read_options_ = ReadOptions(FLAGS_verify_checksum, true);
|
|
|
|
|
read_options_.total_order_seek = FLAGS_total_order_seek;
|
|
|
|
|
read_options_.prefix_same_as_start = FLAGS_prefix_same_as_start;
|
|
|
|
|
read_options_.rate_limiter_priority =
|
|
|
|
|
FLAGS_rate_limit_user_ops ? Env::IO_USER : Env::IO_TOTAL;
|
|
|
|
|
read_options_.tailing = FLAGS_use_tailing_iterator;
|
|
|
|
|
read_options_.readahead_size = FLAGS_readahead_size;
|
|
|
|
|
read_options_.adaptive_readahead = FLAGS_adaptive_readahead;
|
|
|
|
|
read_options_.async_io = FLAGS_async_io;
|
|
|
|
|
|
|
|
|
|
void (Benchmark::*method)(ThreadState*) = nullptr;
|
|
|
|
|
void (Benchmark::*post_process_method)() = nullptr;
|
|
|
|
|
|
|
|
|
|
bool fresh_db = false;
|
|
|
|
|
int num_threads = FLAGS_threads;
|
|
|
|
|
|
|
|
|
|
int num_repeat = 1;
|
|
|
|
|
int num_warmup = 0;
|
|
|
|
|
if (!name.empty() && *name.rbegin() == ']') {
|
|
|
|
|
auto it = name.find('[');
|
|
|
|
|
if (it == std::string::npos) {
|
|
|
|
|
fprintf(stderr, "unknown benchmark arguments '%s'\n", name.c_str());
|
|
|
|
|
ErrorExit();
|
|
|
|
|
}
|
|
|
|
|
std::string args = name.substr(it + 1);
|
|
|
|
|
args.resize(args.size() - 1);
|
|
|
|
|
name.resize(it);
|
|
|
|
|
|
|
|
|
|
std::string bench_arg;
|
|
|
|
|
std::stringstream args_stream(args);
|
|
|
|
|
while (std::getline(args_stream, bench_arg, '-')) {
|
|
|
|
|
if (bench_arg.empty()) {
|
|
|
|
|
continue;
|
|
|
|
|
}
|
|
|
|
|
if (bench_arg[0] == 'X') {
|
|
|
|
|
// Repeat the benchmark n times
|
|
|
|
|
std::string num_str = bench_arg.substr(1);
|
|
|
|
|
num_repeat = std::stoi(num_str);
|
|
|
|
|
} else if (bench_arg[0] == 'W') {
|
|
|
|
|
// Warm up the benchmark for n times
|
|
|
|
|
std::string num_str = bench_arg.substr(1);
|
|
|
|
|
num_warmup = std::stoi(num_str);
|
|
|
|
|
}
|
|
|
|
|
}
|
|
|
|
|
}
|
|
|
|
|
|
|
|
|
|
// Both fillseqdeterministic and filluniquerandomdeterministic
|
|
|
|
|
// fill the levels except the max level with UNIQUE_RANDOM
|
|
|
|
|
// and fill the max level with fillseq and filluniquerandom, respectively
|
|
|
|
|
if (name == "fillseqdeterministic" ||
|
|
|
|
|
name == "filluniquerandomdeterministic") {
|
|
|
|
|
if (!FLAGS_disable_auto_compactions) {
|
|
|
|
|
fprintf(stderr,
|
|
|
|
|
"Please disable_auto_compactions in FillDeterministic "
|
|
|
|
|
"benchmark\n");
|
|
|
|
|
ErrorExit();
|
|
|
|
|
}
|
|
|
|
|
if (num_threads > 1) {
|
|
|
|
|
fprintf(stderr,
|
|
|
|
|
"filldeterministic multithreaded not supported"
|
|
|
|
|
", use 1 thread\n");
|
|
|
|
|
num_threads = 1;
|
|
|
|
|
}
|
|
|
|
|
fresh_db = true;
|
|
|
|
|
if (name == "fillseqdeterministic") {
|
|
|
|
|
method = &Benchmark::WriteSeqDeterministic;
|
|
|
|
|
} else {
|
|
|
|
|
method = &Benchmark::WriteUniqueRandomDeterministic;
|
|
|
|
|
}
|
|
|
|
|
} else if (name == "fillseq") {
|
|
|
|
|
fresh_db = true;
|
|
|
|
|
method = &Benchmark::WriteSeq;
|
|
|
|
|
} else if (name == "fillbatch") {
|
|
|
|
|
fresh_db = true;
|
|
|
|
|
entries_per_batch_ = 1000;
|
|
|
|
|
method = &Benchmark::WriteSeq;
|
|
|
|
|
} else if (name == "fillrandom") {
|
|
|
|
|
fresh_db = true;
|
|
|
|
|
method = &Benchmark::WriteRandom;
|
|
|
|
|
} else if (name == "filluniquerandom" ||
|
|
|
|
|
name == "fillanddeleteuniquerandom") {
|
|
|
|
|
fresh_db = true;
|
|
|
|
|
if (num_threads > 1) {
|
|
|
|
|
fprintf(stderr,
|
|
|
|
|
"filluniquerandom and fillanddeleteuniquerandom "
|
|
|
|
|
"multithreaded not supported, use 1 thread");
|
|
|
|
|
num_threads = 1;
|
|
|
|
|
}
|
|
|
|
|
method = &Benchmark::WriteUniqueRandom;
|
|
|
|
|
} else if (name == "overwrite") {
|
|
|
|
|
method = &Benchmark::WriteRandom;
|
|
|
|
|
} else if (name == "fillsync") {
|
|
|
|
|
fresh_db = true;
|
|
|
|
|
num_ /= 1000;
|
|
|
|
|
write_options_.sync = true;
|
|
|
|
|
method = &Benchmark::WriteRandom;
|
|
|
|
|
} else if (name == "fill100K") {
|
|
|
|
|
fresh_db = true;
|
|
|
|
|
num_ /= 1000;
|
|
|
|
|
value_size = 100 * 1000;
|
|
|
|
|
method = &Benchmark::WriteRandom;
|
|
|
|
|
} else if (name == "readseq") {
|
|
|
|
|
method = &Benchmark::ReadSequential;
|
|
|
|
|
} else if (name == "readtorowcache") {
|
|
|
|
|
if (!FLAGS_use_existing_keys || !FLAGS_row_cache_size) {
|
|
|
|
|
fprintf(stderr,
|
|
|
|
|
"Please set use_existing_keys to true and specify a "
|
|
|
|
|
"row cache size in readtorowcache benchmark\n");
|
|
|
|
|
ErrorExit();
|
|
|
|
|
}
|
|
|
|
|
method = &Benchmark::ReadToRowCache;
|
|
|
|
|
} else if (name == "readtocache") {
|
|
|
|
|
method = &Benchmark::ReadSequential;
|
|
|
|
|
num_threads = 1;
|
|
|
|
|
reads_ = num_;
|
|
|
|
|
} else if (name == "readreverse") {
|
|
|
|
|
method = &Benchmark::ReadReverse;
|
|
|
|
|
} else if (name == "readrandom") {
|
Introduce a new MultiGet batching implementation (#5011)
Summary:
This PR introduces a new MultiGet() API, with the underlying implementation grouping keys based on SST file and batching lookups in a file. The reason for the new API is twofold - the definition allows callers to allocate storage for status and values on stack instead of std::vector, as well as return values as PinnableSlices in order to avoid copying, and it keeps the original MultiGet() implementation intact while we experiment with batching.
Batching is useful when there is some spatial locality to the keys being queries, as well as larger batch sizes. The main benefits are due to -
1. Fewer function calls, especially to BlockBasedTableReader::MultiGet() and FullFilterBlockReader::KeysMayMatch()
2. Bloom filter cachelines can be prefetched, hiding the cache miss latency
The next step is to optimize the binary searches in the level_storage_info, index blocks and data blocks, since we could reduce the number of key comparisons if the keys are relatively close to each other. The batching optimizations also need to be extended to other formats, such as PlainTable and filter formats. This also needs to be added to db_stress.
Benchmark results from db_bench for various batch size/locality of reference combinations are given below. Locality was simulated by offsetting the keys in a batch by a stride length. Each SST file is about 8.6MB uncompressed and key/value size is 16/100 uncompressed. To focus on the cpu benefit of batching, the runs were single threaded and bound to the same cpu to eliminate interference from other system events. The results show a 10-25% improvement in micros/op from smaller to larger batch sizes (4 - 32).
Batch Sizes
1 | 2 | 4 | 8 | 16 | 32
Random pattern (Stride length 0)
4.158 | 4.109 | 4.026 | 4.05 | 4.1 | 4.074 - Get
4.438 | 4.302 | 4.165 | 4.122 | 4.096 | 4.075 - MultiGet (no batching)
4.461 | 4.256 | 4.277 | 4.11 | 4.182 | 4.14 - MultiGet (w/ batching)
Good locality (Stride length 16)
4.048 | 3.659 | 3.248 | 2.99 | 2.84 | 2.753
4.429 | 3.728 | 3.406 | 3.053 | 2.911 | 2.781
4.452 | 3.45 | 2.833 | 2.451 | 2.233 | 2.135
Good locality (Stride length 256)
4.066 | 3.786 | 3.581 | 3.447 | 3.415 | 3.232
4.406 | 4.005 | 3.644 | 3.49 | 3.381 | 3.268
4.393 | 3.649 | 3.186 | 2.882 | 2.676 | 2.62
Medium locality (Stride length 4096)
4.012 | 3.922 | 3.768 | 3.61 | 3.582 | 3.555
4.364 | 4.057 | 3.791 | 3.65 | 3.57 | 3.465
4.479 | 3.758 | 3.316 | 3.077 | 2.959 | 2.891
dbbench command used (on a DB with 4 levels, 12 million keys)-
TEST_TMPDIR=/dev/shm numactl -C 10 ./db_bench.tmp -use_existing_db=true -benchmarks="readseq,multireadrandom" -write_buffer_size=4194304 -target_file_size_base=4194304 -max_bytes_for_level_base=16777216 -num=12000000 -reads=12000000 -duration=90 -threads=1 -compression_type=none -cache_size=4194304000 -batch_size=32 -disable_auto_compactions=true -bloom_bits=10 -cache_index_and_filter_blocks=true -pin_l0_filter_and_index_blocks_in_cache=true -multiread_batched=true -multiread_stride=4
Pull Request resolved: https://github.com/facebook/rocksdb/pull/5011
Differential Revision: D14348703
Pulled By: anand1976
fbshipit-source-id: 774406dab3776d979c809522a67bedac6c17f84b
5 years ago
|
|
|
if (FLAGS_multiread_stride) {
|
|
|
|
|
fprintf(stderr, "entries_per_batch = %" PRIi64 "\n",
|
|
|
|
|
entries_per_batch_);
|
|
|
|
|
}
|
|
|
|
|
method = &Benchmark::ReadRandom;
|
|
|
|
|
} else if (name == "readrandomfast") {
|
|
|
|
|
method = &Benchmark::ReadRandomFast;
|
|
|
|
|
} else if (name == "multireadrandom") {
|
|
|
|
|
fprintf(stderr, "entries_per_batch = %" PRIi64 "\n",
|
|
|
|
|
entries_per_batch_);
|
|
|
|
|
method = &Benchmark::MultiReadRandom;
|
For ApproximateSizes, pro-rate table metadata size over data blocks (#6784)
Summary:
The implementation of GetApproximateSizes was inconsistent in
its treatment of the size of non-data blocks of SST files, sometimes
including and sometimes now. This was at its worst with large portion
of table file used by filters and querying a small range that crossed
a table boundary: the size estimate would include large filter size.
It's conceivable that someone might want only to know the size in terms
of data blocks, but I believe that's unlikely enough to ignore for now.
Similarly, there's no evidence the internal function AppoximateOffsetOf
is used for anything other than a one-sided ApproximateSize, so I intend
to refactor to remove redundancy in a follow-up commit.
So to fix this, GetApproximateSizes (and implementation details
ApproximateSize and ApproximateOffsetOf) now consistently include in
their returned sizes a portion of table file metadata (incl filters
and indexes) based on the size portion of the data blocks in range. In
other words, if a key range covers data blocks that are X% by size of all
the table's data blocks, returned approximate size is X% of the total
file size. It would technically be more accurate to attribute metadata
based on number of keys, but that's not computationally efficient with
data available and rarely a meaningful difference.
Also includes miscellaneous comment improvements / clarifications.
Also included is a new approximatesizerandom benchmark for db_bench.
No significant performance difference seen with this change, whether ~700 ops/sec with cache_index_and_filter_blocks and small cache or ~150k ops/sec without cache_index_and_filter_blocks.
Pull Request resolved: https://github.com/facebook/rocksdb/pull/6784
Test Plan:
Test added to DBTest.ApproximateSizesFilesWithErrorMargin.
Old code running new test...
[ RUN ] DBTest.ApproximateSizesFilesWithErrorMargin
db/db_test.cc:1562: Failure
Expected: (size) <= (11 * 100), actual: 9478 vs 1100
Other tests updated to reflect consistent accounting of metadata.
Reviewed By: siying
Differential Revision: D21334706
Pulled By: pdillinger
fbshipit-source-id: 6f86870e45213334fedbe9c73b4ebb1d8d611185
4 years ago
|
|
|
} else if (name == "approximatesizerandom") {
|
|
|
|
|
fprintf(stderr, "entries_per_batch = %" PRIi64 "\n",
|
|
|
|
|
entries_per_batch_);
|
|
|
|
|
method = &Benchmark::ApproximateSizeRandom;
|
Generate mixed workload with Get, Put, Seek in db_bench (#4788)
Summary:
Based on the specific workload models (key access distribution, value size distribution, and iterator scan length distribution, the QPS variation), the MixGraph benchmark generate the synthetic workload according to these distributions which can reflect the real-world workload characteristics.
After user enable the tracing function, they will get the trace file. By analyzing the trace file with the trace_analyzer tool, user can generate a set of statistic data files including. The *_accessed_key_stats.txt, *-accessed_value_size_distribution.txt, *-iterator_length_distribution.txt, and *-qps_stats.txt are mainly used to fit the Matlab model fitting. After that, user can get the parameters of the workload distributions (the modeling details are described: [here](https://github.com/facebook/rocksdb/wiki/RocksDB-Trace%2C-Replay%2C-and-Analyzer))
The key access distribution follows the The two-term power model. The probability density function is: `f(x) = ax^{b}+c`. The corresponding parameters are key_dist_a, key_dist_b, and key_dist_c in db_bench
For the value size distribution and iterator scan length distribution, they both follow the Generalized Pareto Distribution. The probability density function is `f(x) = (1/sigma)(1+k*(x-theta)/sigma))^{-1-1/k)`. The parameters are: value_k, value_theta, value_sigma and iter_k, iter_theta, iter_sigma. For more information about the Generalized Pareto Distribution, users can find the [wiki](https://en.wikipedia.org/wiki/Generalized_Pareto_distribution) and [Matalb page](https://www.mathworks.com/help/stats/generalized-pareto-distribution.html)
As for the QPS, it follows the diurnal pattern. So Sine is a good model to fit it. `F(x) = sine_a*sin(sine_b*x + sine_c) + sine_d`. The trace_will tell you the average QPS in the print out resutls, which is sine_d. After user fit the "*-qps_stats.txt" to the Matlab model, user can get the sine_a, sine_b, and sine_c. By using the 4 parameters, user can control the QPS variation including the period, average, changes.
To use the bench mark, user can indicate the following parameters as examples:
```
-benchmarks="mixgraph" -key_dist_a=0.002312 -key_dist_b=0.3467 -value_k=0.9233 -value_sigma=226.4092 -iter_k=2.517 -iter_sigma=14.236 -mix_get_ratio=0.7 -mix_put_ratio=0.25 -mix_seek_ratio=0.05 -sine_mix_rate_interval_milliseconds=500 -sine_a=15000 -sine_b=1 -sine_d=20000
```
Pull Request resolved: https://github.com/facebook/rocksdb/pull/4788
Differential Revision: D13573940
Pulled By: sagar0
fbshipit-source-id: e184c27e07b4f1bc0b436c2be36c5090c1fb0222
6 years ago
|
|
|
} else if (name == "mixgraph") {
|
|
|
|
|
method = &Benchmark::MixGraph;
|
|
|
|
|
} else if (name == "readmissing") {
|
|
|
|
|
++key_size_;
|
|
|
|
|
method = &Benchmark::ReadRandom;
|
|
|
|
|
} else if (name == "newiterator") {
|
|
|
|
|
method = &Benchmark::IteratorCreation;
|
|
|
|
|
} else if (name == "newiteratorwhilewriting") {
|
|
|
|
|
num_threads++; // Add extra thread for writing
|
|
|
|
|
method = &Benchmark::IteratorCreationWhileWriting;
|
|
|
|
|
} else if (name == "seekrandom") {
|
|
|
|
|
method = &Benchmark::SeekRandom;
|
|
|
|
|
} else if (name == "seekrandomwhilewriting") {
|
|
|
|
|
num_threads++; // Add extra thread for writing
|
|
|
|
|
method = &Benchmark::SeekRandomWhileWriting;
|
|
|
|
|
} else if (name == "seekrandomwhilemerging") {
|
|
|
|
|
num_threads++; // Add extra thread for merging
|
|
|
|
|
method = &Benchmark::SeekRandomWhileMerging;
|
|
|
|
|
} else if (name == "readrandomsmall") {
|
|
|
|
|
reads_ /= 1000;
|
|
|
|
|
method = &Benchmark::ReadRandom;
|
|
|
|
|
} else if (name == "deleteseq") {
|
|
|
|
|
method = &Benchmark::DeleteSeq;
|
|
|
|
|
} else if (name == "deleterandom") {
|
|
|
|
|
method = &Benchmark::DeleteRandom;
|
|
|
|
|
} else if (name == "readwhilewriting") {
|
|
|
|
|
num_threads++; // Add extra thread for writing
|
|
|
|
|
method = &Benchmark::ReadWhileWriting;
|
|
|
|
|
} else if (name == "readwhilemerging") {
|
|
|
|
|
num_threads++; // Add extra thread for writing
|
|
|
|
|
method = &Benchmark::ReadWhileMerging;
|
|
|
|
|
} else if (name == "readwhilescanning") {
|
|
|
|
|
num_threads++; // Add extra thread for scaning
|
|
|
|
|
method = &Benchmark::ReadWhileScanning;
|
|
|
|
|
} else if (name == "readrandomwriterandom") {
|
|
|
|
|
method = &Benchmark::ReadRandomWriteRandom;
|
|
|
|
|
} else if (name == "readrandommergerandom") {
|
|
|
|
|
if (FLAGS_merge_operator.empty()) {
|
|
|
|
|
fprintf(stdout, "%-12s : skipped (--merge_operator is unknown)\n",
|
|
|
|
|
name.c_str());
|
|
|
|
|
ErrorExit();
|
|
|
|
|
}
|
|
|
|
|
method = &Benchmark::ReadRandomMergeRandom;
|
|
|
|
|
} else if (name == "updaterandom") {
|
|
|
|
|
method = &Benchmark::UpdateRandom;
|
|
|
|
|
} else if (name == "xorupdaterandom") {
|
|
|
|
|
method = &Benchmark::XORUpdateRandom;
|
|
|
|
|
} else if (name == "appendrandom") {
|
Benchmarking for Merge Operator
Summary:
Updated db_bench and utilities/merge_operators.h to allow for dynamic benchmarking
of merge operators in db_bench. Added a new test (--benchmarks=mergerandom), which performs
a bunch of random Merge() operations over random keys. Also added a "--merge_operator=" flag
so that the tester can easily benchmark different merge operators. Currently supports
the PutOperator and UInt64Add operator. Support for stringappend or list append may come later.
Test Plan:
1. make db_bench
2. Test the PutOperator (simulating Put) as follows:
./db_bench --benchmarks=fillrandom,readrandom,updaterandom,readrandom,mergerandom,readrandom --merge_operator=put
--threads=2
3. Test the UInt64AddOperator (simulating numeric addition) similarly:
./db_bench --value_size=8 --benchmarks=fillrandom,readrandom,updaterandom,readrandom,mergerandom,readrandom
--merge_operator=uint64add --threads=2
Reviewers: haobo, dhruba, zshao, MarkCallaghan
Reviewed By: haobo
CC: leveldb
Differential Revision: https://reviews.facebook.net/D11535
11 years ago
|
|
|
method = &Benchmark::AppendRandom;
|
|
|
|
|
} else if (name == "mergerandom") {
|
Benchmarking for Merge Operator
Summary:
Updated db_bench and utilities/merge_operators.h to allow for dynamic benchmarking
of merge operators in db_bench. Added a new test (--benchmarks=mergerandom), which performs
a bunch of random Merge() operations over random keys. Also added a "--merge_operator=" flag
so that the tester can easily benchmark different merge operators. Currently supports
the PutOperator and UInt64Add operator. Support for stringappend or list append may come later.
Test Plan:
1. make db_bench
2. Test the PutOperator (simulating Put) as follows:
./db_bench --benchmarks=fillrandom,readrandom,updaterandom,readrandom,mergerandom,readrandom --merge_operator=put
--threads=2
3. Test the UInt64AddOperator (simulating numeric addition) similarly:
./db_bench --value_size=8 --benchmarks=fillrandom,readrandom,updaterandom,readrandom,mergerandom,readrandom
--merge_operator=uint64add --threads=2
Reviewers: haobo, dhruba, zshao, MarkCallaghan
Reviewed By: haobo
CC: leveldb
Differential Revision: https://reviews.facebook.net/D11535
11 years ago
|
|
|
if (FLAGS_merge_operator.empty()) {
|
|
|
|
|
fprintf(stdout, "%-12s : skipped (--merge_operator is unknown)\n",
|
|
|
|
|
name.c_str());
|
|
|
|
|
exit(1);
|
Benchmarking for Merge Operator
Summary:
Updated db_bench and utilities/merge_operators.h to allow for dynamic benchmarking
of merge operators in db_bench. Added a new test (--benchmarks=mergerandom), which performs
a bunch of random Merge() operations over random keys. Also added a "--merge_operator=" flag
so that the tester can easily benchmark different merge operators. Currently supports
the PutOperator and UInt64Add operator. Support for stringappend or list append may come later.
Test Plan:
1. make db_bench
2. Test the PutOperator (simulating Put) as follows:
./db_bench --benchmarks=fillrandom,readrandom,updaterandom,readrandom,mergerandom,readrandom --merge_operator=put
--threads=2
3. Test the UInt64AddOperator (simulating numeric addition) similarly:
./db_bench --value_size=8 --benchmarks=fillrandom,readrandom,updaterandom,readrandom,mergerandom,readrandom
--merge_operator=uint64add --threads=2
Reviewers: haobo, dhruba, zshao, MarkCallaghan
Reviewed By: haobo
CC: leveldb
Differential Revision: https://reviews.facebook.net/D11535
11 years ago
|
|
|
}
|
|
|
|
|
method = &Benchmark::MergeRandom;
|
|
|
|
|
} else if (name == "randomwithverify") {
|
|
|
|
|
method = &Benchmark::RandomWithVerify;
|
|
|
|
|
} else if (name == "fillseekseq") {
|
SkipListRep::LookaheadIterator
Summary:
This diff introduces the `lookahead` argument to `SkipListFactory()`. This is an
optimization for the tailing use case which includes many seeks. E.g. consider
the following operations on a skip list iterator:
Seek(x), Next(), Next(), Seek(x+2), Next(), Seek(x+3), Next(), Next(), ...
If `lookahead` is positive, `SkipListRep` will return an iterator which also
keeps track of the previously visited node. Seek() then first does a linear
search starting from that node (up to `lookahead` steps). As in the tailing
example above, this may require fewer than ~log(n) comparisons as with regular
skip list search.
Test Plan:
Added a new benchmark (`fillseekseq`) which simulates the usage pattern. It
first writes N records (with consecutive keys), then measures how much time it
takes to read them by calling `Seek()` and `Next()`.
$ time ./db_bench -num 10000000 -benchmarks fillseekseq -prefix_size 1 \
-key_size 8 -write_buffer_size $[1024*1024*1024] -value_size 50 \
-seekseq_next 2 -skip_list_lookahead=0
[...]
DB path: [/dev/shm/rocksdbtest/dbbench]
fillseekseq : 0.389 micros/op 2569047 ops/sec;
real 0m21.806s
user 0m12.106s
sys 0m9.672s
$ time ./db_bench [...] -skip_list_lookahead=2
[...]
DB path: [/dev/shm/rocksdbtest/dbbench]
fillseekseq : 0.153 micros/op 6540684 ops/sec;
real 0m19.469s
user 0m10.192s
sys 0m9.252s
Reviewers: ljin, sdong, igor
Reviewed By: igor
Subscribers: dhruba, leveldb, march, lovro
Differential Revision: https://reviews.facebook.net/D23997
10 years ago
|
|
|
method = &Benchmark::WriteSeqSeekSeq;
|
|
|
|
|
} else if (name == "compact") {
|
|
|
|
|
method = &Benchmark::Compact;
|
|
|
|
|
} else if (name == "compactall") {
|
|
|
|
|
CompactAll();
|
|
|
|
|
#ifndef ROCKSDB_LITE
|
|
|
|
|
} else if (name == "compact0") {
|
|
|
|
|
CompactLevel(0);
|
|
|
|
|
} else if (name == "compact1") {
|
|
|
|
|
CompactLevel(1);
|
|
|
|
|
} else if (name == "waitforcompaction") {
|
|
|
|
|
WaitForCompaction();
|
|
|
|
|
#endif
|
|
|
|
|
} else if (name == "flush") {
|
|
|
|
|
Flush();
|
|
|
|
|
} else if (name == "crc32c") {
|
|
|
|
|
method = &Benchmark::Crc32c;
|
|
|
|
|
} else if (name == "xxhash") {
|
|
|
|
|
method = &Benchmark::xxHash;
|
Implement XXH3 block checksum type (#9069)
Summary:
XXH3 - latest hash function that is extremely fast on large
data, easily faster than crc32c on most any x86_64 hardware. In
integrating this hash function, I have handled the compression type byte
in a non-standard way to avoid using the streaming API (extra data
movement and active code size because of hash function complexity). This
approach got a thumbs-up from Yann Collet.
Existing functionality change:
* reject bad ChecksumType in options with InvalidArgument
This change split off from https://github.com/facebook/rocksdb/issues/9058 because context-aware checksum is
likely to be handled through different configuration than ChecksumType.
Pull Request resolved: https://github.com/facebook/rocksdb/pull/9069
Test Plan:
tests updated, and substantially expanded. Unit tests now check
that we don't accidentally change the values generated by the checksum
algorithms ("schema test") and that we properly handle
invalid/unrecognized checksum types in options or in file footer.
DBTestBase::ChangeOptions (etc.) updated from two to one configuration
changing from default CRC32c ChecksumType. The point of this test code
is to detect possible interactions among features, and the likelihood of
some bad interaction being detected by including configurations other
than XXH3 and CRC32c--and then not detected by stress/crash test--is
extremely low.
Stress/crash test also updated (manual run long enough to see it accepts
new checksum type). db_bench also updated for microbenchmarking
checksums.
### Performance microbenchmark (PORTABLE=0 DEBUG_LEVEL=0, Broadwell processor)
./db_bench -benchmarks=crc32c,xxhash,xxhash64,xxh3,crc32c,xxhash,xxhash64,xxh3,crc32c,xxhash,xxhash64,xxh3
crc32c : 0.200 micros/op 5005220 ops/sec; 19551.6 MB/s (4096 per op)
xxhash : 0.807 micros/op 1238408 ops/sec; 4837.5 MB/s (4096 per op)
xxhash64 : 0.421 micros/op 2376514 ops/sec; 9283.3 MB/s (4096 per op)
xxh3 : 0.171 micros/op 5858391 ops/sec; 22884.3 MB/s (4096 per op)
crc32c : 0.206 micros/op 4859566 ops/sec; 18982.7 MB/s (4096 per op)
xxhash : 0.793 micros/op 1260850 ops/sec; 4925.2 MB/s (4096 per op)
xxhash64 : 0.410 micros/op 2439182 ops/sec; 9528.1 MB/s (4096 per op)
xxh3 : 0.161 micros/op 6202872 ops/sec; 24230.0 MB/s (4096 per op)
crc32c : 0.203 micros/op 4924686 ops/sec; 19237.1 MB/s (4096 per op)
xxhash : 0.839 micros/op 1192388 ops/sec; 4657.8 MB/s (4096 per op)
xxhash64 : 0.424 micros/op 2357391 ops/sec; 9208.6 MB/s (4096 per op)
xxh3 : 0.162 micros/op 6182678 ops/sec; 24151.1 MB/s (4096 per op)
As you can see, especially once warmed up, xxh3 is fastest.
### Performance macrobenchmark (PORTABLE=0 DEBUG_LEVEL=0, Broadwell processor)
Test
for I in `seq 1 50`; do for CHK in 0 1 2 3 4; do TEST_TMPDIR=/dev/shm/rocksdb$CHK ./db_bench -benchmarks=fillseq -memtablerep=vector -allow_concurrent_memtable_write=false -num=30000000 -checksum_type=$CHK 2>&1 | grep 'micros/op' | tee -a results-$CHK & done; wait; done
Results (ops/sec)
for FILE in results*; do echo -n "$FILE "; awk '{ s += $5; c++; } END { print 1.0 * s / c; }' < $FILE; done
results-0 252118 # kNoChecksum
results-1 251588 # kCRC32c
results-2 251863 # kxxHash
results-3 252016 # kxxHash64
results-4 252038 # kXXH3
Reviewed By: mrambacher
Differential Revision: D31905249
Pulled By: pdillinger
fbshipit-source-id: cb9b998ebe2523fc7c400eedf62124a78bf4b4d1
3 years ago
|
|
|
} else if (name == "xxhash64") {
|
|
|
|
|
method = &Benchmark::xxHash64;
|
|
|
|
|
} else if (name == "xxh3") {
|
|
|
|
|
method = &Benchmark::xxh3;
|
|
|
|
|
} else if (name == "acquireload") {
|
|
|
|
|
method = &Benchmark::AcquireLoad;
|
|
|
|
|
} else if (name == "compress") {
|
|
|
|
|
method = &Benchmark::Compress;
|
|
|
|
|
} else if (name == "uncompress") {
|
|
|
|
|
method = &Benchmark::Uncompress;
|
|
|
|
|
#ifndef ROCKSDB_LITE
|
|
|
|
|
} else if (name == "randomtransaction") {
|
|
|
|
|
method = &Benchmark::RandomTransaction;
|
|
|
|
|
post_process_method = &Benchmark::RandomTransactionVerify;
|
|
|
|
|
#endif // ROCKSDB_LITE
|
Support for SingleDelete()
Summary:
This patch fixes #7460559. It introduces SingleDelete as a new database
operation. This operation can be used to delete keys that were never
overwritten (no put following another put of the same key). If an overwritten
key is single deleted the behavior is undefined. Single deletion of a
non-existent key has no effect but multiple consecutive single deletions are
not allowed (see limitations).
In contrast to the conventional Delete() operation, the deletion entry is
removed along with the value when the two are lined up in a compaction. Note:
The semantics are similar to @igor's prototype that allowed to have this
behavior on the granularity of a column family (
https://reviews.facebook.net/D42093 ). This new patch, however, is more
aggressive when it comes to removing tombstones: It removes the SingleDelete
together with the value whenever there is no snapshot between them while the
older patch only did this when the sequence number of the deletion was older
than the earliest snapshot.
Most of the complex additions are in the Compaction Iterator, all other changes
should be relatively straightforward. The patch also includes basic support for
single deletions in db_stress and db_bench.
Limitations:
- Not compatible with cuckoo hash tables
- Single deletions cannot be used in combination with merges and normal
deletions on the same key (other keys are not affected by this)
- Consecutive single deletions are currently not allowed (and older version of
this patch supported this so it could be resurrected if needed)
Test Plan: make all check
Reviewers: yhchiang, sdong, rven, anthony, yoshinorim, igor
Reviewed By: igor
Subscribers: maykov, dhruba, leveldb
Differential Revision: https://reviews.facebook.net/D43179
9 years ago
|
|
|
} else if (name == "randomreplacekeys") {
|
|
|
|
|
fresh_db = true;
|
|
|
|
|
method = &Benchmark::RandomReplaceKeys;
|
|
|
|
|
} else if (name == "timeseries") {
|
|
|
|
|
timestamp_emulator_.reset(new TimestampEmulator());
|
|
|
|
|
if (FLAGS_expire_style == "compaction_filter") {
|
|
|
|
|
filter.reset(new ExpiredTimeFilter(timestamp_emulator_));
|
|
|
|
|
fprintf(stdout, "Compaction filter is used to remove expired data");
|
|
|
|
|
open_options_.compaction_filter = filter.get();
|
|
|
|
|
}
|
|
|
|
|
fresh_db = true;
|
|
|
|
|
method = &Benchmark::TimeSeries;
|
|
|
|
|
} else if (name == "stats") {
|
|
|
|
|
PrintStats("rocksdb.stats");
|
|
|
|
|
} else if (name == "resetstats") {
|
|
|
|
|
ResetStats();
|
|
|
|
|
} else if (name == "verify") {
|
|
|
|
|
VerifyDBFromDB(FLAGS_truth_db);
|
|
|
|
|
} else if (name == "levelstats") {
|
|
|
|
|
PrintStats("rocksdb.levelstats");
|
|
|
|
|
} else if (name == "memstats") {
|
|
|
|
|
std::vector<std::string> keys{"rocksdb.num-immutable-mem-table",
|
|
|
|
|
"rocksdb.cur-size-active-mem-table",
|
|
|
|
|
"rocksdb.cur-size-all-mem-tables",
|
|
|
|
|
"rocksdb.size-all-mem-tables",
|
|
|
|
|
"rocksdb.num-entries-active-mem-table",
|
|
|
|
|
"rocksdb.num-entries-imm-mem-tables"};
|
|
|
|
|
PrintStats(keys);
|
|
|
|
|
} else if (name == "sstables") {
|
|
|
|
|
PrintStats("rocksdb.sstables");
|
|
|
|
|
} else if (name == "stats_history") {
|
|
|
|
|
PrintStatsHistory();
|
|
|
|
|
#ifndef ROCKSDB_LITE
|
|
|
|
|
} else if (name == "replay") {
|
|
|
|
|
if (num_threads > 1) {
|
|
|
|
|
fprintf(stderr, "Multi-threaded replay is not yet supported\n");
|
|
|
|
|
ErrorExit();
|
|
|
|
|
}
|
|
|
|
|
if (FLAGS_trace_file == "") {
|
|
|
|
|
fprintf(stderr, "Please set --trace_file to be replayed from\n");
|
|
|
|
|
ErrorExit();
|
|
|
|
|
}
|
|
|
|
|
method = &Benchmark::Replay;
|
|
|
|
|
#endif // ROCKSDB_LITE
|
New API to get all merge operands for a Key (#5604)
Summary:
This is a new API added to db.h to allow for fetching all merge operands associated with a Key. The main motivation for this API is to support use cases where doing a full online merge is not necessary as it is performance sensitive. Example use-cases:
1. Update subset of columns and read subset of columns -
Imagine a SQL Table, a row is encoded as a K/V pair (as it is done in MyRocks). If there are many columns and users only updated one of them, we can use merge operator to reduce write amplification. While users only read one or two columns in the read query, this feature can avoid a full merging of the whole row, and save some CPU.
2. Updating very few attributes in a value which is a JSON-like document -
Updating one attribute can be done efficiently using merge operator, while reading back one attribute can be done more efficiently if we don't need to do a full merge.
----------------------------------------------------------------------------------------------------
API :
Status GetMergeOperands(
const ReadOptions& options, ColumnFamilyHandle* column_family,
const Slice& key, PinnableSlice* merge_operands,
GetMergeOperandsOptions* get_merge_operands_options,
int* number_of_operands)
Example usage :
int size = 100;
int number_of_operands = 0;
std::vector<PinnableSlice> values(size);
GetMergeOperandsOptions merge_operands_info;
db_->GetMergeOperands(ReadOptions(), db_->DefaultColumnFamily(), "k1", values.data(), merge_operands_info, &number_of_operands);
Description :
Returns all the merge operands corresponding to the key. If the number of merge operands in DB is greater than merge_operands_options.expected_max_number_of_operands no merge operands are returned and status is Incomplete. Merge operands returned are in the order of insertion.
merge_operands-> Points to an array of at-least merge_operands_options.expected_max_number_of_operands and the caller is responsible for allocating it. If the status returned is Incomplete then number_of_operands will contain the total number of merge operands found in DB for key.
Pull Request resolved: https://github.com/facebook/rocksdb/pull/5604
Test Plan:
Added unit test and perf test in db_bench that can be run using the command:
./db_bench -benchmarks=getmergeoperands --merge_operator=sortlist
Differential Revision: D16657366
Pulled By: vjnadimpalli
fbshipit-source-id: 0faadd752351745224ee12d4ae9ef3cb529951bf
5 years ago
|
|
|
} else if (name == "getmergeoperands") {
|
|
|
|
|
method = &Benchmark::GetMergeOperands;
|
|
|
|
|
#ifndef ROCKSDB_LITE
|
|
|
|
|
} else if (name == "verifychecksum") {
|
|
|
|
|
method = &Benchmark::VerifyChecksum;
|
|
|
|
|
} else if (name == "verifyfilechecksums") {
|
|
|
|
|
method = &Benchmark::VerifyFileChecksums;
|
|
|
|
|
#endif // ROCKSDB_LITE
|
|
|
|
|
} else if (name == "readrandomoperands") {
|
|
|
|
|
read_operands_ = true;
|
|
|
|
|
method = &Benchmark::ReadRandom;
|
|
|
|
|
} else if (!name.empty()) { // No error message for empty name
|
|
|
|
|
fprintf(stderr, "unknown benchmark '%s'\n", name.c_str());
|
|
|
|
|
ErrorExit();
|
|
|
|
|
}
|
|
|
|
|
|
|
|
|
|
if (fresh_db) {
|
|
|
|
|
if (FLAGS_use_existing_db) {
|
|
|
|
|
fprintf(stdout, "%-12s : skipped (--use_existing_db is true)\n",
|
|
|
|
|
name.c_str());
|
|
|
|
|
method = nullptr;
|
|
|
|
|
} else {
|
|
|
|
|
if (db_.db != nullptr) {
|
|
|
|
|
db_.DeleteDBs();
|
|
|
|
|
DestroyDB(FLAGS_db, open_options_);
|
|
|
|
|
}
|
|
|
|
|
Options options = open_options_;
|
|
|
|
|
for (size_t i = 0; i < multi_dbs_.size(); i++) {
|
|
|
|
|
delete multi_dbs_[i].db;
|
|
|
|
|
if (!open_options_.wal_dir.empty()) {
|
|
|
|
|
options.wal_dir = GetPathForMultiple(open_options_.wal_dir, i);
|
|
|
|
|
}
|
|
|
|
|
DestroyDB(GetPathForMultiple(FLAGS_db, i), options);
|
|
|
|
|
}
|
|
|
|
|
multi_dbs_.clear();
|
|
|
|
|
}
|
|
|
|
|
Open(&open_options_); // use open_options for the last accessed
|
|
|
|
|
}
|
|
|
|
|
|
|
|
|
|
if (method != nullptr) {
|
|
|
|
|
fprintf(stdout, "DB path: [%s]\n", FLAGS_db.c_str());
|
|
|
|
|
|
|
|
|
|
#ifndef ROCKSDB_LITE
|
|
|
|
|
// A trace_file option can be provided both for trace and replay
|
|
|
|
|
// operations. But db_bench does not support tracing and replaying at
|
|
|
|
|
// the same time, for now. So, start tracing only when it is not a
|
|
|
|
|
// replay.
|
|
|
|
|
if (FLAGS_trace_file != "" && name != "replay") {
|
|
|
|
|
std::unique_ptr<TraceWriter> trace_writer;
|
|
|
|
|
Status s = NewFileTraceWriter(FLAGS_env, EnvOptions(),
|
|
|
|
|
FLAGS_trace_file, &trace_writer);
|
|
|
|
|
if (!s.ok()) {
|
|
|
|
|
fprintf(stderr, "Encountered an error starting a trace, %s\n",
|
|
|
|
|
s.ToString().c_str());
|
|
|
|
|
ErrorExit();
|
|
|
|
|
}
|
|
|
|
|
s = db_.db->StartTrace(trace_options_, std::move(trace_writer));
|
|
|
|
|
if (!s.ok()) {
|
|
|
|
|
fprintf(stderr, "Encountered an error starting a trace, %s\n",
|
|
|
|
|
s.ToString().c_str());
|
|
|
|
|
ErrorExit();
|
|
|
|
|
}
|
|
|
|
|
fprintf(stdout, "Tracing the workload to: [%s]\n",
|
|
|
|
|
FLAGS_trace_file.c_str());
|
|
|
|
|
}
|
|
|
|
|
// Start block cache tracing.
|
|
|
|
|
if (!FLAGS_block_cache_trace_file.empty()) {
|
|
|
|
|
// Sanity checks.
|
|
|
|
|
if (FLAGS_block_cache_trace_sampling_frequency <= 0) {
|
|
|
|
|
fprintf(stderr,
|
|
|
|
|
"Block cache trace sampling frequency must be higher than "
|
|
|
|
|
"0.\n");
|
|
|
|
|
ErrorExit();
|
|
|
|
|
}
|
|
|
|
|
if (FLAGS_block_cache_trace_max_trace_file_size_in_bytes <= 0) {
|
|
|
|
|
fprintf(stderr,
|
|
|
|
|
"The maximum file size for block cache tracing must be "
|
|
|
|
|
"higher than 0.\n");
|
|
|
|
|
ErrorExit();
|
|
|
|
|
}
|
|
|
|
|
block_cache_trace_options_.max_trace_file_size =
|
|
|
|
|
FLAGS_block_cache_trace_max_trace_file_size_in_bytes;
|
|
|
|
|
block_cache_trace_options_.sampling_frequency =
|
|
|
|
|
FLAGS_block_cache_trace_sampling_frequency;
|
|
|
|
|
std::unique_ptr<TraceWriter> block_cache_trace_writer;
|
|
|
|
|
Status s = NewFileTraceWriter(FLAGS_env, EnvOptions(),
|
|
|
|
|
FLAGS_block_cache_trace_file,
|
|
|
|
|
&block_cache_trace_writer);
|
|
|
|
|
if (!s.ok()) {
|
|
|
|
|
fprintf(stderr,
|
|
|
|
|
"Encountered an error when creating trace writer, %s\n",
|
|
|
|
|
s.ToString().c_str());
|
|
|
|
|
ErrorExit();
|
|
|
|
|
}
|
|
|
|
|
s = db_.db->StartBlockCacheTrace(block_cache_trace_options_,
|
|
|
|
|
std::move(block_cache_trace_writer));
|
|
|
|
|
if (!s.ok()) {
|
|
|
|
|
fprintf(
|
|
|
|
|
stderr,
|
|
|
|
|
"Encountered an error when starting block cache tracing, %s\n",
|
|
|
|
|
s.ToString().c_str());
|
|
|
|
|
ErrorExit();
|
|
|
|
|
}
|
|
|
|
|
fprintf(stdout, "Tracing block cache accesses to: [%s]\n",
|
|
|
|
|
FLAGS_block_cache_trace_file.c_str());
|
|
|
|
|
}
|
|
|
|
|
#endif // ROCKSDB_LITE
|
|
|
|
|
|
|
|
|
|
if (num_warmup > 0) {
|
|
|
|
|
printf("Warming up benchmark by running %d times\n", num_warmup);
|
|
|
|
|
}
|
|
|
|
|
|
|
|
|
|
for (int i = 0; i < num_warmup; i++) {
|
|
|
|
|
RunBenchmark(num_threads, name, method);
|
|
|
|
|
}
|
|
|
|
|
|
|
|
|
|
if (num_repeat > 1) {
|
|
|
|
|
printf("Running benchmark for %d times\n", num_repeat);
|
|
|
|
|
}
|
|
|
|
|
|
|
|
|
|
CombinedStats combined_stats;
|
|
|
|
|
for (int i = 0; i < num_repeat; i++) {
|
|
|
|
|
Stats stats = RunBenchmark(num_threads, name, method);
|
|
|
|
|
combined_stats.AddStats(stats);
|
|
|
|
|
}
|
|
|
|
|
if (num_repeat > 1) {
|
|
|
|
|
combined_stats.Report(name);
|
|
|
|
|
}
|
|
|
|
|
}
|
|
|
|
|
if (post_process_method != nullptr) {
|
|
|
|
|
(this->*post_process_method)();
|
|
|
|
|
}
|
|
|
|
|
}
|
|
|
|
|
|
|
|
|
|
if (secondary_update_thread_) {
|
|
|
|
|
secondary_update_stopped_.store(1, std::memory_order_relaxed);
|
|
|
|
|
secondary_update_thread_->join();
|
|
|
|
|
secondary_update_thread_.reset();
|
|
|
|
|
}
|
|
|
|
|
|
|
|
|
|
#ifndef ROCKSDB_LITE
|
|
|
|
|
if (name != "replay" && FLAGS_trace_file != "") {
|
|
|
|
|
Status s = db_.db->EndTrace();
|
|
|
|
|
if (!s.ok()) {
|
|
|
|
|
fprintf(stderr, "Encountered an error ending the trace, %s\n",
|
|
|
|
|
s.ToString().c_str());
|
|
|
|
|
}
|
|
|
|
|
}
|
|
|
|
|
if (!FLAGS_block_cache_trace_file.empty()) {
|
|
|
|
|
Status s = db_.db->EndBlockCacheTrace();
|
|
|
|
|
if (!s.ok()) {
|
|
|
|
|
fprintf(stderr,
|
|
|
|
|
"Encountered an error ending the block cache tracing, %s\n",
|
|
|
|
|
s.ToString().c_str());
|
|
|
|
|
}
|
|
|
|
|
}
|
|
|
|
|
#endif // ROCKSDB_LITE
|
|
|
|
|
|
|
|
|
|
if (FLAGS_statistics) {
|
|
|
|
|
fprintf(stdout, "STATISTICS:\n%s\n", dbstats->ToString().c_str());
|
|
|
|
|
}
|
|
|
|
|
if (FLAGS_simcache_size >= 0) {
|
|
|
|
|
fprintf(
|
|
|
|
|
stdout, "SIMULATOR CACHE STATISTICS:\n%s\n",
|
|
|
|
|
static_cast_with_check<SimCache>(cache_.get())->ToString().c_str());
|
|
|
|
|
}
|
|
|
|
|
|
|
|
|
|
#ifndef ROCKSDB_LITE
|
|
|
|
|
if (FLAGS_use_secondary_db) {
|
|
|
|
|
fprintf(stdout, "Secondary instance updated %" PRIu64 " times.\n",
|
|
|
|
|
secondary_db_updates_);
|
|
|
|
|
}
|
|
|
|
|
#endif // ROCKSDB_LITE
|
|
|
|
|
}
|
|
|
|
|
|
|
|
|
|
private:
|
|
|
|
|
std::shared_ptr<TimestampEmulator> timestamp_emulator_;
|
|
|
|
|
std::unique_ptr<port::Thread> secondary_update_thread_;
|
|
|
|
|
std::atomic<int> secondary_update_stopped_{0};
|
|
|
|
|
#ifndef ROCKSDB_LITE
|
|
|
|
|
uint64_t secondary_db_updates_ = 0;
|
|
|
|
|
#endif // ROCKSDB_LITE
|
|
|
|
|
struct ThreadArg {
|
|
|
|
|
Benchmark* bm;
|
|
|
|
|
SharedState* shared;
|
|
|
|
|
ThreadState* thread;
|
|
|
|
|
void (Benchmark::*method)(ThreadState*);
|
|
|
|
|
};
|
|
|
|
|
|
|
|
|
|
static void ThreadBody(void* v) {
|
|
|
|
|
ThreadArg* arg = reinterpret_cast<ThreadArg*>(v);
|
|
|
|
|
SharedState* shared = arg->shared;
|
|
|
|
|
ThreadState* thread = arg->thread;
|
|
|
|
|
{
|
|
|
|
|
MutexLock l(&shared->mu);
|
|
|
|
|
shared->num_initialized++;
|
|
|
|
|
if (shared->num_initialized >= shared->total) {
|
|
|
|
|
shared->cv.SignalAll();
|
|
|
|
|
}
|
|
|
|
|
while (!shared->start) {
|
|
|
|
|
shared->cv.Wait();
|
|
|
|
|
}
|
|
|
|
|
}
|
|
|
|
|
|
|
|
|
|
SetPerfLevel(static_cast<PerfLevel> (shared->perf_level));
|
|
|
|
|
perf_context.EnablePerLevelPerfContext();
|
|
|
|
|
thread->stats.Start(thread->tid);
|
|
|
|
|
(arg->bm->*(arg->method))(thread);
|
|
|
|
|
thread->stats.Stop();
|
|
|
|
|
|
|
|
|
|
{
|
|
|
|
|
MutexLock l(&shared->mu);
|
|
|
|
|
shared->num_done++;
|
|
|
|
|
if (shared->num_done >= shared->total) {
|
|
|
|
|
shared->cv.SignalAll();
|
|
|
|
|
}
|
|
|
|
|
}
|
|
|
|
|
}
|
|
|
|
|
|
|
|
|
|
Stats RunBenchmark(int n, Slice name,
|
|
|
|
|
void (Benchmark::*method)(ThreadState*)) {
|
|
|
|
|
SharedState shared;
|
|
|
|
|
shared.total = n;
|
|
|
|
|
shared.num_initialized = 0;
|
|
|
|
|
shared.num_done = 0;
|
|
|
|
|
shared.start = false;
|
|
|
|
|
if (FLAGS_benchmark_write_rate_limit > 0) {
|
|
|
|
|
shared.write_rate_limiter.reset(
|
|
|
|
|
NewGenericRateLimiter(FLAGS_benchmark_write_rate_limit));
|
|
|
|
|
}
|
|
|
|
|
if (FLAGS_benchmark_read_rate_limit > 0) {
|
|
|
|
|
shared.read_rate_limiter.reset(NewGenericRateLimiter(
|
|
|
|
|
FLAGS_benchmark_read_rate_limit, 100000 /* refill_period_us */,
|
|
|
|
|
10 /* fairness */, RateLimiter::Mode::kReadsOnly));
|
|
|
|
|
}
|
|
|
|
|
|
db_bench periodically writes QPS to CSV file
Summary:
This is part of an effort to better understand and optimize RocksDB stalls under high load. I added a feature to db_bench to periodically write QPS to CSV files. That way we can nicely see how our QPS changes in time (especially when DB is stalled) and can do a better job of evaluating our stall system (i.e. we want the QPS to be as constant as possible, as opposed to having bunch of stalls)
Cool part of CSV files is that we can easily graph them -- there are a bunch of tools available.
Test Plan:
Ran ./db_bench --report_interval_seconds=10 --benchmarks=fillrandom --num=10000000
and observed this in report.csv:
secs_elapsed,interval_qps
10,2725860
20,1980480
30,1863456
40,1454359
50,1460389
Reviewers: sdong, MarkCallaghan, rven, yhchiang
Reviewed By: yhchiang
Subscribers: dhruba, leveldb
Differential Revision: https://reviews.facebook.net/D40047
9 years ago
|
|
|
std::unique_ptr<ReporterAgent> reporter_agent;
|
|
|
|
|
if (FLAGS_report_interval_seconds > 0) {
|
|
|
|
|
reporter_agent.reset(new ReporterAgent(FLAGS_env, FLAGS_report_file,
|
|
|
|
|
FLAGS_report_interval_seconds));
|
|
|
|
|
}
|
|
|
|
|
|
|
|
|
|
ThreadArg* arg = new ThreadArg[n];
|
|
|
|
|
|
|
|
|
|
for (int i = 0; i < n; i++) {
|
|
|
|
|
#ifdef NUMA
|
|
|
|
|
if (FLAGS_enable_numa) {
|
|
|
|
|
// Performs a local allocation of memory to threads in numa node.
|
|
|
|
|
int n_nodes = numa_num_task_nodes(); // Number of nodes in NUMA.
|
|
|
|
|
numa_exit_on_error = 1;
|
|
|
|
|
int numa_node = i % n_nodes;
|
|
|
|
|
bitmask* nodes = numa_allocate_nodemask();
|
|
|
|
|
numa_bitmask_clearall(nodes);
|
|
|
|
|
numa_bitmask_setbit(nodes, numa_node);
|
|
|
|
|
// numa_bind() call binds the process to the node and these
|
|
|
|
|
// properties are passed on to the thread that is created in
|
|
|
|
|
// StartThread method called later in the loop.
|
|
|
|
|
numa_bind(nodes);
|
|
|
|
|
numa_set_strict(1);
|
|
|
|
|
numa_free_nodemask(nodes);
|
|
|
|
|
}
|
|
|
|
|
#endif
|
|
|
|
|
arg[i].bm = this;
|
|
|
|
|
arg[i].method = method;
|
|
|
|
|
arg[i].shared = &shared;
|
|
|
|
|
total_thread_count_++;
|
|
|
|
|
arg[i].thread = new ThreadState(i, total_thread_count_);
|
db_bench periodically writes QPS to CSV file
Summary:
This is part of an effort to better understand and optimize RocksDB stalls under high load. I added a feature to db_bench to periodically write QPS to CSV files. That way we can nicely see how our QPS changes in time (especially when DB is stalled) and can do a better job of evaluating our stall system (i.e. we want the QPS to be as constant as possible, as opposed to having bunch of stalls)
Cool part of CSV files is that we can easily graph them -- there are a bunch of tools available.
Test Plan:
Ran ./db_bench --report_interval_seconds=10 --benchmarks=fillrandom --num=10000000
and observed this in report.csv:
secs_elapsed,interval_qps
10,2725860
20,1980480
30,1863456
40,1454359
50,1460389
Reviewers: sdong, MarkCallaghan, rven, yhchiang
Reviewed By: yhchiang
Subscribers: dhruba, leveldb
Differential Revision: https://reviews.facebook.net/D40047
9 years ago
|
|
|
arg[i].thread->stats.SetReporterAgent(reporter_agent.get());
|
|
|
|
|
arg[i].thread->shared = &shared;
|
|
|
|
|
FLAGS_env->StartThread(ThreadBody, &arg[i]);
|
|
|
|
|
}
|
|
|
|
|
|
|
|
|
|
shared.mu.Lock();
|
|
|
|
|
while (shared.num_initialized < n) {
|
|
|
|
|
shared.cv.Wait();
|
|
|
|
|
}
|
|
|
|
|
|
|
|
|
|
shared.start = true;
|
|
|
|
|
shared.cv.SignalAll();
|
|
|
|
|
while (shared.num_done < n) {
|
|
|
|
|
shared.cv.Wait();
|
|
|
|
|
}
|
|
|
|
|
shared.mu.Unlock();
|
|
|
|
|
|
|
|
|
|
// Stats for some threads can be excluded.
|
|
|
|
|
Stats merge_stats;
|
|
|
|
|
for (int i = 0; i < n; i++) {
|
|
|
|
|
merge_stats.Merge(arg[i].thread->stats);
|
|
|
|
|
}
|
|
|
|
|
merge_stats.Report(name);
|
|
|
|
|
|
|
|
|
|
for (int i = 0; i < n; i++) {
|
|
|
|
|
delete arg[i].thread;
|
|
|
|
|
}
|
|
|
|
|
delete[] arg;
|
|
|
|
|
|
|
|
|
|
return merge_stats;
|
|
|
|
|
}
|
|
|
|
|
|
Implement XXH3 block checksum type (#9069)
Summary:
XXH3 - latest hash function that is extremely fast on large
data, easily faster than crc32c on most any x86_64 hardware. In
integrating this hash function, I have handled the compression type byte
in a non-standard way to avoid using the streaming API (extra data
movement and active code size because of hash function complexity). This
approach got a thumbs-up from Yann Collet.
Existing functionality change:
* reject bad ChecksumType in options with InvalidArgument
This change split off from https://github.com/facebook/rocksdb/issues/9058 because context-aware checksum is
likely to be handled through different configuration than ChecksumType.
Pull Request resolved: https://github.com/facebook/rocksdb/pull/9069
Test Plan:
tests updated, and substantially expanded. Unit tests now check
that we don't accidentally change the values generated by the checksum
algorithms ("schema test") and that we properly handle
invalid/unrecognized checksum types in options or in file footer.
DBTestBase::ChangeOptions (etc.) updated from two to one configuration
changing from default CRC32c ChecksumType. The point of this test code
is to detect possible interactions among features, and the likelihood of
some bad interaction being detected by including configurations other
than XXH3 and CRC32c--and then not detected by stress/crash test--is
extremely low.
Stress/crash test also updated (manual run long enough to see it accepts
new checksum type). db_bench also updated for microbenchmarking
checksums.
### Performance microbenchmark (PORTABLE=0 DEBUG_LEVEL=0, Broadwell processor)
./db_bench -benchmarks=crc32c,xxhash,xxhash64,xxh3,crc32c,xxhash,xxhash64,xxh3,crc32c,xxhash,xxhash64,xxh3
crc32c : 0.200 micros/op 5005220 ops/sec; 19551.6 MB/s (4096 per op)
xxhash : 0.807 micros/op 1238408 ops/sec; 4837.5 MB/s (4096 per op)
xxhash64 : 0.421 micros/op 2376514 ops/sec; 9283.3 MB/s (4096 per op)
xxh3 : 0.171 micros/op 5858391 ops/sec; 22884.3 MB/s (4096 per op)
crc32c : 0.206 micros/op 4859566 ops/sec; 18982.7 MB/s (4096 per op)
xxhash : 0.793 micros/op 1260850 ops/sec; 4925.2 MB/s (4096 per op)
xxhash64 : 0.410 micros/op 2439182 ops/sec; 9528.1 MB/s (4096 per op)
xxh3 : 0.161 micros/op 6202872 ops/sec; 24230.0 MB/s (4096 per op)
crc32c : 0.203 micros/op 4924686 ops/sec; 19237.1 MB/s (4096 per op)
xxhash : 0.839 micros/op 1192388 ops/sec; 4657.8 MB/s (4096 per op)
xxhash64 : 0.424 micros/op 2357391 ops/sec; 9208.6 MB/s (4096 per op)
xxh3 : 0.162 micros/op 6182678 ops/sec; 24151.1 MB/s (4096 per op)
As you can see, especially once warmed up, xxh3 is fastest.
### Performance macrobenchmark (PORTABLE=0 DEBUG_LEVEL=0, Broadwell processor)
Test
for I in `seq 1 50`; do for CHK in 0 1 2 3 4; do TEST_TMPDIR=/dev/shm/rocksdb$CHK ./db_bench -benchmarks=fillseq -memtablerep=vector -allow_concurrent_memtable_write=false -num=30000000 -checksum_type=$CHK 2>&1 | grep 'micros/op' | tee -a results-$CHK & done; wait; done
Results (ops/sec)
for FILE in results*; do echo -n "$FILE "; awk '{ s += $5; c++; } END { print 1.0 * s / c; }' < $FILE; done
results-0 252118 # kNoChecksum
results-1 251588 # kCRC32c
results-2 251863 # kxxHash
results-3 252016 # kxxHash64
results-4 252038 # kXXH3
Reviewed By: mrambacher
Differential Revision: D31905249
Pulled By: pdillinger
fbshipit-source-id: cb9b998ebe2523fc7c400eedf62124a78bf4b4d1
3 years ago
|
|
|
template <OperationType kOpType, typename FnType, typename... Args>
|
|
|
|
|
static inline void ChecksumBenchmark(FnType fn, ThreadState* thread,
|
|
|
|
|
Args... args) {
|
Port 3 way SSE4.2 crc32c implementation from Folly
Summary:
**# Summary**
RocksDB uses SSE crc32 intrinsics to calculate the crc32 values but it does it in single way fashion (not pipelined on single CPU core). Intel's whitepaper () published an algorithm that uses 3-way pipelining for the crc32 intrinsics, then use pclmulqdq intrinsic to combine the values. Because pclmulqdq has overhead on its own, this algorithm will show perf gains on buffers larger than 216 bytes, which makes RocksDB a perfect user, since most of the buffers RocksDB call crc32c on is over 4KB. Initial db_bench show tremendous CPU gain.
This change uses the 3-way SSE algorithm by default. The old SSE algorithm is now behind a compiler tag NO_THREEWAY_CRC32C. If user compiles the code with NO_THREEWAY_CRC32C=1 then the old SSE Crc32c algorithm would be used. If the server does not have SSE4.2 at the run time the slow way (Non SSE) will be used.
**# Performance Test Results**
We ran the FillRandom and ReadRandom benchmarks in db_bench. ReadRandom is the point of interest here since it calculates the CRC32 for the in-mem buffers. We did 3 runs for each algorithm.
Before this change the CRC32 value computation takes about 11.5% of total CPU cost, and with the new 3-way algorithm it reduced to around 4.5%. The overall throughput also improved from 25.53MB/s to 27.63MB/s.
1) ReadRandom in db_bench overall metrics
PER RUN
Algorithm | run | micros/op | ops/sec |Throughput (MB/s)
3-way | 1 | 4.143 | 241387 | 26.7
3-way | 2 | 3.775 | 264872 | 29.3
3-way | 3 | 4.116 | 242929 | 26.9
FastCrc32c|1 | 4.037 | 247727 | 27.4
FastCrc32c|2 | 4.648 | 215166 | 23.8
FastCrc32c|3 | 4.352 | 229799 | 25.4
AVG
Algorithm | Average of micros/op | Average of ops/sec | Average of Throughput (MB/s)
3-way | 4.01 | 249,729 | 27.63
FastCrc32c | 4.35 | 230,897 | 25.53
2) Crc32c computation CPU cost (inclusive samples percentage)
PER RUN
Implementation | run | TotalSamples | Crc32c percentage
3-way | 1 | 4,572,250,000 | 4.37%
3-way | 2 | 3,779,250,000 | 4.62%
3-way | 3 | 4,129,500,000 | 4.48%
FastCrc32c | 1 | 4,663,500,000 | 11.24%
FastCrc32c | 2 | 4,047,500,000 | 12.34%
FastCrc32c | 3 | 4,366,750,000 | 11.68%
**# Test Plan**
make -j64 corruption_test && ./corruption_test
By default it uses 3-way SSE algorithm
NO_THREEWAY_CRC32C=1 make -j64 corruption_test && ./corruption_test
make clean && DEBUG_LEVEL=0 make -j64 db_bench
make clean && DEBUG_LEVEL=0 NO_THREEWAY_CRC32C=1 make -j64 db_bench
Closes https://github.com/facebook/rocksdb/pull/3173
Differential Revision: D6330882
Pulled By: yingsu00
fbshipit-source-id: 8ec3d89719533b63b536a736663ca6f0dd4482e9
7 years ago
|
|
|
const int size = FLAGS_block_size; // use --block_size option for db_bench
|
|
|
|
|
std::string labels = "(" + ToString(FLAGS_block_size) + " per op)";
|
|
|
|
|
const char* label = labels.c_str();
|
|
|
|
|
|
|
|
|
|
std::string data(size, 'x');
|
Implement XXH3 block checksum type (#9069)
Summary:
XXH3 - latest hash function that is extremely fast on large
data, easily faster than crc32c on most any x86_64 hardware. In
integrating this hash function, I have handled the compression type byte
in a non-standard way to avoid using the streaming API (extra data
movement and active code size because of hash function complexity). This
approach got a thumbs-up from Yann Collet.
Existing functionality change:
* reject bad ChecksumType in options with InvalidArgument
This change split off from https://github.com/facebook/rocksdb/issues/9058 because context-aware checksum is
likely to be handled through different configuration than ChecksumType.
Pull Request resolved: https://github.com/facebook/rocksdb/pull/9069
Test Plan:
tests updated, and substantially expanded. Unit tests now check
that we don't accidentally change the values generated by the checksum
algorithms ("schema test") and that we properly handle
invalid/unrecognized checksum types in options or in file footer.
DBTestBase::ChangeOptions (etc.) updated from two to one configuration
changing from default CRC32c ChecksumType. The point of this test code
is to detect possible interactions among features, and the likelihood of
some bad interaction being detected by including configurations other
than XXH3 and CRC32c--and then not detected by stress/crash test--is
extremely low.
Stress/crash test also updated (manual run long enough to see it accepts
new checksum type). db_bench also updated for microbenchmarking
checksums.
### Performance microbenchmark (PORTABLE=0 DEBUG_LEVEL=0, Broadwell processor)
./db_bench -benchmarks=crc32c,xxhash,xxhash64,xxh3,crc32c,xxhash,xxhash64,xxh3,crc32c,xxhash,xxhash64,xxh3
crc32c : 0.200 micros/op 5005220 ops/sec; 19551.6 MB/s (4096 per op)
xxhash : 0.807 micros/op 1238408 ops/sec; 4837.5 MB/s (4096 per op)
xxhash64 : 0.421 micros/op 2376514 ops/sec; 9283.3 MB/s (4096 per op)
xxh3 : 0.171 micros/op 5858391 ops/sec; 22884.3 MB/s (4096 per op)
crc32c : 0.206 micros/op 4859566 ops/sec; 18982.7 MB/s (4096 per op)
xxhash : 0.793 micros/op 1260850 ops/sec; 4925.2 MB/s (4096 per op)
xxhash64 : 0.410 micros/op 2439182 ops/sec; 9528.1 MB/s (4096 per op)
xxh3 : 0.161 micros/op 6202872 ops/sec; 24230.0 MB/s (4096 per op)
crc32c : 0.203 micros/op 4924686 ops/sec; 19237.1 MB/s (4096 per op)
xxhash : 0.839 micros/op 1192388 ops/sec; 4657.8 MB/s (4096 per op)
xxhash64 : 0.424 micros/op 2357391 ops/sec; 9208.6 MB/s (4096 per op)
xxh3 : 0.162 micros/op 6182678 ops/sec; 24151.1 MB/s (4096 per op)
As you can see, especially once warmed up, xxh3 is fastest.
### Performance macrobenchmark (PORTABLE=0 DEBUG_LEVEL=0, Broadwell processor)
Test
for I in `seq 1 50`; do for CHK in 0 1 2 3 4; do TEST_TMPDIR=/dev/shm/rocksdb$CHK ./db_bench -benchmarks=fillseq -memtablerep=vector -allow_concurrent_memtable_write=false -num=30000000 -checksum_type=$CHK 2>&1 | grep 'micros/op' | tee -a results-$CHK & done; wait; done
Results (ops/sec)
for FILE in results*; do echo -n "$FILE "; awk '{ s += $5; c++; } END { print 1.0 * s / c; }' < $FILE; done
results-0 252118 # kNoChecksum
results-1 251588 # kCRC32c
results-2 251863 # kxxHash
results-3 252016 # kxxHash64
results-4 252038 # kXXH3
Reviewed By: mrambacher
Differential Revision: D31905249
Pulled By: pdillinger
fbshipit-source-id: cb9b998ebe2523fc7c400eedf62124a78bf4b4d1
3 years ago
|
|
|
uint64_t bytes = 0;
|
|
|
|
|
uint32_t val = 0;
|
|
|
|
|
while (bytes < 5000U * uint64_t{1048576}) { // ~5GB
|
|
|
|
|
val += static_cast<uint32_t>(fn(data.data(), size, args...));
|
|
|
|
|
thread->stats.FinishedOps(nullptr, nullptr, 1, kOpType);
|
|
|
|
|
bytes += size;
|
|
|
|
|
}
|
|
|
|
|
// Print so result is not dead
|
Implement XXH3 block checksum type (#9069)
Summary:
XXH3 - latest hash function that is extremely fast on large
data, easily faster than crc32c on most any x86_64 hardware. In
integrating this hash function, I have handled the compression type byte
in a non-standard way to avoid using the streaming API (extra data
movement and active code size because of hash function complexity). This
approach got a thumbs-up from Yann Collet.
Existing functionality change:
* reject bad ChecksumType in options with InvalidArgument
This change split off from https://github.com/facebook/rocksdb/issues/9058 because context-aware checksum is
likely to be handled through different configuration than ChecksumType.
Pull Request resolved: https://github.com/facebook/rocksdb/pull/9069
Test Plan:
tests updated, and substantially expanded. Unit tests now check
that we don't accidentally change the values generated by the checksum
algorithms ("schema test") and that we properly handle
invalid/unrecognized checksum types in options or in file footer.
DBTestBase::ChangeOptions (etc.) updated from two to one configuration
changing from default CRC32c ChecksumType. The point of this test code
is to detect possible interactions among features, and the likelihood of
some bad interaction being detected by including configurations other
than XXH3 and CRC32c--and then not detected by stress/crash test--is
extremely low.
Stress/crash test also updated (manual run long enough to see it accepts
new checksum type). db_bench also updated for microbenchmarking
checksums.
### Performance microbenchmark (PORTABLE=0 DEBUG_LEVEL=0, Broadwell processor)
./db_bench -benchmarks=crc32c,xxhash,xxhash64,xxh3,crc32c,xxhash,xxhash64,xxh3,crc32c,xxhash,xxhash64,xxh3
crc32c : 0.200 micros/op 5005220 ops/sec; 19551.6 MB/s (4096 per op)
xxhash : 0.807 micros/op 1238408 ops/sec; 4837.5 MB/s (4096 per op)
xxhash64 : 0.421 micros/op 2376514 ops/sec; 9283.3 MB/s (4096 per op)
xxh3 : 0.171 micros/op 5858391 ops/sec; 22884.3 MB/s (4096 per op)
crc32c : 0.206 micros/op 4859566 ops/sec; 18982.7 MB/s (4096 per op)
xxhash : 0.793 micros/op 1260850 ops/sec; 4925.2 MB/s (4096 per op)
xxhash64 : 0.410 micros/op 2439182 ops/sec; 9528.1 MB/s (4096 per op)
xxh3 : 0.161 micros/op 6202872 ops/sec; 24230.0 MB/s (4096 per op)
crc32c : 0.203 micros/op 4924686 ops/sec; 19237.1 MB/s (4096 per op)
xxhash : 0.839 micros/op 1192388 ops/sec; 4657.8 MB/s (4096 per op)
xxhash64 : 0.424 micros/op 2357391 ops/sec; 9208.6 MB/s (4096 per op)
xxh3 : 0.162 micros/op 6182678 ops/sec; 24151.1 MB/s (4096 per op)
As you can see, especially once warmed up, xxh3 is fastest.
### Performance macrobenchmark (PORTABLE=0 DEBUG_LEVEL=0, Broadwell processor)
Test
for I in `seq 1 50`; do for CHK in 0 1 2 3 4; do TEST_TMPDIR=/dev/shm/rocksdb$CHK ./db_bench -benchmarks=fillseq -memtablerep=vector -allow_concurrent_memtable_write=false -num=30000000 -checksum_type=$CHK 2>&1 | grep 'micros/op' | tee -a results-$CHK & done; wait; done
Results (ops/sec)
for FILE in results*; do echo -n "$FILE "; awk '{ s += $5; c++; } END { print 1.0 * s / c; }' < $FILE; done
results-0 252118 # kNoChecksum
results-1 251588 # kCRC32c
results-2 251863 # kxxHash
results-3 252016 # kxxHash64
results-4 252038 # kXXH3
Reviewed By: mrambacher
Differential Revision: D31905249
Pulled By: pdillinger
fbshipit-source-id: cb9b998ebe2523fc7c400eedf62124a78bf4b4d1
3 years ago
|
|
|
fprintf(stderr, "... val=0x%x\r", static_cast<unsigned int>(val));
|
|
|
|
|
|
|
|
|
|
thread->stats.AddBytes(bytes);
|
|
|
|
|
thread->stats.AddMessage(label);
|
|
|
|
|
}
|
|
|
|
|
|
Implement XXH3 block checksum type (#9069)
Summary:
XXH3 - latest hash function that is extremely fast on large
data, easily faster than crc32c on most any x86_64 hardware. In
integrating this hash function, I have handled the compression type byte
in a non-standard way to avoid using the streaming API (extra data
movement and active code size because of hash function complexity). This
approach got a thumbs-up from Yann Collet.
Existing functionality change:
* reject bad ChecksumType in options with InvalidArgument
This change split off from https://github.com/facebook/rocksdb/issues/9058 because context-aware checksum is
likely to be handled through different configuration than ChecksumType.
Pull Request resolved: https://github.com/facebook/rocksdb/pull/9069
Test Plan:
tests updated, and substantially expanded. Unit tests now check
that we don't accidentally change the values generated by the checksum
algorithms ("schema test") and that we properly handle
invalid/unrecognized checksum types in options or in file footer.
DBTestBase::ChangeOptions (etc.) updated from two to one configuration
changing from default CRC32c ChecksumType. The point of this test code
is to detect possible interactions among features, and the likelihood of
some bad interaction being detected by including configurations other
than XXH3 and CRC32c--and then not detected by stress/crash test--is
extremely low.
Stress/crash test also updated (manual run long enough to see it accepts
new checksum type). db_bench also updated for microbenchmarking
checksums.
### Performance microbenchmark (PORTABLE=0 DEBUG_LEVEL=0, Broadwell processor)
./db_bench -benchmarks=crc32c,xxhash,xxhash64,xxh3,crc32c,xxhash,xxhash64,xxh3,crc32c,xxhash,xxhash64,xxh3
crc32c : 0.200 micros/op 5005220 ops/sec; 19551.6 MB/s (4096 per op)
xxhash : 0.807 micros/op 1238408 ops/sec; 4837.5 MB/s (4096 per op)
xxhash64 : 0.421 micros/op 2376514 ops/sec; 9283.3 MB/s (4096 per op)
xxh3 : 0.171 micros/op 5858391 ops/sec; 22884.3 MB/s (4096 per op)
crc32c : 0.206 micros/op 4859566 ops/sec; 18982.7 MB/s (4096 per op)
xxhash : 0.793 micros/op 1260850 ops/sec; 4925.2 MB/s (4096 per op)
xxhash64 : 0.410 micros/op 2439182 ops/sec; 9528.1 MB/s (4096 per op)
xxh3 : 0.161 micros/op 6202872 ops/sec; 24230.0 MB/s (4096 per op)
crc32c : 0.203 micros/op 4924686 ops/sec; 19237.1 MB/s (4096 per op)
xxhash : 0.839 micros/op 1192388 ops/sec; 4657.8 MB/s (4096 per op)
xxhash64 : 0.424 micros/op 2357391 ops/sec; 9208.6 MB/s (4096 per op)
xxh3 : 0.162 micros/op 6182678 ops/sec; 24151.1 MB/s (4096 per op)
As you can see, especially once warmed up, xxh3 is fastest.
### Performance macrobenchmark (PORTABLE=0 DEBUG_LEVEL=0, Broadwell processor)
Test
for I in `seq 1 50`; do for CHK in 0 1 2 3 4; do TEST_TMPDIR=/dev/shm/rocksdb$CHK ./db_bench -benchmarks=fillseq -memtablerep=vector -allow_concurrent_memtable_write=false -num=30000000 -checksum_type=$CHK 2>&1 | grep 'micros/op' | tee -a results-$CHK & done; wait; done
Results (ops/sec)
for FILE in results*; do echo -n "$FILE "; awk '{ s += $5; c++; } END { print 1.0 * s / c; }' < $FILE; done
results-0 252118 # kNoChecksum
results-1 251588 # kCRC32c
results-2 251863 # kxxHash
results-3 252016 # kxxHash64
results-4 252038 # kXXH3
Reviewed By: mrambacher
Differential Revision: D31905249
Pulled By: pdillinger
fbshipit-source-id: cb9b998ebe2523fc7c400eedf62124a78bf4b4d1
3 years ago
|
|
|
void Crc32c(ThreadState* thread) {
|
|
|
|
|
ChecksumBenchmark<kCrc>(crc32c::Value, thread);
|
|
|
|
|
}
|
|
|
|
|
|
|
|
|
|
void xxHash(ThreadState* thread) {
|
Implement XXH3 block checksum type (#9069)
Summary:
XXH3 - latest hash function that is extremely fast on large
data, easily faster than crc32c on most any x86_64 hardware. In
integrating this hash function, I have handled the compression type byte
in a non-standard way to avoid using the streaming API (extra data
movement and active code size because of hash function complexity). This
approach got a thumbs-up from Yann Collet.
Existing functionality change:
* reject bad ChecksumType in options with InvalidArgument
This change split off from https://github.com/facebook/rocksdb/issues/9058 because context-aware checksum is
likely to be handled through different configuration than ChecksumType.
Pull Request resolved: https://github.com/facebook/rocksdb/pull/9069
Test Plan:
tests updated, and substantially expanded. Unit tests now check
that we don't accidentally change the values generated by the checksum
algorithms ("schema test") and that we properly handle
invalid/unrecognized checksum types in options or in file footer.
DBTestBase::ChangeOptions (etc.) updated from two to one configuration
changing from default CRC32c ChecksumType. The point of this test code
is to detect possible interactions among features, and the likelihood of
some bad interaction being detected by including configurations other
than XXH3 and CRC32c--and then not detected by stress/crash test--is
extremely low.
Stress/crash test also updated (manual run long enough to see it accepts
new checksum type). db_bench also updated for microbenchmarking
checksums.
### Performance microbenchmark (PORTABLE=0 DEBUG_LEVEL=0, Broadwell processor)
./db_bench -benchmarks=crc32c,xxhash,xxhash64,xxh3,crc32c,xxhash,xxhash64,xxh3,crc32c,xxhash,xxhash64,xxh3
crc32c : 0.200 micros/op 5005220 ops/sec; 19551.6 MB/s (4096 per op)
xxhash : 0.807 micros/op 1238408 ops/sec; 4837.5 MB/s (4096 per op)
xxhash64 : 0.421 micros/op 2376514 ops/sec; 9283.3 MB/s (4096 per op)
xxh3 : 0.171 micros/op 5858391 ops/sec; 22884.3 MB/s (4096 per op)
crc32c : 0.206 micros/op 4859566 ops/sec; 18982.7 MB/s (4096 per op)
xxhash : 0.793 micros/op 1260850 ops/sec; 4925.2 MB/s (4096 per op)
xxhash64 : 0.410 micros/op 2439182 ops/sec; 9528.1 MB/s (4096 per op)
xxh3 : 0.161 micros/op 6202872 ops/sec; 24230.0 MB/s (4096 per op)
crc32c : 0.203 micros/op 4924686 ops/sec; 19237.1 MB/s (4096 per op)
xxhash : 0.839 micros/op 1192388 ops/sec; 4657.8 MB/s (4096 per op)
xxhash64 : 0.424 micros/op 2357391 ops/sec; 9208.6 MB/s (4096 per op)
xxh3 : 0.162 micros/op 6182678 ops/sec; 24151.1 MB/s (4096 per op)
As you can see, especially once warmed up, xxh3 is fastest.
### Performance macrobenchmark (PORTABLE=0 DEBUG_LEVEL=0, Broadwell processor)
Test
for I in `seq 1 50`; do for CHK in 0 1 2 3 4; do TEST_TMPDIR=/dev/shm/rocksdb$CHK ./db_bench -benchmarks=fillseq -memtablerep=vector -allow_concurrent_memtable_write=false -num=30000000 -checksum_type=$CHK 2>&1 | grep 'micros/op' | tee -a results-$CHK & done; wait; done
Results (ops/sec)
for FILE in results*; do echo -n "$FILE "; awk '{ s += $5; c++; } END { print 1.0 * s / c; }' < $FILE; done
results-0 252118 # kNoChecksum
results-1 251588 # kCRC32c
results-2 251863 # kxxHash
results-3 252016 # kxxHash64
results-4 252038 # kXXH3
Reviewed By: mrambacher
Differential Revision: D31905249
Pulled By: pdillinger
fbshipit-source-id: cb9b998ebe2523fc7c400eedf62124a78bf4b4d1
3 years ago
|
|
|
ChecksumBenchmark<kHash>(XXH32, thread, /*seed*/ 0);
|
|
|
|
|
}
|
|
|
|
|
|
Implement XXH3 block checksum type (#9069)
Summary:
XXH3 - latest hash function that is extremely fast on large
data, easily faster than crc32c on most any x86_64 hardware. In
integrating this hash function, I have handled the compression type byte
in a non-standard way to avoid using the streaming API (extra data
movement and active code size because of hash function complexity). This
approach got a thumbs-up from Yann Collet.
Existing functionality change:
* reject bad ChecksumType in options with InvalidArgument
This change split off from https://github.com/facebook/rocksdb/issues/9058 because context-aware checksum is
likely to be handled through different configuration than ChecksumType.
Pull Request resolved: https://github.com/facebook/rocksdb/pull/9069
Test Plan:
tests updated, and substantially expanded. Unit tests now check
that we don't accidentally change the values generated by the checksum
algorithms ("schema test") and that we properly handle
invalid/unrecognized checksum types in options or in file footer.
DBTestBase::ChangeOptions (etc.) updated from two to one configuration
changing from default CRC32c ChecksumType. The point of this test code
is to detect possible interactions among features, and the likelihood of
some bad interaction being detected by including configurations other
than XXH3 and CRC32c--and then not detected by stress/crash test--is
extremely low.
Stress/crash test also updated (manual run long enough to see it accepts
new checksum type). db_bench also updated for microbenchmarking
checksums.
### Performance microbenchmark (PORTABLE=0 DEBUG_LEVEL=0, Broadwell processor)
./db_bench -benchmarks=crc32c,xxhash,xxhash64,xxh3,crc32c,xxhash,xxhash64,xxh3,crc32c,xxhash,xxhash64,xxh3
crc32c : 0.200 micros/op 5005220 ops/sec; 19551.6 MB/s (4096 per op)
xxhash : 0.807 micros/op 1238408 ops/sec; 4837.5 MB/s (4096 per op)
xxhash64 : 0.421 micros/op 2376514 ops/sec; 9283.3 MB/s (4096 per op)
xxh3 : 0.171 micros/op 5858391 ops/sec; 22884.3 MB/s (4096 per op)
crc32c : 0.206 micros/op 4859566 ops/sec; 18982.7 MB/s (4096 per op)
xxhash : 0.793 micros/op 1260850 ops/sec; 4925.2 MB/s (4096 per op)
xxhash64 : 0.410 micros/op 2439182 ops/sec; 9528.1 MB/s (4096 per op)
xxh3 : 0.161 micros/op 6202872 ops/sec; 24230.0 MB/s (4096 per op)
crc32c : 0.203 micros/op 4924686 ops/sec; 19237.1 MB/s (4096 per op)
xxhash : 0.839 micros/op 1192388 ops/sec; 4657.8 MB/s (4096 per op)
xxhash64 : 0.424 micros/op 2357391 ops/sec; 9208.6 MB/s (4096 per op)
xxh3 : 0.162 micros/op 6182678 ops/sec; 24151.1 MB/s (4096 per op)
As you can see, especially once warmed up, xxh3 is fastest.
### Performance macrobenchmark (PORTABLE=0 DEBUG_LEVEL=0, Broadwell processor)
Test
for I in `seq 1 50`; do for CHK in 0 1 2 3 4; do TEST_TMPDIR=/dev/shm/rocksdb$CHK ./db_bench -benchmarks=fillseq -memtablerep=vector -allow_concurrent_memtable_write=false -num=30000000 -checksum_type=$CHK 2>&1 | grep 'micros/op' | tee -a results-$CHK & done; wait; done
Results (ops/sec)
for FILE in results*; do echo -n "$FILE "; awk '{ s += $5; c++; } END { print 1.0 * s / c; }' < $FILE; done
results-0 252118 # kNoChecksum
results-1 251588 # kCRC32c
results-2 251863 # kxxHash
results-3 252016 # kxxHash64
results-4 252038 # kXXH3
Reviewed By: mrambacher
Differential Revision: D31905249
Pulled By: pdillinger
fbshipit-source-id: cb9b998ebe2523fc7c400eedf62124a78bf4b4d1
3 years ago
|
|
|
void xxHash64(ThreadState* thread) {
|
|
|
|
|
ChecksumBenchmark<kHash>(XXH64, thread, /*seed*/ 0);
|
|
|
|
|
}
|
|
|
|
|
|
|
|
|
|
void xxh3(ThreadState* thread) {
|
|
|
|
|
ChecksumBenchmark<kHash>(XXH3_64bits, thread);
|
|
|
|
|
}
|
|
|
|
|
|
|
|
|
|
void AcquireLoad(ThreadState* thread) {
|
|
|
|
|
int dummy;
|
|
|
|
|
std::atomic<void*> ap(&dummy);
|
|
|
|
|
int count = 0;
|
|
|
|
|
void *ptr = nullptr;
|
|
|
|
|
thread->stats.AddMessage("(each op is 1000 loads)");
|
|
|
|
|
while (count < 100000) {
|
|
|
|
|
for (int i = 0; i < 1000; i++) {
|
|
|
|
|
ptr = ap.load(std::memory_order_acquire);
|
|
|
|
|
}
|
|
|
|
|
count++;
|
|
|
|
|
thread->stats.FinishedOps(nullptr, nullptr, 1, kOthers);
|
|
|
|
|
}
|
|
|
|
|
if (ptr == nullptr) exit(1); // Disable unused variable warning.
|
|
|
|
|
}
|
|
|
|
|
|
|
|
|
|
void Compress(ThreadState *thread) {
|
|
|
|
|
RandomGenerator gen;
|
|
|
|
|
Slice input = gen.Generate(FLAGS_block_size);
|
|
|
|
|
int64_t bytes = 0;
|
|
|
|
|
int64_t produced = 0;
|
|
|
|
|
bool ok = true;
|
|
|
|
|
std::string compressed;
|
|
|
|
|
CompressionOptions opts;
|
|
|
|
|
CompressionContext context(FLAGS_compression_type_e);
|
|
|
|
|
CompressionInfo info(opts, context, CompressionDict::GetEmptyDict(),
|
|
|
|
|
FLAGS_compression_type_e,
|
|
|
|
|
FLAGS_sample_for_compression);
|
|
|
|
|
// Compress 1G
|
|
|
|
|
while (ok && bytes < int64_t(1) << 30) {
|
|
|
|
|
compressed.clear();
|
|
|
|
|
ok = CompressSlice(info, input, &compressed);
|
|
|
|
|
produced += compressed.size();
|
|
|
|
|
bytes += input.size();
|
|
|
|
|
thread->stats.FinishedOps(nullptr, nullptr, 1, kCompress);
|
|
|
|
|
}
|
|
|
|
|
|
|
|
|
|
if (!ok) {
|
|
|
|
|
thread->stats.AddMessage("(compression failure)");
|
|
|
|
|
} else {
|
|
|
|
|
char buf[340];
|
|
|
|
|
snprintf(buf, sizeof(buf), "(output: %.1f%%)",
|
|
|
|
|
(produced * 100.0) / bytes);
|
|
|
|
|
thread->stats.AddMessage(buf);
|
|
|
|
|
thread->stats.AddBytes(bytes);
|
|
|
|
|
}
|
|
|
|
|
}
|
|
|
|
|
|
|
|
|
|
void Uncompress(ThreadState *thread) {
|
|
|
|
|
RandomGenerator gen;
|
|
|
|
|
Slice input = gen.Generate(FLAGS_block_size);
|
|
|
|
|
std::string compressed;
|
|
|
|
|
|
|
|
|
|
CompressionContext compression_ctx(FLAGS_compression_type_e);
|
|
|
|
|
CompressionOptions compression_opts;
|
|
|
|
|
CompressionInfo compression_info(
|
|
|
|
|
compression_opts, compression_ctx, CompressionDict::GetEmptyDict(),
|
|
|
|
|
FLAGS_compression_type_e, FLAGS_sample_for_compression);
|
|
|
|
|
UncompressionContext uncompression_ctx(FLAGS_compression_type_e);
|
|
|
|
|
UncompressionInfo uncompression_info(uncompression_ctx,
|
|
|
|
|
UncompressionDict::GetEmptyDict(),
|
|
|
|
|
FLAGS_compression_type_e);
|
|
|
|
|
|
|
|
|
|
bool ok = CompressSlice(compression_info, input, &compressed);
|
|
|
|
|
int64_t bytes = 0;
|
|
|
|
|
size_t uncompressed_size = 0;
|
|
|
|
|
while (ok && bytes < 1024 * 1048576) {
|
|
|
|
|
constexpr uint32_t compress_format_version = 2;
|
|
|
|
|
|
|
|
|
|
CacheAllocationPtr uncompressed = UncompressData(
|
|
|
|
|
uncompression_info, compressed.data(), compressed.size(),
|
|
|
|
|
&uncompressed_size, compress_format_version);
|
|
|
|
|
|
|
|
|
|
ok = uncompressed.get() != nullptr;
|
|
|
|
|
bytes += input.size();
|
|
|
|
|
thread->stats.FinishedOps(nullptr, nullptr, 1, kUncompress);
|
|
|
|
|
}
|
|
|
|
|
|
|
|
|
|
if (!ok) {
|
|
|
|
|
thread->stats.AddMessage("(compression failure)");
|
|
|
|
|
} else {
|
|
|
|
|
thread->stats.AddBytes(bytes);
|
|
|
|
|
}
|
|
|
|
|
}
|
|
|
|
|
|
|
|
|
|
// Returns true if the options is initialized from the specified
|
|
|
|
|
// options file.
|
|
|
|
|
bool InitializeOptionsFromFile(Options* opts) {
|
|
|
|
|
#ifndef ROCKSDB_LITE
|
|
|
|
|
printf("Initializing RocksDB Options from the specified file\n");
|
|
|
|
|
DBOptions db_opts;
|
|
|
|
|
std::vector<ColumnFamilyDescriptor> cf_descs;
|
|
|
|
|
if (FLAGS_options_file != "") {
|
|
|
|
|
auto s = LoadOptionsFromFile(FLAGS_options_file, FLAGS_env, &db_opts,
|
|
|
|
|
&cf_descs);
|
|
|
|
|
db_opts.env = FLAGS_env;
|
|
|
|
|
if (s.ok()) {
|
|
|
|
|
*opts = Options(db_opts, cf_descs[0].options);
|
|
|
|
|
return true;
|
|
|
|
|
}
|
|
|
|
|
fprintf(stderr, "Unable to load options file %s --- %s\n",
|
|
|
|
|
FLAGS_options_file.c_str(), s.ToString().c_str());
|
|
|
|
|
exit(1);
|
|
|
|
|
}
|
|
|
|
|
#else
|
|
|
|
|
(void)opts;
|
|
|
|
|
#endif
|
|
|
|
|
return false;
|
|
|
|
|
}
|
|
|
|
|
|
|
|
|
|
void InitializeOptionsFromFlags(Options* opts) {
|
|
|
|
|
printf("Initializing RocksDB Options from command-line flags\n");
|
|
|
|
|
Options& options = *opts;
|
|
|
|
|
ConfigOptions config_options(options);
|
|
|
|
|
config_options.ignore_unsupported_options = false;
|
|
|
|
|
|
|
|
|
|
assert(db_.db == nullptr);
|
|
|
|
|
|
|
|
|
|
options.env = FLAGS_env;
|
|
|
|
|
options.max_open_files = FLAGS_open_files;
|
|
|
|
|
if (FLAGS_cost_write_buffer_to_cache || FLAGS_db_write_buffer_size != 0) {
|
|
|
|
|
options.write_buffer_manager.reset(
|
|
|
|
|
new WriteBufferManager(FLAGS_db_write_buffer_size, cache_));
|
|
|
|
|
}
|
|
|
|
|
options.arena_block_size = FLAGS_arena_block_size;
|
|
|
|
|
options.write_buffer_size = FLAGS_write_buffer_size;
|
|
|
|
|
options.max_write_buffer_number = FLAGS_max_write_buffer_number;
|
|
|
|
|
options.min_write_buffer_number_to_merge =
|
|
|
|
|
FLAGS_min_write_buffer_number_to_merge;
|
Support saving history in memtable_list
Summary:
For transactions, we are using the memtables to validate that there are no write conflicts. But after flushing, we don't have any memtables, and transactions could fail to commit. So we want to someone keep around some extra history to use for conflict checking. In addition, we want to provide a way to increase the size of this history if too many transactions fail to commit.
After chatting with people, it seems like everyone prefers just using Memtables to store this history (instead of a separate history structure). It seems like the best place for this is abstracted inside the memtable_list. I decide to create a separate list in MemtableListVersion as using the same list complicated the flush/installalflushresults logic too much.
This diff adds a new parameter to control how much memtable history to keep around after flushing. However, it sounds like people aren't too fond of adding new parameters. So I am making the default size of flushed+not-flushed memtables be set to max_write_buffers. This should not change the maximum amount of memory used, but make it more likely we're using closer the the limit. (We are now postponing deleting flushed memtables until the max_write_buffer limit is reached). So while we might use more memory on average, we are still obeying the limit set (and you could argue it's better to go ahead and use up memory now instead of waiting for a write stall to happen to test this limit).
However, if people are opposed to this default behavior, we can easily set it to 0 and require this parameter be set in order to use transactions.
Test Plan: Added a xfunc test to play around with setting different values of this parameter in all tests. Added testing in memtablelist_test and planning on adding more testing here.
Reviewers: sdong, rven, igor
Reviewed By: igor
Subscribers: dhruba, leveldb
Differential Revision: https://reviews.facebook.net/D37443
9 years ago
|
|
|
options.max_write_buffer_number_to_maintain =
|
|
|
|
|
FLAGS_max_write_buffer_number_to_maintain;
|
Refactor trimming logic for immutable memtables (#5022)
Summary:
MyRocks currently sets `max_write_buffer_number_to_maintain` in order to maintain enough history for transaction conflict checking. The effectiveness of this approach depends on the size of memtables. When memtables are small, it may not keep enough history; when memtables are large, this may consume too much memory.
We are proposing a new way to configure memtable list history: by limiting the memory usage of immutable memtables. The new option is `max_write_buffer_size_to_maintain` and it will take precedence over the old `max_write_buffer_number_to_maintain` if they are both set to non-zero values. The new option accounts for the total memory usage of flushed immutable memtables and mutable memtable. When the total usage exceeds the limit, RocksDB may start dropping immutable memtables (which is also called trimming history), starting from the oldest one.
The semantics of the old option actually works both as an upper bound and lower bound. History trimming will start if number of immutable memtables exceeds the limit, but it will never go below (limit-1) due to history trimming.
In order the mimic the behavior with the new option, history trimming will stop if dropping the next immutable memtable causes the total memory usage go below the size limit. For example, assuming the size limit is set to 64MB, and there are 3 immutable memtables with sizes of 20, 30, 30. Although the total memory usage is 80MB > 64MB, dropping the oldest memtable will reduce the memory usage to 60MB < 64MB, so in this case no memtable will be dropped.
Pull Request resolved: https://github.com/facebook/rocksdb/pull/5022
Differential Revision: D14394062
Pulled By: miasantreble
fbshipit-source-id: 60457a509c6af89d0993f988c9b5c2aa9e45f5c5
5 years ago
|
|
|
options.max_write_buffer_size_to_maintain =
|
|
|
|
|
FLAGS_max_write_buffer_size_to_maintain;
|
|
|
|
|
options.max_background_jobs = FLAGS_max_background_jobs;
|
|
|
|
|
options.max_background_compactions = FLAGS_max_background_compactions;
|
|
|
|
|
options.max_subcompactions = static_cast<uint32_t>(FLAGS_subcompactions);
|
|
|
|
|
options.max_background_flushes = FLAGS_max_background_flushes;
|
|
|
|
|
options.compaction_style = FLAGS_compaction_style_e;
|
|
|
|
|
options.compaction_pri = FLAGS_compaction_pri_e;
|
|
|
|
|
options.allow_mmap_reads = FLAGS_mmap_read;
|
|
|
|
|
options.allow_mmap_writes = FLAGS_mmap_write;
|
|
|
|
|
options.use_direct_reads = FLAGS_use_direct_reads;
|
|
|
|
|
options.use_direct_io_for_flush_and_compaction =
|
|
|
|
|
FLAGS_use_direct_io_for_flush_and_compaction;
|
|
|
|
|
options.manual_wal_flush = FLAGS_manual_wal_flush;
|
|
|
|
|
options.wal_compression = FLAGS_wal_compression_e;
|
|
|
|
|
#ifndef ROCKSDB_LITE
|
|
|
|
|
options.ttl = FLAGS_fifo_compaction_ttl;
|
|
|
|
|
options.compaction_options_fifo = CompactionOptionsFIFO(
|
|
|
|
|
FLAGS_fifo_compaction_max_table_files_size_mb * 1024 * 1024,
|
|
|
|
|
FLAGS_fifo_compaction_allow_compaction);
|
|
|
|
|
options.compaction_options_fifo.age_for_warm = FLAGS_fifo_age_for_warm;
|
|
|
|
|
#endif // ROCKSDB_LITE
|
|
|
|
|
if (FLAGS_prefix_size != 0) {
|
|
|
|
|
options.prefix_extractor.reset(
|
|
|
|
|
NewFixedPrefixTransform(FLAGS_prefix_size));
|
|
|
|
|
}
|
|
|
|
|
if (FLAGS_use_uint64_comparator) {
|
|
|
|
|
options.comparator = test::Uint64Comparator();
|
|
|
|
|
if (FLAGS_key_size != 8) {
|
|
|
|
|
fprintf(stderr, "Using Uint64 comparator but key size is not 8.\n");
|
|
|
|
|
exit(1);
|
|
|
|
|
}
|
|
|
|
|
}
|
|
|
|
|
if (FLAGS_use_stderr_info_logger) {
|
|
|
|
|
options.info_log.reset(new StderrLogger());
|
|
|
|
|
}
|
|
|
|
|
options.memtable_huge_page_size = FLAGS_memtable_use_huge_page ? 2048 : 0;
|
|
|
|
|
options.memtable_prefix_bloom_size_ratio = FLAGS_memtable_bloom_size_ratio;
|
|
|
|
|
options.memtable_whole_key_filtering = FLAGS_memtable_whole_key_filtering;
|
|
|
|
|
if (FLAGS_memtable_insert_with_hint_prefix_size > 0) {
|
|
|
|
|
options.memtable_insert_with_hint_prefix_extractor.reset(
|
|
|
|
|
NewCappedPrefixTransform(
|
|
|
|
|
FLAGS_memtable_insert_with_hint_prefix_size));
|
|
|
|
|
}
|
|
|
|
|
options.bloom_locality = FLAGS_bloom_locality;
|
|
|
|
|
options.max_file_opening_threads = FLAGS_file_opening_threads;
|
|
|
|
|
options.compaction_readahead_size = FLAGS_compaction_readahead_size;
|
|
|
|
|
options.log_readahead_size = FLAGS_log_readahead_size;
|
|
|
|
|
options.random_access_max_buffer_size = FLAGS_random_access_max_buffer_size;
|
|
|
|
|
options.writable_file_max_buffer_size = FLAGS_writable_file_max_buffer_size;
|
|
|
|
|
options.use_fsync = FLAGS_use_fsync;
|
|
|
|
|
options.num_levels = FLAGS_num_levels;
|
|
|
|
|
options.target_file_size_base = FLAGS_target_file_size_base;
|
|
|
|
|
options.target_file_size_multiplier = FLAGS_target_file_size_multiplier;
|
|
|
|
|
options.max_bytes_for_level_base = FLAGS_max_bytes_for_level_base;
|
options.level_compaction_dynamic_level_bytes to allow RocksDB to pick size bases of levels dynamically.
Summary:
When having fixed max_bytes_for_level_base, the ratio of size of largest level and the second one can range from 0 to the multiplier. This makes LSM tree frequently irregular and unpredictable. It can also cause poor space amplification in some cases.
In this improvement (proposed by Igor Kabiljo), we introduce a parameter option.level_compaction_use_dynamic_max_bytes. When turning it on, RocksDB is free to pick a level base in the range of (options.max_bytes_for_level_base/options.max_bytes_for_level_multiplier, options.max_bytes_for_level_base] so that real level ratios are close to options.max_bytes_for_level_multiplier.
Test Plan: New unit tests and pass tests suites including valgrind.
Reviewers: MarkCallaghan, rven, yhchiang, igor, ikabiljo
Reviewed By: ikabiljo
Subscribers: yoshinorim, ikabiljo, dhruba, leveldb
Differential Revision: https://reviews.facebook.net/D31437
10 years ago
|
|
|
options.level_compaction_dynamic_level_bytes =
|
|
|
|
|
FLAGS_level_compaction_dynamic_level_bytes;
|
|
|
|
|
options.max_bytes_for_level_multiplier =
|
|
|
|
|
FLAGS_max_bytes_for_level_multiplier;
|
|
|
|
|
Status s =
|
|
|
|
|
CreateMemTableRepFactory(config_options, &options.memtable_factory);
|
|
|
|
|
if (!s.ok()) {
|
|
|
|
|
fprintf(stderr, "Could not create memtable factory: %s\n",
|
|
|
|
|
s.ToString().c_str());
|
|
|
|
|
exit(1);
|
|
|
|
|
} else if ((FLAGS_prefix_size == 0) &&
|
|
|
|
|
(options.memtable_factory->IsInstanceOf("prefix_hash") ||
|
|
|
|
|
options.memtable_factory->IsInstanceOf("hash_linkedlist"))) {
|
|
|
|
|
fprintf(stderr, "prefix_size should be non-zero if PrefixHash or "
|
|
|
|
|
"HashLinkedList memtablerep is used\n");
|
|
|
|
|
exit(1);
|
|
|
|
|
}
|
|
|
|
|
if (FLAGS_use_plain_table) {
|
|
|
|
|
#ifndef ROCKSDB_LITE
|
|
|
|
|
if (!options.memtable_factory->IsInstanceOf("prefix_hash") &&
|
|
|
|
|
!options.memtable_factory->IsInstanceOf("hash_linkedlist")) {
|
|
|
|
|
fprintf(stderr, "Warning: plain table is used with %s\n",
|
|
|
|
|
options.memtable_factory->Name());
|
|
|
|
|
}
|
|
|
|
|
|
|
|
|
|
int bloom_bits_per_key = FLAGS_bloom_bits;
|
|
|
|
|
if (bloom_bits_per_key < 0) {
|
|
|
|
|
bloom_bits_per_key = PlainTableOptions().bloom_bits_per_key;
|
|
|
|
|
}
|
|
|
|
|
|
|
|
|
|
PlainTableOptions plain_table_options;
|
|
|
|
|
plain_table_options.user_key_len = FLAGS_key_size;
|
|
|
|
|
plain_table_options.bloom_bits_per_key = bloom_bits_per_key;
|
|
|
|
|
plain_table_options.hash_table_ratio = 0.75;
|
|
|
|
|
options.table_factory = std::shared_ptr<TableFactory>(
|
|
|
|
|
NewPlainTableFactory(plain_table_options));
|
|
|
|
|
#else
|
|
|
|
|
fprintf(stderr, "Plain table is not supported in lite mode\n");
|
|
|
|
|
exit(1);
|
|
|
|
|
#endif // ROCKSDB_LITE
|
|
|
|
|
} else if (FLAGS_use_cuckoo_table) {
|
|
|
|
|
#ifndef ROCKSDB_LITE
|
|
|
|
|
if (FLAGS_cuckoo_hash_ratio > 1 || FLAGS_cuckoo_hash_ratio < 0) {
|
|
|
|
|
fprintf(stderr, "Invalid cuckoo_hash_ratio\n");
|
|
|
|
|
exit(1);
|
|
|
|
|
}
|
|
|
|
|
|
|
|
|
|
if (!FLAGS_mmap_read) {
|
|
|
|
|
fprintf(stderr, "cuckoo table format requires mmap read to operate\n");
|
|
|
|
|
exit(1);
|
|
|
|
|
}
|
|
|
|
|
|
|
|
|
|
ROCKSDB_NAMESPACE::CuckooTableOptions table_options;
|
CuckooTable: add one option to allow identity function for the first hash function
Summary:
MurmurHash becomes expensive when we do millions Get() a second in one
thread. Add this option to allow the first hash function to use identity
function as hash function. It results in QPS increase from 3.7M/s to
~4.3M/s. I did not observe improvement for end to end RocksDB
performance. This may be caused by other bottlenecks that I will address
in a separate diff.
Test Plan:
```
[ljin@dev1964 rocksdb] ./cuckoo_table_reader_test --enable_perf --file_dir=/dev/shm --write --identity_as_first_hash=0
==== Test CuckooReaderTest.WhenKeyExists
==== Test CuckooReaderTest.WhenKeyExistsWithUint64Comparator
==== Test CuckooReaderTest.CheckIterator
==== Test CuckooReaderTest.CheckIteratorUint64
==== Test CuckooReaderTest.WhenKeyNotFound
==== Test CuckooReaderTest.TestReadPerformance
With 125829120 items, utilization is 93.75%, number of hash functions: 2.
Time taken per op is 0.272us (3.7 Mqps) with batch size of 0, # of found keys 125829120
With 125829120 items, utilization is 93.75%, number of hash functions: 2.
Time taken per op is 0.138us (7.2 Mqps) with batch size of 10, # of found keys 125829120
With 125829120 items, utilization is 93.75%, number of hash functions: 2.
Time taken per op is 0.142us (7.1 Mqps) with batch size of 25, # of found keys 125829120
With 125829120 items, utilization is 93.75%, number of hash functions: 2.
Time taken per op is 0.142us (7.0 Mqps) with batch size of 50, # of found keys 125829120
With 125829120 items, utilization is 93.75%, number of hash functions: 2.
Time taken per op is 0.144us (6.9 Mqps) with batch size of 100, # of found keys 125829120
With 104857600 items, utilization is 78.12%, number of hash functions: 2.
Time taken per op is 0.201us (5.0 Mqps) with batch size of 0, # of found keys 104857600
With 104857600 items, utilization is 78.12%, number of hash functions: 2.
Time taken per op is 0.121us (8.3 Mqps) with batch size of 10, # of found keys 104857600
With 104857600 items, utilization is 78.12%, number of hash functions: 2.
Time taken per op is 0.123us (8.1 Mqps) with batch size of 25, # of found keys 104857600
With 104857600 items, utilization is 78.12%, number of hash functions: 2.
Time taken per op is 0.121us (8.3 Mqps) with batch size of 50, # of found keys 104857600
With 104857600 items, utilization is 78.12%, number of hash functions: 2.
Time taken per op is 0.112us (8.9 Mqps) with batch size of 100, # of found keys 104857600
With 83886080 items, utilization is 62.50%, number of hash functions: 2.
Time taken per op is 0.251us (4.0 Mqps) with batch size of 0, # of found keys 83886080
With 83886080 items, utilization is 62.50%, number of hash functions: 2.
Time taken per op is 0.107us (9.4 Mqps) with batch size of 10, # of found keys 83886080
With 83886080 items, utilization is 62.50%, number of hash functions: 2.
Time taken per op is 0.099us (10.1 Mqps) with batch size of 25, # of found keys 83886080
With 83886080 items, utilization is 62.50%, number of hash functions: 2.
Time taken per op is 0.100us (10.0 Mqps) with batch size of 50, # of found keys 83886080
With 83886080 items, utilization is 62.50%, number of hash functions: 2.
Time taken per op is 0.116us (8.6 Mqps) with batch size of 100, # of found keys 83886080
With 73400320 items, utilization is 54.69%, number of hash functions: 2.
Time taken per op is 0.189us (5.3 Mqps) with batch size of 0, # of found keys 73400320
With 73400320 items, utilization is 54.69%, number of hash functions: 2.
Time taken per op is 0.095us (10.5 Mqps) with batch size of 10, # of found keys 73400320
With 73400320 items, utilization is 54.69%, number of hash functions: 2.
Time taken per op is 0.096us (10.4 Mqps) with batch size of 25, # of found keys 73400320
With 73400320 items, utilization is 54.69%, number of hash functions: 2.
Time taken per op is 0.098us (10.2 Mqps) with batch size of 50, # of found keys 73400320
With 73400320 items, utilization is 54.69%, number of hash functions: 2.
Time taken per op is 0.105us (9.5 Mqps) with batch size of 100, # of found keys 73400320
[ljin@dev1964 rocksdb] ./cuckoo_table_reader_test --enable_perf --file_dir=/dev/shm --write --identity_as_first_hash=1
==== Test CuckooReaderTest.WhenKeyExists
==== Test CuckooReaderTest.WhenKeyExistsWithUint64Comparator
==== Test CuckooReaderTest.CheckIterator
==== Test CuckooReaderTest.CheckIteratorUint64
==== Test CuckooReaderTest.WhenKeyNotFound
==== Test CuckooReaderTest.TestReadPerformance
With 125829120 items, utilization is 93.75%, number of hash functions: 2.
Time taken per op is 0.230us (4.3 Mqps) with batch size of 0, # of found keys 125829120
With 125829120 items, utilization is 93.75%, number of hash functions: 2.
Time taken per op is 0.086us (11.7 Mqps) with batch size of 10, # of found keys 125829120
With 125829120 items, utilization is 93.75%, number of hash functions: 2.
Time taken per op is 0.088us (11.3 Mqps) with batch size of 25, # of found keys 125829120
With 125829120 items, utilization is 93.75%, number of hash functions: 2.
Time taken per op is 0.083us (12.1 Mqps) with batch size of 50, # of found keys 125829120
With 125829120 items, utilization is 93.75%, number of hash functions: 2.
Time taken per op is 0.083us (12.1 Mqps) with batch size of 100, # of found keys 125829120
With 104857600 items, utilization is 78.12%, number of hash functions: 2.
Time taken per op is 0.159us (6.3 Mqps) with batch size of 0, # of found keys 104857600
With 104857600 items, utilization is 78.12%, number of hash functions: 2.
Time taken per op is 0.078us (12.8 Mqps) with batch size of 10, # of found keys 104857600
With 104857600 items, utilization is 78.12%, number of hash functions: 2.
Time taken per op is 0.080us (12.6 Mqps) with batch size of 25, # of found keys 104857600
With 104857600 items, utilization is 78.12%, number of hash functions: 2.
Time taken per op is 0.080us (12.5 Mqps) with batch size of 50, # of found keys 104857600
With 104857600 items, utilization is 78.12%, number of hash functions: 2.
Time taken per op is 0.082us (12.2 Mqps) with batch size of 100, # of found keys 104857600
With 83886080 items, utilization is 62.50%, number of hash functions: 2.
Time taken per op is 0.154us (6.5 Mqps) with batch size of 0, # of found keys 83886080
With 83886080 items, utilization is 62.50%, number of hash functions: 2.
Time taken per op is 0.077us (13.0 Mqps) with batch size of 10, # of found keys 83886080
With 83886080 items, utilization is 62.50%, number of hash functions: 2.
Time taken per op is 0.077us (12.9 Mqps) with batch size of 25, # of found keys 83886080
With 83886080 items, utilization is 62.50%, number of hash functions: 2.
Time taken per op is 0.078us (12.8 Mqps) with batch size of 50, # of found keys 83886080
With 83886080 items, utilization is 62.50%, number of hash functions: 2.
Time taken per op is 0.079us (12.6 Mqps) with batch size of 100, # of found keys 83886080
With 73400320 items, utilization is 54.69%, number of hash functions: 2.
Time taken per op is 0.218us (4.6 Mqps) with batch size of 0, # of found keys 73400320
With 73400320 items, utilization is 54.69%, number of hash functions: 2.
Time taken per op is 0.083us (12.0 Mqps) with batch size of 10, # of found keys 73400320
With 73400320 items, utilization is 54.69%, number of hash functions: 2.
Time taken per op is 0.085us (11.7 Mqps) with batch size of 25, # of found keys 73400320
With 73400320 items, utilization is 54.69%, number of hash functions: 2.
Time taken per op is 0.086us (11.6 Mqps) with batch size of 50, # of found keys 73400320
With 73400320 items, utilization is 54.69%, number of hash functions: 2.
Time taken per op is 0.078us (12.8 Mqps) with batch size of 100, # of found keys 73400320
```
Reviewers: sdong, igor, yhchiang
Reviewed By: igor
Subscribers: leveldb
Differential Revision: https://reviews.facebook.net/D23451
10 years ago
|
|
|
table_options.hash_table_ratio = FLAGS_cuckoo_hash_ratio;
|
|
|
|
|
table_options.identity_as_first_hash = FLAGS_identity_as_first_hash;
|
|
|
|
|
options.table_factory = std::shared_ptr<TableFactory>(
|
CuckooTable: add one option to allow identity function for the first hash function
Summary:
MurmurHash becomes expensive when we do millions Get() a second in one
thread. Add this option to allow the first hash function to use identity
function as hash function. It results in QPS increase from 3.7M/s to
~4.3M/s. I did not observe improvement for end to end RocksDB
performance. This may be caused by other bottlenecks that I will address
in a separate diff.
Test Plan:
```
[ljin@dev1964 rocksdb] ./cuckoo_table_reader_test --enable_perf --file_dir=/dev/shm --write --identity_as_first_hash=0
==== Test CuckooReaderTest.WhenKeyExists
==== Test CuckooReaderTest.WhenKeyExistsWithUint64Comparator
==== Test CuckooReaderTest.CheckIterator
==== Test CuckooReaderTest.CheckIteratorUint64
==== Test CuckooReaderTest.WhenKeyNotFound
==== Test CuckooReaderTest.TestReadPerformance
With 125829120 items, utilization is 93.75%, number of hash functions: 2.
Time taken per op is 0.272us (3.7 Mqps) with batch size of 0, # of found keys 125829120
With 125829120 items, utilization is 93.75%, number of hash functions: 2.
Time taken per op is 0.138us (7.2 Mqps) with batch size of 10, # of found keys 125829120
With 125829120 items, utilization is 93.75%, number of hash functions: 2.
Time taken per op is 0.142us (7.1 Mqps) with batch size of 25, # of found keys 125829120
With 125829120 items, utilization is 93.75%, number of hash functions: 2.
Time taken per op is 0.142us (7.0 Mqps) with batch size of 50, # of found keys 125829120
With 125829120 items, utilization is 93.75%, number of hash functions: 2.
Time taken per op is 0.144us (6.9 Mqps) with batch size of 100, # of found keys 125829120
With 104857600 items, utilization is 78.12%, number of hash functions: 2.
Time taken per op is 0.201us (5.0 Mqps) with batch size of 0, # of found keys 104857600
With 104857600 items, utilization is 78.12%, number of hash functions: 2.
Time taken per op is 0.121us (8.3 Mqps) with batch size of 10, # of found keys 104857600
With 104857600 items, utilization is 78.12%, number of hash functions: 2.
Time taken per op is 0.123us (8.1 Mqps) with batch size of 25, # of found keys 104857600
With 104857600 items, utilization is 78.12%, number of hash functions: 2.
Time taken per op is 0.121us (8.3 Mqps) with batch size of 50, # of found keys 104857600
With 104857600 items, utilization is 78.12%, number of hash functions: 2.
Time taken per op is 0.112us (8.9 Mqps) with batch size of 100, # of found keys 104857600
With 83886080 items, utilization is 62.50%, number of hash functions: 2.
Time taken per op is 0.251us (4.0 Mqps) with batch size of 0, # of found keys 83886080
With 83886080 items, utilization is 62.50%, number of hash functions: 2.
Time taken per op is 0.107us (9.4 Mqps) with batch size of 10, # of found keys 83886080
With 83886080 items, utilization is 62.50%, number of hash functions: 2.
Time taken per op is 0.099us (10.1 Mqps) with batch size of 25, # of found keys 83886080
With 83886080 items, utilization is 62.50%, number of hash functions: 2.
Time taken per op is 0.100us (10.0 Mqps) with batch size of 50, # of found keys 83886080
With 83886080 items, utilization is 62.50%, number of hash functions: 2.
Time taken per op is 0.116us (8.6 Mqps) with batch size of 100, # of found keys 83886080
With 73400320 items, utilization is 54.69%, number of hash functions: 2.
Time taken per op is 0.189us (5.3 Mqps) with batch size of 0, # of found keys 73400320
With 73400320 items, utilization is 54.69%, number of hash functions: 2.
Time taken per op is 0.095us (10.5 Mqps) with batch size of 10, # of found keys 73400320
With 73400320 items, utilization is 54.69%, number of hash functions: 2.
Time taken per op is 0.096us (10.4 Mqps) with batch size of 25, # of found keys 73400320
With 73400320 items, utilization is 54.69%, number of hash functions: 2.
Time taken per op is 0.098us (10.2 Mqps) with batch size of 50, # of found keys 73400320
With 73400320 items, utilization is 54.69%, number of hash functions: 2.
Time taken per op is 0.105us (9.5 Mqps) with batch size of 100, # of found keys 73400320
[ljin@dev1964 rocksdb] ./cuckoo_table_reader_test --enable_perf --file_dir=/dev/shm --write --identity_as_first_hash=1
==== Test CuckooReaderTest.WhenKeyExists
==== Test CuckooReaderTest.WhenKeyExistsWithUint64Comparator
==== Test CuckooReaderTest.CheckIterator
==== Test CuckooReaderTest.CheckIteratorUint64
==== Test CuckooReaderTest.WhenKeyNotFound
==== Test CuckooReaderTest.TestReadPerformance
With 125829120 items, utilization is 93.75%, number of hash functions: 2.
Time taken per op is 0.230us (4.3 Mqps) with batch size of 0, # of found keys 125829120
With 125829120 items, utilization is 93.75%, number of hash functions: 2.
Time taken per op is 0.086us (11.7 Mqps) with batch size of 10, # of found keys 125829120
With 125829120 items, utilization is 93.75%, number of hash functions: 2.
Time taken per op is 0.088us (11.3 Mqps) with batch size of 25, # of found keys 125829120
With 125829120 items, utilization is 93.75%, number of hash functions: 2.
Time taken per op is 0.083us (12.1 Mqps) with batch size of 50, # of found keys 125829120
With 125829120 items, utilization is 93.75%, number of hash functions: 2.
Time taken per op is 0.083us (12.1 Mqps) with batch size of 100, # of found keys 125829120
With 104857600 items, utilization is 78.12%, number of hash functions: 2.
Time taken per op is 0.159us (6.3 Mqps) with batch size of 0, # of found keys 104857600
With 104857600 items, utilization is 78.12%, number of hash functions: 2.
Time taken per op is 0.078us (12.8 Mqps) with batch size of 10, # of found keys 104857600
With 104857600 items, utilization is 78.12%, number of hash functions: 2.
Time taken per op is 0.080us (12.6 Mqps) with batch size of 25, # of found keys 104857600
With 104857600 items, utilization is 78.12%, number of hash functions: 2.
Time taken per op is 0.080us (12.5 Mqps) with batch size of 50, # of found keys 104857600
With 104857600 items, utilization is 78.12%, number of hash functions: 2.
Time taken per op is 0.082us (12.2 Mqps) with batch size of 100, # of found keys 104857600
With 83886080 items, utilization is 62.50%, number of hash functions: 2.
Time taken per op is 0.154us (6.5 Mqps) with batch size of 0, # of found keys 83886080
With 83886080 items, utilization is 62.50%, number of hash functions: 2.
Time taken per op is 0.077us (13.0 Mqps) with batch size of 10, # of found keys 83886080
With 83886080 items, utilization is 62.50%, number of hash functions: 2.
Time taken per op is 0.077us (12.9 Mqps) with batch size of 25, # of found keys 83886080
With 83886080 items, utilization is 62.50%, number of hash functions: 2.
Time taken per op is 0.078us (12.8 Mqps) with batch size of 50, # of found keys 83886080
With 83886080 items, utilization is 62.50%, number of hash functions: 2.
Time taken per op is 0.079us (12.6 Mqps) with batch size of 100, # of found keys 83886080
With 73400320 items, utilization is 54.69%, number of hash functions: 2.
Time taken per op is 0.218us (4.6 Mqps) with batch size of 0, # of found keys 73400320
With 73400320 items, utilization is 54.69%, number of hash functions: 2.
Time taken per op is 0.083us (12.0 Mqps) with batch size of 10, # of found keys 73400320
With 73400320 items, utilization is 54.69%, number of hash functions: 2.
Time taken per op is 0.085us (11.7 Mqps) with batch size of 25, # of found keys 73400320
With 73400320 items, utilization is 54.69%, number of hash functions: 2.
Time taken per op is 0.086us (11.6 Mqps) with batch size of 50, # of found keys 73400320
With 73400320 items, utilization is 54.69%, number of hash functions: 2.
Time taken per op is 0.078us (12.8 Mqps) with batch size of 100, # of found keys 73400320
```
Reviewers: sdong, igor, yhchiang
Reviewed By: igor
Subscribers: leveldb
Differential Revision: https://reviews.facebook.net/D23451
10 years ago
|
|
|
NewCuckooTableFactory(table_options));
|
|
|
|
|
#else
|
|
|
|
|
fprintf(stderr, "Cuckoo table is not supported in lite mode\n");
|
|
|
|
|
exit(1);
|
|
|
|
|
#endif // ROCKSDB_LITE
|
|
|
|
|
} else {
|
|
|
|
|
BlockBasedTableOptions block_based_options;
|
Implement XXH3 block checksum type (#9069)
Summary:
XXH3 - latest hash function that is extremely fast on large
data, easily faster than crc32c on most any x86_64 hardware. In
integrating this hash function, I have handled the compression type byte
in a non-standard way to avoid using the streaming API (extra data
movement and active code size because of hash function complexity). This
approach got a thumbs-up from Yann Collet.
Existing functionality change:
* reject bad ChecksumType in options with InvalidArgument
This change split off from https://github.com/facebook/rocksdb/issues/9058 because context-aware checksum is
likely to be handled through different configuration than ChecksumType.
Pull Request resolved: https://github.com/facebook/rocksdb/pull/9069
Test Plan:
tests updated, and substantially expanded. Unit tests now check
that we don't accidentally change the values generated by the checksum
algorithms ("schema test") and that we properly handle
invalid/unrecognized checksum types in options or in file footer.
DBTestBase::ChangeOptions (etc.) updated from two to one configuration
changing from default CRC32c ChecksumType. The point of this test code
is to detect possible interactions among features, and the likelihood of
some bad interaction being detected by including configurations other
than XXH3 and CRC32c--and then not detected by stress/crash test--is
extremely low.
Stress/crash test also updated (manual run long enough to see it accepts
new checksum type). db_bench also updated for microbenchmarking
checksums.
### Performance microbenchmark (PORTABLE=0 DEBUG_LEVEL=0, Broadwell processor)
./db_bench -benchmarks=crc32c,xxhash,xxhash64,xxh3,crc32c,xxhash,xxhash64,xxh3,crc32c,xxhash,xxhash64,xxh3
crc32c : 0.200 micros/op 5005220 ops/sec; 19551.6 MB/s (4096 per op)
xxhash : 0.807 micros/op 1238408 ops/sec; 4837.5 MB/s (4096 per op)
xxhash64 : 0.421 micros/op 2376514 ops/sec; 9283.3 MB/s (4096 per op)
xxh3 : 0.171 micros/op 5858391 ops/sec; 22884.3 MB/s (4096 per op)
crc32c : 0.206 micros/op 4859566 ops/sec; 18982.7 MB/s (4096 per op)
xxhash : 0.793 micros/op 1260850 ops/sec; 4925.2 MB/s (4096 per op)
xxhash64 : 0.410 micros/op 2439182 ops/sec; 9528.1 MB/s (4096 per op)
xxh3 : 0.161 micros/op 6202872 ops/sec; 24230.0 MB/s (4096 per op)
crc32c : 0.203 micros/op 4924686 ops/sec; 19237.1 MB/s (4096 per op)
xxhash : 0.839 micros/op 1192388 ops/sec; 4657.8 MB/s (4096 per op)
xxhash64 : 0.424 micros/op 2357391 ops/sec; 9208.6 MB/s (4096 per op)
xxh3 : 0.162 micros/op 6182678 ops/sec; 24151.1 MB/s (4096 per op)
As you can see, especially once warmed up, xxh3 is fastest.
### Performance macrobenchmark (PORTABLE=0 DEBUG_LEVEL=0, Broadwell processor)
Test
for I in `seq 1 50`; do for CHK in 0 1 2 3 4; do TEST_TMPDIR=/dev/shm/rocksdb$CHK ./db_bench -benchmarks=fillseq -memtablerep=vector -allow_concurrent_memtable_write=false -num=30000000 -checksum_type=$CHK 2>&1 | grep 'micros/op' | tee -a results-$CHK & done; wait; done
Results (ops/sec)
for FILE in results*; do echo -n "$FILE "; awk '{ s += $5; c++; } END { print 1.0 * s / c; }' < $FILE; done
results-0 252118 # kNoChecksum
results-1 251588 # kCRC32c
results-2 251863 # kxxHash
results-3 252016 # kxxHash64
results-4 252038 # kXXH3
Reviewed By: mrambacher
Differential Revision: D31905249
Pulled By: pdillinger
fbshipit-source-id: cb9b998ebe2523fc7c400eedf62124a78bf4b4d1
3 years ago
|
|
|
block_based_options.checksum =
|
|
|
|
|
static_cast<ChecksumType>(FLAGS_checksum_type);
|
|
|
|
|
if (FLAGS_use_hash_search) {
|
|
|
|
|
if (FLAGS_prefix_size == 0) {
|
|
|
|
|
fprintf(stderr,
|
|
|
|
|
"prefix_size not assigned when enable use_hash_search \n");
|
|
|
|
|
exit(1);
|
|
|
|
|
}
|
|
|
|
|
block_based_options.index_type = BlockBasedTableOptions::kHashSearch;
|
|
|
|
|
} else {
|
|
|
|
|
block_based_options.index_type = BlockBasedTableOptions::kBinarySearch;
|
|
|
|
|
}
|
|
|
|
|
if (FLAGS_partition_index_and_filters || FLAGS_partition_index) {
|
|
|
|
|
if (FLAGS_index_with_first_key) {
|
|
|
|
|
fprintf(stderr,
|
|
|
|
|
"--index_with_first_key is not compatible with"
|
|
|
|
|
" partition index.");
|
|
|
|
|
}
|
|
|
|
|
if (FLAGS_use_hash_search) {
|
|
|
|
|
fprintf(stderr,
|
|
|
|
|
"use_hash_search is incompatible with "
|
|
|
|
|
"partition index and is ignored");
|
|
|
|
|
}
|
|
|
|
|
block_based_options.index_type =
|
|
|
|
|
BlockBasedTableOptions::kTwoLevelIndexSearch;
|
|
|
|
|
block_based_options.metadata_block_size = FLAGS_metadata_block_size;
|
|
|
|
|
if (FLAGS_partition_index_and_filters) {
|
|
|
|
|
block_based_options.partition_filters = true;
|
|
|
|
|
}
|
|
|
|
|
} else if (FLAGS_index_with_first_key) {
|
|
|
|
|
block_based_options.index_type =
|
|
|
|
|
BlockBasedTableOptions::kBinarySearchWithFirstKey;
|
|
|
|
|
}
|
|
|
|
|
BlockBasedTableOptions::IndexShorteningMode index_shortening =
|
|
|
|
|
block_based_options.index_shortening;
|
|
|
|
|
switch (FLAGS_index_shortening_mode) {
|
|
|
|
|
case 0:
|
|
|
|
|
index_shortening =
|
|
|
|
|
BlockBasedTableOptions::IndexShorteningMode::kNoShortening;
|
|
|
|
|
break;
|
|
|
|
|
case 1:
|
|
|
|
|
index_shortening =
|
|
|
|
|
BlockBasedTableOptions::IndexShorteningMode::kShortenSeparators;
|
|
|
|
|
break;
|
|
|
|
|
case 2:
|
|
|
|
|
index_shortening = BlockBasedTableOptions::IndexShorteningMode::
|
|
|
|
|
kShortenSeparatorsAndSuccessor;
|
|
|
|
|
break;
|
|
|
|
|
default:
|
|
|
|
|
fprintf(stderr, "Unknown key shortening mode\n");
|
|
|
|
|
}
|
Minimize memory internal fragmentation for Bloom filters (#6427)
Summary:
New experimental option BBTO::optimize_filters_for_memory builds
filters that maximize their use of "usable size" from malloc_usable_size,
which is also used to compute block cache charges.
Rather than always "rounding up," we track state in the
BloomFilterPolicy object to mix essentially "rounding down" and
"rounding up" so that the average FP rate of all generated filters is
the same as without the option. (YMMV as heavily accessed filters might
be unluckily lower accuracy.)
Thus, the option near-minimizes what the block cache considers as
"memory used" for a given target Bloom filter false positive rate and
Bloom filter implementation. There are no forward or backward
compatibility issues with this change, though it only works on the
format_version=5 Bloom filter.
With Jemalloc, we see about 10% reduction in memory footprint (and block
cache charge) for Bloom filters, but 1-2% increase in storage footprint,
due to encoding efficiency losses (FP rate is non-linear with bits/key).
Why not weighted random round up/down rather than state tracking? By
only requiring malloc_usable_size, we don't actually know what the next
larger and next smaller usable sizes for the allocator are. We pick a
requested size, accept and use whatever usable size it has, and use the
difference to inform our next choice. This allows us to narrow in on the
right balance without tracking/predicting usable sizes.
Why not weight history of generated filter false positive rates by
number of keys? This could lead to excess skew in small filters after
generating a large filter.
Results from filter_bench with jemalloc (irrelevant details omitted):
(normal keys/filter, but high variance)
$ ./filter_bench -quick -impl=2 -average_keys_per_filter=30000 -vary_key_count_ratio=0.9
Build avg ns/key: 29.6278
Number of filters: 5516
Total size (MB): 200.046
Reported total allocated memory (MB): 220.597
Reported internal fragmentation: 10.2732%
Bits/key stored: 10.0097
Average FP rate %: 0.965228
$ ./filter_bench -quick -impl=2 -average_keys_per_filter=30000 -vary_key_count_ratio=0.9 -optimize_filters_for_memory
Build avg ns/key: 30.5104
Number of filters: 5464
Total size (MB): 200.015
Reported total allocated memory (MB): 200.322
Reported internal fragmentation: 0.153709%
Bits/key stored: 10.1011
Average FP rate %: 0.966313
(very few keys / filter, optimization not as effective due to ~59 byte
internal fragmentation in blocked Bloom filter representation)
$ ./filter_bench -quick -impl=2 -average_keys_per_filter=1000 -vary_key_count_ratio=0.9
Build avg ns/key: 29.5649
Number of filters: 162950
Total size (MB): 200.001
Reported total allocated memory (MB): 224.624
Reported internal fragmentation: 12.3117%
Bits/key stored: 10.2951
Average FP rate %: 0.821534
$ ./filter_bench -quick -impl=2 -average_keys_per_filter=1000 -vary_key_count_ratio=0.9 -optimize_filters_for_memory
Build avg ns/key: 31.8057
Number of filters: 159849
Total size (MB): 200
Reported total allocated memory (MB): 208.846
Reported internal fragmentation: 4.42297%
Bits/key stored: 10.4948
Average FP rate %: 0.811006
(high keys/filter)
$ ./filter_bench -quick -impl=2 -average_keys_per_filter=1000000 -vary_key_count_ratio=0.9
Build avg ns/key: 29.7017
Number of filters: 164
Total size (MB): 200.352
Reported total allocated memory (MB): 221.5
Reported internal fragmentation: 10.5552%
Bits/key stored: 10.0003
Average FP rate %: 0.969358
$ ./filter_bench -quick -impl=2 -average_keys_per_filter=1000000 -vary_key_count_ratio=0.9 -optimize_filters_for_memory
Build avg ns/key: 30.7131
Number of filters: 160
Total size (MB): 200.928
Reported total allocated memory (MB): 200.938
Reported internal fragmentation: 0.00448054%
Bits/key stored: 10.1852
Average FP rate %: 0.963387
And from db_bench (block cache) with jemalloc:
$ ./db_bench -db=/dev/shm/dbbench.no_optimize -benchmarks=fillrandom -format_version=5 -value_size=90 -bloom_bits=10 -num=2000000 -threads=8 -compaction_style=2 -fifo_compaction_max_table_files_size_mb=10000 -fifo_compaction_allow_compaction=false
$ ./db_bench -db=/dev/shm/dbbench -benchmarks=fillrandom -format_version=5 -value_size=90 -bloom_bits=10 -num=2000000 -threads=8 -optimize_filters_for_memory -compaction_style=2 -fifo_compaction_max_table_files_size_mb=10000 -fifo_compaction_allow_compaction=false
$ (for FILE in /dev/shm/dbbench.no_optimize/*.sst; do ./sst_dump --file=$FILE --show_properties | grep 'filter block' ; done) | awk '{ t += $4; } END { print t; }'
17063835
$ (for FILE in /dev/shm/dbbench/*.sst; do ./sst_dump --file=$FILE --show_properties | grep 'filter block' ; done) | awk '{ t += $4; } END { print t; }'
17430747
$ #^ 2.1% additional filter storage
$ ./db_bench -db=/dev/shm/dbbench.no_optimize -use_existing_db -benchmarks=readrandom,stats -statistics -bloom_bits=10 -num=2000000 -compaction_style=2 -fifo_compaction_max_table_files_size_mb=10000 -fifo_compaction_allow_compaction=false -duration=10 -cache_index_and_filter_blocks -cache_size=1000000000
rocksdb.block.cache.index.add COUNT : 33
rocksdb.block.cache.index.bytes.insert COUNT : 8440400
rocksdb.block.cache.filter.add COUNT : 33
rocksdb.block.cache.filter.bytes.insert COUNT : 21087528
rocksdb.bloom.filter.useful COUNT : 4963889
rocksdb.bloom.filter.full.positive COUNT : 1214081
rocksdb.bloom.filter.full.true.positive COUNT : 1161999
$ #^ 1.04 % observed FP rate
$ ./db_bench -db=/dev/shm/dbbench -use_existing_db -benchmarks=readrandom,stats -statistics -bloom_bits=10 -num=2000000 -compaction_style=2 -fifo_compaction_max_table_files_size_mb=10000 -fifo_compaction_allow_compaction=false -optimize_filters_for_memory -duration=10 -cache_index_and_filter_blocks -cache_size=1000000000
rocksdb.block.cache.index.add COUNT : 33
rocksdb.block.cache.index.bytes.insert COUNT : 8448592
rocksdb.block.cache.filter.add COUNT : 33
rocksdb.block.cache.filter.bytes.insert COUNT : 18220328
rocksdb.bloom.filter.useful COUNT : 5360933
rocksdb.bloom.filter.full.positive COUNT : 1321315
rocksdb.bloom.filter.full.true.positive COUNT : 1262999
$ #^ 1.08 % observed FP rate, 13.6% less memory usage for filters
(Due to specific key density, this example tends to generate filters that are "worse than average" for internal fragmentation. "Better than average" cases can show little or no improvement.)
Pull Request resolved: https://github.com/facebook/rocksdb/pull/6427
Test Plan: unit test added, 'make check' with gcc, clang and valgrind
Reviewed By: siying
Differential Revision: D22124374
Pulled By: pdillinger
fbshipit-source-id: f3e3aa152f9043ddf4fae25799e76341d0d8714e
4 years ago
|
|
|
block_based_options.optimize_filters_for_memory =
|
|
|
|
|
FLAGS_optimize_filters_for_memory;
|
|
|
|
|
block_based_options.index_shortening = index_shortening;
|
|
|
|
|
if (cache_ == nullptr) {
|
|
|
|
|
block_based_options.no_block_cache = true;
|
|
|
|
|
}
|
|
|
|
|
block_based_options.cache_index_and_filter_blocks =
|
|
|
|
|
FLAGS_cache_index_and_filter_blocks;
|
Adding pin_l0_filter_and_index_blocks_in_cache feature and related fixes.
Summary:
When a block based table file is opened, if prefetch_index_and_filter is true, it will prefetch the index and filter blocks, putting them into the block cache.
What this feature adds: when a L0 block based table file is opened, if pin_l0_filter_and_index_blocks_in_cache is true in the options (and prefetch_index_and_filter is true), then the filter and index blocks aren't released back to the block cache at the end of BlockBasedTableReader::Open(). Instead the table reader takes ownership of them, hence pinning them, ie. the LRU cache will never push them out. Meanwhile in the table reader, further accesses will not hit the block cache, thus avoiding lock contention.
Test Plan:
'export TEST_TMPDIR=/dev/shm/ && DISABLE_JEMALLOC=1 OPT=-g make all valgrind_check -j32' is OK.
I didn't run the Java tests, I don't have Java set up on my devserver.
Reviewers: sdong
Reviewed By: sdong
Subscribers: andrewkr, dhruba
Differential Revision: https://reviews.facebook.net/D56133
8 years ago
|
|
|
block_based_options.pin_l0_filter_and_index_blocks_in_cache =
|
|
|
|
|
FLAGS_pin_l0_filter_and_index_blocks_in_cache;
|
|
|
|
|
block_based_options.pin_top_level_index_and_filter =
|
|
|
|
|
FLAGS_pin_top_level_index_and_filter;
|
|
|
|
|
if (FLAGS_cache_high_pri_pool_ratio > 1e-6) { // > 0.0 + eps
|
|
|
|
|
block_based_options.cache_index_and_filter_blocks_with_high_priority =
|
|
|
|
|
true;
|
|
|
|
|
}
|
|
|
|
|
block_based_options.block_cache = cache_;
|
|
|
|
|
block_based_options.reserve_table_reader_memory =
|
|
|
|
|
FLAGS_reserve_table_reader_memory;
|
|
|
|
|
block_based_options.block_cache_compressed = compressed_cache_;
|
|
|
|
|
block_based_options.block_size = FLAGS_block_size;
|
|
|
|
|
block_based_options.block_restart_interval = FLAGS_block_restart_interval;
|
|
|
|
|
block_based_options.index_block_restart_interval =
|
|
|
|
|
FLAGS_index_block_restart_interval;
|
|
|
|
|
block_based_options.format_version =
|
|
|
|
|
static_cast<uint32_t>(FLAGS_format_version);
|
|
|
|
|
block_based_options.read_amp_bytes_per_bit = FLAGS_read_amp_bytes_per_bit;
|
|
|
|
|
block_based_options.enable_index_compression =
|
|
|
|
|
FLAGS_enable_index_compression;
|
|
|
|
|
block_based_options.block_align = FLAGS_block_align;
|
|
|
|
|
block_based_options.whole_key_filtering = FLAGS_whole_key_filtering;
|
|
|
|
|
BlockBasedTableOptions::PrepopulateBlockCache prepopulate_block_cache =
|
|
|
|
|
block_based_options.prepopulate_block_cache;
|
|
|
|
|
switch (FLAGS_prepopulate_block_cache) {
|
|
|
|
|
case 0:
|
|
|
|
|
prepopulate_block_cache =
|
|
|
|
|
BlockBasedTableOptions::PrepopulateBlockCache::kDisable;
|
|
|
|
|
break;
|
|
|
|
|
case 1:
|
|
|
|
|
prepopulate_block_cache =
|
|
|
|
|
BlockBasedTableOptions::PrepopulateBlockCache::kFlushOnly;
|
|
|
|
|
break;
|
|
|
|
|
default:
|
|
|
|
|
fprintf(stderr, "Unknown prepopulate block cache mode\n");
|
|
|
|
|
}
|
|
|
|
|
block_based_options.prepopulate_block_cache = prepopulate_block_cache;
|
|
|
|
|
if (FLAGS_use_data_block_hash_index) {
|
|
|
|
|
block_based_options.data_block_index_type =
|
|
|
|
|
ROCKSDB_NAMESPACE::BlockBasedTableOptions::kDataBlockBinaryAndHash;
|
|
|
|
|
} else {
|
|
|
|
|
block_based_options.data_block_index_type =
|
|
|
|
|
ROCKSDB_NAMESPACE::BlockBasedTableOptions::kDataBlockBinarySearch;
|
|
|
|
|
}
|
|
|
|
|
block_based_options.data_block_hash_table_util_ratio =
|
|
|
|
|
FLAGS_data_block_hash_table_util_ratio;
|
|
|
|
|
if (FLAGS_read_cache_path != "") {
|
|
|
|
|
#ifndef ROCKSDB_LITE
|
|
|
|
|
Status rc_status;
|
|
|
|
|
|
|
|
|
|
// Read cache need to be provided with a the Logger, we will put all
|
|
|
|
|
// reac cache logs in the read cache path in a file named rc_LOG
|
|
|
|
|
rc_status = FLAGS_env->CreateDirIfMissing(FLAGS_read_cache_path);
|
|
|
|
|
std::shared_ptr<Logger> read_cache_logger;
|
|
|
|
|
if (rc_status.ok()) {
|
|
|
|
|
rc_status = FLAGS_env->NewLogger(FLAGS_read_cache_path + "/rc_LOG",
|
|
|
|
|
&read_cache_logger);
|
|
|
|
|
}
|
|
|
|
|
|
|
|
|
|
if (rc_status.ok()) {
|
|
|
|
|
PersistentCacheConfig rc_cfg(FLAGS_env, FLAGS_read_cache_path,
|
|
|
|
|
FLAGS_read_cache_size,
|
|
|
|
|
read_cache_logger);
|
|
|
|
|
|
|
|
|
|
rc_cfg.enable_direct_reads = FLAGS_read_cache_direct_read;
|
|
|
|
|
rc_cfg.enable_direct_writes = FLAGS_read_cache_direct_write;
|
|
|
|
|
rc_cfg.writer_qdepth = 4;
|
|
|
|
|
rc_cfg.writer_dispatch_size = 4 * 1024;
|
|
|
|
|
|
|
|
|
|
auto pcache = std::make_shared<BlockCacheTier>(rc_cfg);
|
|
|
|
|
block_based_options.persistent_cache = pcache;
|
|
|
|
|
rc_status = pcache->Open();
|
|
|
|
|
}
|
|
|
|
|
|
|
|
|
|
if (!rc_status.ok()) {
|
|
|
|
|
fprintf(stderr, "Error initializing read cache, %s\n",
|
|
|
|
|
rc_status.ToString().c_str());
|
|
|
|
|
exit(1);
|
|
|
|
|
}
|
|
|
|
|
#else
|
|
|
|
|
fprintf(stderr, "Read cache is not supported in LITE\n");
|
|
|
|
|
exit(1);
|
|
|
|
|
|
|
|
|
|
#endif
|
|
|
|
|
}
|
|
|
|
|
options.table_factory.reset(
|
|
|
|
|
NewBlockBasedTableFactory(block_based_options));
|
|
|
|
|
}
|
|
|
|
|
if (FLAGS_max_bytes_for_level_multiplier_additional_v.size() > 0) {
|
|
|
|
|
if (FLAGS_max_bytes_for_level_multiplier_additional_v.size() !=
|
|
|
|
|
static_cast<unsigned int>(FLAGS_num_levels)) {
|
|
|
|
|
fprintf(stderr, "Insufficient number of fanouts specified %d\n",
|
|
|
|
|
static_cast<int>(
|
|
|
|
|
FLAGS_max_bytes_for_level_multiplier_additional_v.size()));
|
|
|
|
|
exit(1);
|
|
|
|
|
}
|
|
|
|
|
options.max_bytes_for_level_multiplier_additional =
|
|
|
|
|
FLAGS_max_bytes_for_level_multiplier_additional_v;
|
|
|
|
|
}
|
|
|
|
|
options.level0_stop_writes_trigger = FLAGS_level0_stop_writes_trigger;
|
|
|
|
|
options.level0_file_num_compaction_trigger =
|
|
|
|
|
FLAGS_level0_file_num_compaction_trigger;
|
|
|
|
|
options.level0_slowdown_writes_trigger =
|
|
|
|
|
FLAGS_level0_slowdown_writes_trigger;
|
|
|
|
|
options.compression = FLAGS_compression_type_e;
|
|
|
|
|
if (FLAGS_simulate_hybrid_fs_file != "") {
|
|
|
|
|
options.bottommost_temperature = Temperature::kWarm;
|
|
|
|
|
}
|
|
|
|
|
options.sample_for_compression = FLAGS_sample_for_compression;
|
|
|
|
|
options.WAL_ttl_seconds = FLAGS_wal_ttl_seconds;
|
|
|
|
|
options.WAL_size_limit_MB = FLAGS_wal_size_limit_MB;
|
|
|
|
|
options.max_total_wal_size = FLAGS_max_total_wal_size;
|
|
|
|
|
|
|
|
|
|
if (FLAGS_min_level_to_compress >= 0) {
|
|
|
|
|
assert(FLAGS_min_level_to_compress <= FLAGS_num_levels);
|
|
|
|
|
options.compression_per_level.resize(FLAGS_num_levels);
|
|
|
|
|
for (int i = 0; i < FLAGS_min_level_to_compress; i++) {
|
|
|
|
|
options.compression_per_level[i] = kNoCompression;
|
|
|
|
|
}
|
|
|
|
|
for (int i = FLAGS_min_level_to_compress;
|
|
|
|
|
i < FLAGS_num_levels; i++) {
|
|
|
|
|
options.compression_per_level[i] = FLAGS_compression_type_e;
|
|
|
|
|
}
|
|
|
|
|
}
|
|
|
|
|
options.soft_pending_compaction_bytes_limit =
|
|
|
|
|
FLAGS_soft_pending_compaction_bytes_limit;
|
|
|
|
|
options.hard_pending_compaction_bytes_limit =
|
|
|
|
|
FLAGS_hard_pending_compaction_bytes_limit;
|
|
|
|
|
options.delayed_write_rate = FLAGS_delayed_write_rate;
|
support for concurrent adds to memtable
Summary:
This diff adds support for concurrent adds to the skiplist memtable
implementations. Memory allocation is made thread-safe by the addition of
a spinlock, with small per-core buffers to avoid contention. Concurrent
memtable writes are made via an additional method and don't impose a
performance overhead on the non-concurrent case, so parallelism can be
selected on a per-batch basis.
Write thread synchronization is an increasing bottleneck for higher levels
of concurrency, so this diff adds --enable_write_thread_adaptive_yield
(default off). This feature causes threads joining a write batch
group to spin for a short time (default 100 usec) using sched_yield,
rather than going to sleep on a mutex. If the timing of the yield calls
indicates that another thread has actually run during the yield then
spinning is avoided. This option improves performance for concurrent
situations even without parallel adds, although it has the potential to
increase CPU usage (and the heuristic adaptation is not yet mature).
Parallel writes are not currently compatible with
inplace updates, update callbacks, or delete filtering.
Enable it with --allow_concurrent_memtable_write (and
--enable_write_thread_adaptive_yield). Parallel memtable writes
are performance neutral when there is no actual parallelism, and in
my experiments (SSD server-class Linux and varying contention and key
sizes for fillrandom) they are always a performance win when there is
more than one thread.
Statistics are updated earlier in the write path, dropping the number
of DB mutex acquisitions from 2 to 1 for almost all cases.
This diff was motivated and inspired by Yahoo's cLSM work. It is more
conservative than cLSM: RocksDB's write batch group leader role is
preserved (along with all of the existing flush and write throttling
logic) and concurrent writers are blocked until all memtable insertions
have completed and the sequence number has been advanced, to preserve
linearizability.
My test config is "db_bench -benchmarks=fillrandom -threads=$T
-batch_size=1 -memtablerep=skip_list -value_size=100 --num=1000000/$T
-level0_slowdown_writes_trigger=9999 -level0_stop_writes_trigger=9999
-disable_auto_compactions --max_write_buffer_number=8
-max_background_flushes=8 --disable_wal --write_buffer_size=160000000
--block_size=16384 --allow_concurrent_memtable_write" on a two-socket
Xeon E5-2660 @ 2.2Ghz with lots of memory and an SSD hard drive. With 1
thread I get ~440Kops/sec. Peak performance for 1 socket (numactl
-N1) is slightly more than 1Mops/sec, at 16 threads. Peak performance
across both sockets happens at 30 threads, and is ~900Kops/sec, although
with fewer threads there is less performance loss when the system has
background work.
Test Plan:
1. concurrent stress tests for InlineSkipList and DynamicBloom
2. make clean; make check
3. make clean; DISABLE_JEMALLOC=1 make valgrind_check; valgrind db_bench
4. make clean; COMPILE_WITH_TSAN=1 make all check; db_bench
5. make clean; COMPILE_WITH_ASAN=1 make all check; db_bench
6. make clean; OPT=-DROCKSDB_LITE make check
7. verify no perf regressions when disabled
Reviewers: igor, sdong
Reviewed By: sdong
Subscribers: MarkCallaghan, IslamAbdelRahman, anthony, yhchiang, rven, sdong, guyg8, kradhakrishnan, dhruba
Differential Revision: https://reviews.facebook.net/D50589
9 years ago
|
|
|
options.allow_concurrent_memtable_write =
|
|
|
|
|
FLAGS_allow_concurrent_memtable_write;
|
|
|
|
|
options.experimental_mempurge_threshold =
|
|
|
|
|
FLAGS_experimental_mempurge_threshold;
|
|
|
|
|
options.inplace_update_support = FLAGS_inplace_update_support;
|
|
|
|
|
options.inplace_update_num_locks = FLAGS_inplace_update_num_locks;
|
support for concurrent adds to memtable
Summary:
This diff adds support for concurrent adds to the skiplist memtable
implementations. Memory allocation is made thread-safe by the addition of
a spinlock, with small per-core buffers to avoid contention. Concurrent
memtable writes are made via an additional method and don't impose a
performance overhead on the non-concurrent case, so parallelism can be
selected on a per-batch basis.
Write thread synchronization is an increasing bottleneck for higher levels
of concurrency, so this diff adds --enable_write_thread_adaptive_yield
(default off). This feature causes threads joining a write batch
group to spin for a short time (default 100 usec) using sched_yield,
rather than going to sleep on a mutex. If the timing of the yield calls
indicates that another thread has actually run during the yield then
spinning is avoided. This option improves performance for concurrent
situations even without parallel adds, although it has the potential to
increase CPU usage (and the heuristic adaptation is not yet mature).
Parallel writes are not currently compatible with
inplace updates, update callbacks, or delete filtering.
Enable it with --allow_concurrent_memtable_write (and
--enable_write_thread_adaptive_yield). Parallel memtable writes
are performance neutral when there is no actual parallelism, and in
my experiments (SSD server-class Linux and varying contention and key
sizes for fillrandom) they are always a performance win when there is
more than one thread.
Statistics are updated earlier in the write path, dropping the number
of DB mutex acquisitions from 2 to 1 for almost all cases.
This diff was motivated and inspired by Yahoo's cLSM work. It is more
conservative than cLSM: RocksDB's write batch group leader role is
preserved (along with all of the existing flush and write throttling
logic) and concurrent writers are blocked until all memtable insertions
have completed and the sequence number has been advanced, to preserve
linearizability.
My test config is "db_bench -benchmarks=fillrandom -threads=$T
-batch_size=1 -memtablerep=skip_list -value_size=100 --num=1000000/$T
-level0_slowdown_writes_trigger=9999 -level0_stop_writes_trigger=9999
-disable_auto_compactions --max_write_buffer_number=8
-max_background_flushes=8 --disable_wal --write_buffer_size=160000000
--block_size=16384 --allow_concurrent_memtable_write" on a two-socket
Xeon E5-2660 @ 2.2Ghz with lots of memory and an SSD hard drive. With 1
thread I get ~440Kops/sec. Peak performance for 1 socket (numactl
-N1) is slightly more than 1Mops/sec, at 16 threads. Peak performance
across both sockets happens at 30 threads, and is ~900Kops/sec, although
with fewer threads there is less performance loss when the system has
background work.
Test Plan:
1. concurrent stress tests for InlineSkipList and DynamicBloom
2. make clean; make check
3. make clean; DISABLE_JEMALLOC=1 make valgrind_check; valgrind db_bench
4. make clean; COMPILE_WITH_TSAN=1 make all check; db_bench
5. make clean; COMPILE_WITH_ASAN=1 make all check; db_bench
6. make clean; OPT=-DROCKSDB_LITE make check
7. verify no perf regressions when disabled
Reviewers: igor, sdong
Reviewed By: sdong
Subscribers: MarkCallaghan, IslamAbdelRahman, anthony, yhchiang, rven, sdong, guyg8, kradhakrishnan, dhruba
Differential Revision: https://reviews.facebook.net/D50589
9 years ago
|
|
|
options.enable_write_thread_adaptive_yield =
|
|
|
|
|
FLAGS_enable_write_thread_adaptive_yield;
|
|
|
|
|
options.enable_pipelined_write = FLAGS_enable_pipelined_write;
|
|
|
|
|
options.unordered_write = FLAGS_unordered_write;
|
support for concurrent adds to memtable
Summary:
This diff adds support for concurrent adds to the skiplist memtable
implementations. Memory allocation is made thread-safe by the addition of
a spinlock, with small per-core buffers to avoid contention. Concurrent
memtable writes are made via an additional method and don't impose a
performance overhead on the non-concurrent case, so parallelism can be
selected on a per-batch basis.
Write thread synchronization is an increasing bottleneck for higher levels
of concurrency, so this diff adds --enable_write_thread_adaptive_yield
(default off). This feature causes threads joining a write batch
group to spin for a short time (default 100 usec) using sched_yield,
rather than going to sleep on a mutex. If the timing of the yield calls
indicates that another thread has actually run during the yield then
spinning is avoided. This option improves performance for concurrent
situations even without parallel adds, although it has the potential to
increase CPU usage (and the heuristic adaptation is not yet mature).
Parallel writes are not currently compatible with
inplace updates, update callbacks, or delete filtering.
Enable it with --allow_concurrent_memtable_write (and
--enable_write_thread_adaptive_yield). Parallel memtable writes
are performance neutral when there is no actual parallelism, and in
my experiments (SSD server-class Linux and varying contention and key
sizes for fillrandom) they are always a performance win when there is
more than one thread.
Statistics are updated earlier in the write path, dropping the number
of DB mutex acquisitions from 2 to 1 for almost all cases.
This diff was motivated and inspired by Yahoo's cLSM work. It is more
conservative than cLSM: RocksDB's write batch group leader role is
preserved (along with all of the existing flush and write throttling
logic) and concurrent writers are blocked until all memtable insertions
have completed and the sequence number has been advanced, to preserve
linearizability.
My test config is "db_bench -benchmarks=fillrandom -threads=$T
-batch_size=1 -memtablerep=skip_list -value_size=100 --num=1000000/$T
-level0_slowdown_writes_trigger=9999 -level0_stop_writes_trigger=9999
-disable_auto_compactions --max_write_buffer_number=8
-max_background_flushes=8 --disable_wal --write_buffer_size=160000000
--block_size=16384 --allow_concurrent_memtable_write" on a two-socket
Xeon E5-2660 @ 2.2Ghz with lots of memory and an SSD hard drive. With 1
thread I get ~440Kops/sec. Peak performance for 1 socket (numactl
-N1) is slightly more than 1Mops/sec, at 16 threads. Peak performance
across both sockets happens at 30 threads, and is ~900Kops/sec, although
with fewer threads there is less performance loss when the system has
background work.
Test Plan:
1. concurrent stress tests for InlineSkipList and DynamicBloom
2. make clean; make check
3. make clean; DISABLE_JEMALLOC=1 make valgrind_check; valgrind db_bench
4. make clean; COMPILE_WITH_TSAN=1 make all check; db_bench
5. make clean; COMPILE_WITH_ASAN=1 make all check; db_bench
6. make clean; OPT=-DROCKSDB_LITE make check
7. verify no perf regressions when disabled
Reviewers: igor, sdong
Reviewed By: sdong
Subscribers: MarkCallaghan, IslamAbdelRahman, anthony, yhchiang, rven, sdong, guyg8, kradhakrishnan, dhruba
Differential Revision: https://reviews.facebook.net/D50589
9 years ago
|
|
|
options.write_thread_max_yield_usec = FLAGS_write_thread_max_yield_usec;
|
|
|
|
|
options.write_thread_slow_yield_usec = FLAGS_write_thread_slow_yield_usec;
|
|
|
|
|
options.table_cache_numshardbits = FLAGS_table_cache_numshardbits;
|
|
|
|
|
options.max_compaction_bytes = FLAGS_max_compaction_bytes;
|
|
|
|
|
options.disable_auto_compactions = FLAGS_disable_auto_compactions;
|
|
|
|
|
options.optimize_filters_for_hits = FLAGS_optimize_filters_for_hits;
|
|
|
|
|
options.paranoid_checks = FLAGS_paranoid_checks;
|
|
|
|
|
options.force_consistency_checks = FLAGS_force_consistency_checks;
|
|
|
|
|
options.check_flush_compaction_key_order =
|
|
|
|
|
FLAGS_check_flush_compaction_key_order;
|
|
|
|
|
options.periodic_compaction_seconds = FLAGS_periodic_compaction_seconds;
|
Try to start TTL earlier with kMinOverlappingRatio is used (#8749)
Summary:
Right now, when options.ttl is set, compactions are triggered around the time when TTL is reached. This might cause extra compactions which are often bursty. This commit tries to mitigate it by picking those files earlier in normal compaction picking process. This is only implemented using kMinOverlappingRatio with Leveled compaction as it is the default value and it is more complicated to change other styles.
When a file is aged more than ttl/2, RocksDB starts to boost the compaction priority of files in normal compaction picking process, and hope by the time TTL is reached, very few extra compaction is needed.
In order for this to work, another change is made: during a compaction, if an output level file is older than ttl/2, cut output files based on original boundary (if it is not in the last level). This is to make sure that after an old file is moved to the next level, and new data is merged from the upper level, the new data falling into this range isn't reset with old timestamp. Without this change, in many cases, most files from one level will keep having old timestamp, even if they have newer data and we stuck in it.
Pull Request resolved: https://github.com/facebook/rocksdb/pull/8749
Test Plan: Add a unit test to test the boosting logic. Will add a unit test to test it end-to-end.
Reviewed By: jay-zhuang
Differential Revision: D30735261
fbshipit-source-id: 503c2d89250b22911eb99e72b379be154de3428e
3 years ago
|
|
|
options.ttl = FLAGS_ttl_seconds;
|
|
|
|
|
// fill storage options
|
|
|
|
|
options.advise_random_on_open = FLAGS_advise_random_on_open;
|
|
|
|
|
options.access_hint_on_compaction_start = FLAGS_compaction_fadvice_e;
|
|
|
|
|
options.use_adaptive_mutex = FLAGS_use_adaptive_mutex;
|
|
|
|
|
options.bytes_per_sync = FLAGS_bytes_per_sync;
|
|
|
|
|
options.wal_bytes_per_sync = FLAGS_wal_bytes_per_sync;
|
|
|
|
|
|
Benchmarking for Merge Operator
Summary:
Updated db_bench and utilities/merge_operators.h to allow for dynamic benchmarking
of merge operators in db_bench. Added a new test (--benchmarks=mergerandom), which performs
a bunch of random Merge() operations over random keys. Also added a "--merge_operator=" flag
so that the tester can easily benchmark different merge operators. Currently supports
the PutOperator and UInt64Add operator. Support for stringappend or list append may come later.
Test Plan:
1. make db_bench
2. Test the PutOperator (simulating Put) as follows:
./db_bench --benchmarks=fillrandom,readrandom,updaterandom,readrandom,mergerandom,readrandom --merge_operator=put
--threads=2
3. Test the UInt64AddOperator (simulating numeric addition) similarly:
./db_bench --value_size=8 --benchmarks=fillrandom,readrandom,updaterandom,readrandom,mergerandom,readrandom
--merge_operator=uint64add --threads=2
Reviewers: haobo, dhruba, zshao, MarkCallaghan
Reviewed By: haobo
CC: leveldb
Differential Revision: https://reviews.facebook.net/D11535
11 years ago
|
|
|
// merge operator options
|
|
|
|
|
if (!FLAGS_merge_operator.empty()) {
|
|
|
|
|
s = MergeOperator::CreateFromString(config_options, FLAGS_merge_operator,
|
|
|
|
|
&options.merge_operator);
|
|
|
|
|
if (!s.ok()) {
|
|
|
|
|
fprintf(stderr, "invalid merge operator[%s]: %s\n",
|
|
|
|
|
FLAGS_merge_operator.c_str(), s.ToString().c_str());
|
|
|
|
|
exit(1);
|
|
|
|
|
}
|
Benchmarking for Merge Operator
Summary:
Updated db_bench and utilities/merge_operators.h to allow for dynamic benchmarking
of merge operators in db_bench. Added a new test (--benchmarks=mergerandom), which performs
a bunch of random Merge() operations over random keys. Also added a "--merge_operator=" flag
so that the tester can easily benchmark different merge operators. Currently supports
the PutOperator and UInt64Add operator. Support for stringappend or list append may come later.
Test Plan:
1. make db_bench
2. Test the PutOperator (simulating Put) as follows:
./db_bench --benchmarks=fillrandom,readrandom,updaterandom,readrandom,mergerandom,readrandom --merge_operator=put
--threads=2
3. Test the UInt64AddOperator (simulating numeric addition) similarly:
./db_bench --value_size=8 --benchmarks=fillrandom,readrandom,updaterandom,readrandom,mergerandom,readrandom
--merge_operator=uint64add --threads=2
Reviewers: haobo, dhruba, zshao, MarkCallaghan
Reviewed By: haobo
CC: leveldb
Differential Revision: https://reviews.facebook.net/D11535
11 years ago
|
|
|
}
|
|
|
|
|
options.max_successive_merges = FLAGS_max_successive_merges;
|
|
|
|
|
options.report_bg_io_stats = FLAGS_report_bg_io_stats;
|
Benchmarking for Merge Operator
Summary:
Updated db_bench and utilities/merge_operators.h to allow for dynamic benchmarking
of merge operators in db_bench. Added a new test (--benchmarks=mergerandom), which performs
a bunch of random Merge() operations over random keys. Also added a "--merge_operator=" flag
so that the tester can easily benchmark different merge operators. Currently supports
the PutOperator and UInt64Add operator. Support for stringappend or list append may come later.
Test Plan:
1. make db_bench
2. Test the PutOperator (simulating Put) as follows:
./db_bench --benchmarks=fillrandom,readrandom,updaterandom,readrandom,mergerandom,readrandom --merge_operator=put
--threads=2
3. Test the UInt64AddOperator (simulating numeric addition) similarly:
./db_bench --value_size=8 --benchmarks=fillrandom,readrandom,updaterandom,readrandom,mergerandom,readrandom
--merge_operator=uint64add --threads=2
Reviewers: haobo, dhruba, zshao, MarkCallaghan
Reviewed By: haobo
CC: leveldb
Differential Revision: https://reviews.facebook.net/D11535
11 years ago
|
|
|
|
|
|
|
|
// set universal style compaction configurations, if applicable
|
|
|
|
|
if (FLAGS_universal_size_ratio != 0) {
|
|
|
|
|
options.compaction_options_universal.size_ratio =
|
|
|
|
|
FLAGS_universal_size_ratio;
|
|
|
|
|
}
|
|
|
|
|
if (FLAGS_universal_min_merge_width != 0) {
|
|
|
|
|
options.compaction_options_universal.min_merge_width =
|
|
|
|
|
FLAGS_universal_min_merge_width;
|
|
|
|
|
}
|
|
|
|
|
if (FLAGS_universal_max_merge_width != 0) {
|
|
|
|
|
options.compaction_options_universal.max_merge_width =
|
|
|
|
|
FLAGS_universal_max_merge_width;
|
|
|
|
|
}
|
|
|
|
|
if (FLAGS_universal_max_size_amplification_percent != 0) {
|
|
|
|
|
options.compaction_options_universal.max_size_amplification_percent =
|
|
|
|
|
FLAGS_universal_max_size_amplification_percent;
|
|
|
|
|
}
|
|
|
|
|
if (FLAGS_universal_compression_size_percent != -1) {
|
|
|
|
|
options.compaction_options_universal.compression_size_percent =
|
|
|
|
|
FLAGS_universal_compression_size_percent;
|
|
|
|
|
}
|
|
|
|
|
options.compaction_options_universal.allow_trivial_move =
|
|
|
|
|
FLAGS_universal_allow_trivial_move;
|
Incremental Space Amp Compactions in Universal Style (#8655)
Summary:
This commit introduces incremental compaction in univeral style for space amplification. This follows the first improvement mentioned in https://rocksdb.org/blog/2021/04/12/universal-improvements.html . The implemention simply picks up files about size of max_compaction_bytes to compact and execute if the penalty is not too big. More optimizations can be done in the future, e.g. prioritizing between this compaction and other types. But for now, the feature is supposed to be functional and can often reduce frequency of full compactions, although it can introduce penalty.
In order to add cut files more efficiently so that more files from upper levels can be included, SST file cutting threshold (for current file + overlapping parent level files) is set to 1.5X of target file size. A 2MB target file size will generate files like this: https://gist.github.com/siying/29d2676fba417404f3c95e6c013c7de8 Number of files indeed increases but it is not out of control.
Two set of write benchmarks are run:
1. For ingestion rate limited scenario, we can see full compaction is mostly eliminated: https://gist.github.com/siying/959bc1186066906831cf4c808d6e0a19 . The write amp increased from 7.7 to 9.4, as expected. After applying file cutting, the number is improved to 8.9. In another benchmark, the write amp is even better with the incremental approach: https://gist.github.com/siying/d1c16c286d7c59c4d7bba718ca198163
2. For ingestion rate unlimited scenario, incremental compaction turns out to be too expensive most of the time and is not executed, as expected.
Pull Request resolved: https://github.com/facebook/rocksdb/pull/8655
Test Plan: Add unit tests to the functionality.
Reviewed By: ajkr
Differential Revision: D31787034
fbshipit-source-id: ce813e63b15a61d5a56e97bf8902a1b28e011beb
3 years ago
|
|
|
options.compaction_options_universal.incremental =
|
|
|
|
|
FLAGS_universal_incremental;
|
|
|
|
|
if (FLAGS_thread_status_per_interval > 0) {
|
|
|
|
|
options.enable_thread_tracking = true;
|
|
|
|
|
}
|
|
|
|
|
|
|
|
|
|
if (FLAGS_user_timestamp_size > 0) {
|
|
|
|
|
if (FLAGS_user_timestamp_size != 8) {
|
|
|
|
|
fprintf(stderr, "Only 64 bits timestamps are supported.\n");
|
|
|
|
|
exit(1);
|
|
|
|
|
}
|
|
|
|
|
options.comparator = test::BytewiseComparatorWithU64TsWrapper();
|
|
|
|
|
}
|
|
|
|
|
|
|
|
|
|
// Integrated BlobDB
|
|
|
|
|
options.enable_blob_files = FLAGS_enable_blob_files;
|
|
|
|
|
options.min_blob_size = FLAGS_min_blob_size;
|
|
|
|
|
options.blob_file_size = FLAGS_blob_file_size;
|
|
|
|
|
options.blob_compression_type =
|
|
|
|
|
StringToCompressionType(FLAGS_blob_compression_type.c_str());
|
|
|
|
|
options.enable_blob_garbage_collection =
|
|
|
|
|
FLAGS_enable_blob_garbage_collection;
|
|
|
|
|
options.blob_garbage_collection_age_cutoff =
|
|
|
|
|
FLAGS_blob_garbage_collection_age_cutoff;
|
Make it possible to force the garbage collection of the oldest blob files (#8994)
Summary:
The current BlobDB garbage collection logic works by relocating the valid
blobs from the oldest blob files as they are encountered during compaction,
and cleaning up blob files once they contain nothing but garbage. However,
with sufficiently skewed workloads, it is theoretically possible to end up in a
situation when few or no compactions get scheduled for the SST files that contain
references to the oldest blob files, which can lead to increased space amp due
to the lack of GC.
In order to efficiently handle such workloads, the patch adds a new BlobDB
configuration option called `blob_garbage_collection_force_threshold`,
which signals to BlobDB to schedule targeted compactions for the SST files
that keep alive the oldest batch of blob files if the overall ratio of garbage in
the given blob files meets the threshold *and* all the given blob files are
eligible for GC based on `blob_garbage_collection_age_cutoff`. (For example,
if the new option is set to 0.9, targeted compactions will get scheduled if the
sum of garbage bytes meets or exceeds 90% of the sum of total bytes in the
oldest blob files, assuming all affected blob files are below the age-based cutoff.)
The net result of these targeted compactions is that the valid blobs in the oldest
blob files are relocated and the oldest blob files themselves cleaned up (since
*all* SST files that rely on them get compacted away).
These targeted compactions are similar to periodic compactions in the sense
that they force certain SST files that otherwise would not get picked up to undergo
compaction and also in the sense that instead of merging files from multiple levels,
they target a single file. (Note: such compactions might still include neighboring files
from the same level due to the need of having a "clean cut" boundary but they never
include any files from any other level.)
This functionality is currently only supported with the leveled compaction style
and is inactive by default (since the default value is set to 1.0, i.e. 100%).
Pull Request resolved: https://github.com/facebook/rocksdb/pull/8994
Test Plan: Ran `make check` and tested using `db_bench` and the stress/crash tests.
Reviewed By: riversand963
Differential Revision: D31489850
Pulled By: ltamasi
fbshipit-source-id: 44057d511726a0e2a03c5d9313d7511b3f0c4eab
3 years ago
|
|
|
options.blob_garbage_collection_force_threshold =
|
|
|
|
|
FLAGS_blob_garbage_collection_force_threshold;
|
|
|
|
|
options.blob_compaction_readahead_size =
|
|
|
|
|
FLAGS_blob_compaction_readahead_size;
|
|
|
|
|
|
|
|
|
|
#ifndef ROCKSDB_LITE
|
|
|
|
|
if (FLAGS_readonly && FLAGS_transaction_db) {
|
|
|
|
|
fprintf(stderr, "Cannot use readonly flag with transaction_db\n");
|
|
|
|
|
exit(1);
|
|
|
|
|
}
|
|
|
|
|
if (FLAGS_use_secondary_db &&
|
|
|
|
|
(FLAGS_transaction_db || FLAGS_optimistic_transaction_db)) {
|
|
|
|
|
fprintf(stderr, "Cannot use use_secondary_db flag with transaction_db\n");
|
|
|
|
|
exit(1);
|
|
|
|
|
}
|
|
|
|
|
#endif // ROCKSDB_LITE
|
|
|
|
|
|
|
|
|
|
}
|
|
|
|
|
|
|
|
|
|
void InitializeOptionsGeneral(Options* opts) {
|
|
|
|
|
Options& options = *opts;
|
|
|
|
|
|
|
|
|
|
options.create_missing_column_families = FLAGS_num_column_families > 1;
|
|
|
|
|
options.statistics = dbstats;
|
|
|
|
|
options.wal_dir = FLAGS_wal_dir;
|
|
|
|
|
options.create_if_missing = !FLAGS_use_existing_db;
|
|
|
|
|
options.dump_malloc_stats = FLAGS_dump_malloc_stats;
|
|
|
|
|
options.stats_dump_period_sec =
|
|
|
|
|
static_cast<unsigned int>(FLAGS_stats_dump_period_sec);
|
|
|
|
|
options.stats_persist_period_sec =
|
|
|
|
|
static_cast<unsigned int>(FLAGS_stats_persist_period_sec);
|
|
|
|
|
options.persist_stats_to_disk = FLAGS_persist_stats_to_disk;
|
|
|
|
|
options.stats_history_buffer_size =
|
|
|
|
|
static_cast<size_t>(FLAGS_stats_history_buffer_size);
|
|
|
|
|
options.avoid_flush_during_recovery = FLAGS_avoid_flush_during_recovery;
|
|
|
|
|
|
|
|
|
|
options.compression_opts.level = FLAGS_compression_level;
|
|
|
|
|
options.compression_opts.max_dict_bytes = FLAGS_compression_max_dict_bytes;
|
|
|
|
|
options.compression_opts.zstd_max_train_bytes =
|
|
|
|
|
FLAGS_compression_zstd_max_train_bytes;
|
|
|
|
|
options.compression_opts.parallel_threads =
|
|
|
|
|
FLAGS_compression_parallel_threads;
|
Limit buffering for collecting samples for compression dictionary (#7970)
Summary:
For dictionary compression, we need to collect some representative samples of the data to be compressed, which we use to either generate or train (when `CompressionOptions::zstd_max_train_bytes > 0`) a dictionary. Previously, the strategy was to buffer all the data blocks during flush, and up to the target file size during compaction. That strategy allowed us to randomly pick samples from as wide a range as possible that'd be guaranteed to land in a single output file.
However, some users try to make huge files in memory-constrained environments, where this strategy can cause OOM. This PR introduces an option, `CompressionOptions::max_dict_buffer_bytes`, that limits how much data blocks are buffered before we switch to unbuffered mode (which means creating the per-SST dictionary, writing out the buffered data, and compressing/writing new blocks as soon as they are built). It is not strict as we currently buffer more than just data blocks -- also keys are buffered. But it does make a step towards giving users predictable memory usage.
Related changes include:
- Changed sampling for dictionary compression to select unique data blocks when there is limited availability of data blocks
- Made use of `BlockBuilder::SwapAndReset()` to save an allocation+memcpy when buffering data blocks for building a dictionary
- Changed `ParseBoolean()` to accept an input containing characters after the boolean. This is necessary since, with this PR, a value for `CompressionOptions::enabled` is no longer necessarily the final component in the `CompressionOptions` string.
Pull Request resolved: https://github.com/facebook/rocksdb/pull/7970
Test Plan:
- updated `CompressionOptions` unit tests to verify limit is respected (to the extent expected in the current implementation) in various scenarios of flush/compaction to bottommost/non-bottommost level
- looked at jemalloc heap profiles right before and after switching to unbuffered mode during flush/compaction. Verified memory usage in buffering is proportional to the limit set.
Reviewed By: pdillinger
Differential Revision: D26467994
Pulled By: ajkr
fbshipit-source-id: 3da4ef9fba59974e4ef40e40c01611002c861465
3 years ago
|
|
|
options.compression_opts.max_dict_buffer_bytes =
|
|
|
|
|
FLAGS_compression_max_dict_buffer_bytes;
|
|
|
|
|
// If this is a block based table, set some related options
|
|
|
|
|
auto table_options =
|
|
|
|
|
options.table_factory->GetOptions<BlockBasedTableOptions>();
|
|
|
|
|
if (table_options != nullptr) {
|
|
|
|
|
if (FLAGS_cache_size) {
|
|
|
|
|
table_options->block_cache = cache_;
|
|
|
|
|
}
|
|
|
|
|
if (FLAGS_bloom_bits < 0) {
|
|
|
|
|
table_options->filter_policy = BlockBasedTableOptions().filter_policy;
|
|
|
|
|
} else if (FLAGS_bloom_bits == 0) {
|
|
|
|
|
table_options->filter_policy.reset();
|
Hide deprecated, inefficient block-based filter from public API (#9535)
Summary:
This change removes the ability to configure the deprecated,
inefficient block-based filter in the public API. Options that would
have enabled it now use "full" (and optionally partitioned) filters.
Existing block-based filters can still be read and used, and a "back
door" way to build them still exists, for testing and in case of trouble.
About the only way this removal would cause an issue for users is if
temporary memory for filter construction greatly increases. In
HISTORY.md we suggest a few possible mitigations: partitioned filters,
smaller SST files, or setting reserve_table_builder_memory=true.
Or users who have customized a FilterPolicy using the
CreateFilter/KeyMayMatch mechanism removed in https://github.com/facebook/rocksdb/issues/9501 will have to upgrade
their code. (It's long past time for people to move to the new
builder/reader customization interface.)
This change also introduces some internal-use-only configuration strings
for testing specific filter implementations while bypassing some
compatibility / intelligence logic. This is intended to hint at a path
toward making FilterPolicy Customizable, but it also gives us a "back
door" way to configure block-based filter.
Aside: updated db_bench so that -readonly implies -use_existing_db
Pull Request resolved: https://github.com/facebook/rocksdb/pull/9535
Test Plan:
Unit tests updated. Specifically,
* BlockBasedTableTest.BlockReadCountTest is tweaked to validate the back
door configuration interface and ignoring of `use_block_based_builder`.
* BlockBasedTableTest.TracingGetTest is migrated from testing
block-based filter access pattern to full filter access patter, by
re-ordering some things.
* Options test (pretty self-explanatory)
Performance test - create with `./db_bench -db=/dev/shm/rocksdb1 -bloom_bits=10 -cache_index_and_filter_blocks=1 -benchmarks=fillrandom -num=10000000 -compaction_style=2 -fifo_compaction_max_table_files_size_mb=10000 -fifo_compaction_allow_compaction=0` with and without `-use_block_based_filter`, which creates a DB with 21 SST files in L0. Read with `./db_bench -db=/dev/shm/rocksdb1 -readonly -bloom_bits=10 -cache_index_and_filter_blocks=1 -benchmarks=readrandom -num=10000000 -compaction_style=2 -fifo_compaction_max_table_files_size_mb=10000 -fifo_compaction_allow_compaction=0 -duration=30`
Without -use_block_based_filter: readrandom 464 ops/sec, 689280 KB DB
With -use_block_based_filter: readrandom 169 ops/sec, 690996 KB DB
No consistent difference with fillrandom
Reviewed By: jay-zhuang
Differential Revision: D34153871
Pulled By: pdillinger
fbshipit-source-id: 31f4a933c542f8f09aca47fa64aec67832a69738
2 years ago
|
|
|
} else if (FLAGS_use_block_based_filter) {
|
|
|
|
|
// Use back-door way of enabling obsolete block-based Bloom
|
|
|
|
|
Status s = FilterPolicy::CreateFromString(
|
|
|
|
|
ConfigOptions(),
|
|
|
|
|
"rocksdb.internal.DeprecatedBlockBasedBloomFilter:" +
|
|
|
|
|
ROCKSDB_NAMESPACE::ToString(FLAGS_bloom_bits),
|
|
|
|
|
&table_options->filter_policy);
|
|
|
|
|
if (!s.ok()) {
|
|
|
|
|
fprintf(stderr, "failure creating obsolete block-based filter: %s\n",
|
|
|
|
|
s.ToString().c_str());
|
|
|
|
|
exit(1);
|
|
|
|
|
}
|
|
|
|
|
} else {
|
Support optimize_filters_for_memory for Ribbon filter (#7774)
Summary:
Primarily this change refactors the optimize_filters_for_memory
code for Bloom filters, based on malloc_usable_size, to also work for
Ribbon filters.
This change also replaces the somewhat slow but general
BuiltinFilterBitsBuilder::ApproximateNumEntries with
implementation-specific versions for Ribbon (new) and Legacy Bloom
(based on a recently deleted version). The reason is to emphasize
speed in ApproximateNumEntries rather than 100% accuracy.
Justification: ApproximateNumEntries (formerly CalculateNumEntry) is
only used by RocksDB for range-partitioned filters, called each time we
start to construct one. (In theory, it should be possible to reuse the
estimate, but the abstractions provided by FilterPolicy don't really
make that workable.) But this is only used as a heuristic estimate for
hitting a desired partitioned filter size because of alignment to data
blocks, which have various numbers of unique keys or prefixes. The two
factors lead us to prioritize reasonable speed over 100% accuracy.
optimize_filters_for_memory adds extra complication, because precisely
calculating num_entries for some allowed number of bytes depends on state
with optimize_filters_for_memory enabled. And the allocator-agnostic
implementation of optimize_filters_for_memory, using malloc_usable_size,
means we would have to actually allocate memory, many times, just to
precisely determine how many entries (keys) could be added and stay below
some size budget, for the current state. (In a draft, I got this
working, and then realized the balance of speed vs. accuracy was all
wrong.)
So related to that, I have made CalculateSpace, an internal-only API
only used for testing, non-authoritative also if
optimize_filters_for_memory is enabled. This simplifies some code.
Pull Request resolved: https://github.com/facebook/rocksdb/pull/7774
Test Plan:
unit test updated, and for FilterSize test, range of tested
values is greatly expanded (still super fast)
Also tested `db_bench -benchmarks=fillrandom,stats -bloom_bits=10 -num=1000000 -partition_index_and_filters -format_version=5 [-optimize_filters_for_memory] [-use_ribbon_filter]` with temporary debug output of generated filter sizes.
Bloom+optimize_filters_for_memory:
1 Filter size: 197 (224 in memory)
134 Filter size: 3525 (3584 in memory)
107 Filter size: 4037 (4096 in memory)
Total on disk: 904,506
Total in memory: 918,752
Ribbon+optimize_filters_for_memory:
1 Filter size: 3061 (3072 in memory)
110 Filter size: 3573 (3584 in memory)
58 Filter size: 4085 (4096 in memory)
Total on disk: 633,021 (-30.0%)
Total in memory: 634,880 (-30.9%)
Bloom (no offm):
1 Filter size: 261 (320 in memory)
1 Filter size: 3333 (3584 in memory)
240 Filter size: 3717 (4096 in memory)
Total on disk: 895,674 (-1% on disk vs. +offm; known tolerable overhead of offm)
Total in memory: 986,944 (+7.4% vs. +offm)
Ribbon (no offm):
1 Filter size: 2949 (3072 in memory)
1 Filter size: 3381 (3584 in memory)
167 Filter size: 3701 (4096 in memory)
Total on disk: 624,397 (-30.3% vs. Bloom)
Total in memory: 690,688 (-30.0% vs. Bloom)
Note that optimize_filters_for_memory is even more effective for Ribbon filter than for cache-local Bloom, because it can close the unused memory gap even tighter than Bloom filter, because of 16 byte increments for Ribbon vs. 64 byte increments for Bloom.
Reviewed By: jay-zhuang
Differential Revision: D25592970
Pulled By: pdillinger
fbshipit-source-id: 606fdaa025bb790d7e9c21601e8ea86e10541912
4 years ago
|
|
|
table_options->filter_policy.reset(
|
Hide deprecated, inefficient block-based filter from public API (#9535)
Summary:
This change removes the ability to configure the deprecated,
inefficient block-based filter in the public API. Options that would
have enabled it now use "full" (and optionally partitioned) filters.
Existing block-based filters can still be read and used, and a "back
door" way to build them still exists, for testing and in case of trouble.
About the only way this removal would cause an issue for users is if
temporary memory for filter construction greatly increases. In
HISTORY.md we suggest a few possible mitigations: partitioned filters,
smaller SST files, or setting reserve_table_builder_memory=true.
Or users who have customized a FilterPolicy using the
CreateFilter/KeyMayMatch mechanism removed in https://github.com/facebook/rocksdb/issues/9501 will have to upgrade
their code. (It's long past time for people to move to the new
builder/reader customization interface.)
This change also introduces some internal-use-only configuration strings
for testing specific filter implementations while bypassing some
compatibility / intelligence logic. This is intended to hint at a path
toward making FilterPolicy Customizable, but it also gives us a "back
door" way to configure block-based filter.
Aside: updated db_bench so that -readonly implies -use_existing_db
Pull Request resolved: https://github.com/facebook/rocksdb/pull/9535
Test Plan:
Unit tests updated. Specifically,
* BlockBasedTableTest.BlockReadCountTest is tweaked to validate the back
door configuration interface and ignoring of `use_block_based_builder`.
* BlockBasedTableTest.TracingGetTest is migrated from testing
block-based filter access pattern to full filter access patter, by
re-ordering some things.
* Options test (pretty self-explanatory)
Performance test - create with `./db_bench -db=/dev/shm/rocksdb1 -bloom_bits=10 -cache_index_and_filter_blocks=1 -benchmarks=fillrandom -num=10000000 -compaction_style=2 -fifo_compaction_max_table_files_size_mb=10000 -fifo_compaction_allow_compaction=0` with and without `-use_block_based_filter`, which creates a DB with 21 SST files in L0. Read with `./db_bench -db=/dev/shm/rocksdb1 -readonly -bloom_bits=10 -cache_index_and_filter_blocks=1 -benchmarks=readrandom -num=10000000 -compaction_style=2 -fifo_compaction_max_table_files_size_mb=10000 -fifo_compaction_allow_compaction=0 -duration=30`
Without -use_block_based_filter: readrandom 464 ops/sec, 689280 KB DB
With -use_block_based_filter: readrandom 169 ops/sec, 690996 KB DB
No consistent difference with fillrandom
Reviewed By: jay-zhuang
Differential Revision: D34153871
Pulled By: pdillinger
fbshipit-source-id: 31f4a933c542f8f09aca47fa64aec67832a69738
2 years ago
|
|
|
FLAGS_use_ribbon_filter ? NewRibbonFilterPolicy(FLAGS_bloom_bits)
|
|
|
|
|
: NewBloomFilterPolicy(FLAGS_bloom_bits));
|
|
|
|
|
}
|
|
|
|
|
}
|
|
|
|
|
if (FLAGS_row_cache_size) {
|
|
|
|
|
if (FLAGS_cache_numshardbits >= 1) {
|
|
|
|
|
options.row_cache =
|
|
|
|
|
NewLRUCache(FLAGS_row_cache_size, FLAGS_cache_numshardbits);
|
|
|
|
|
} else {
|
|
|
|
|
options.row_cache = NewLRUCache(FLAGS_row_cache_size);
|
|
|
|
|
}
|
|
|
|
|
}
|
|
|
|
|
if (FLAGS_enable_io_prio) {
|
|
|
|
|
FLAGS_env->LowerThreadPoolIOPriority(Env::LOW);
|
|
|
|
|
FLAGS_env->LowerThreadPoolIOPriority(Env::HIGH);
|
|
|
|
|
}
|
|
|
|
|
if (FLAGS_enable_cpu_prio) {
|
|
|
|
|
FLAGS_env->LowerThreadPoolCPUPriority(Env::LOW);
|
|
|
|
|
FLAGS_env->LowerThreadPoolCPUPriority(Env::HIGH);
|
|
|
|
|
}
|
|
|
|
|
options.env = FLAGS_env;
|
|
|
|
|
if (FLAGS_sine_write_rate) {
|
|
|
|
|
FLAGS_benchmark_write_rate_limit = static_cast<uint64_t>(SineRate(0));
|
|
|
|
|
}
|
|
|
|
|
|
|
|
|
|
if (FLAGS_rate_limiter_bytes_per_sec > 0) {
|
|
|
|
|
options.rate_limiter.reset(NewGenericRateLimiter(
|
Simplify GenericRateLimiter algorithm (#8602)
Summary:
`GenericRateLimiter` slow path handles requests that cannot be satisfied
immediately. Such requests enter a queue, and their thread stays in `Request()`
until they are granted or the rate limiter is stopped. These threads are
responsible for unblocking themselves. The work to do so is split into two main
duties.
(1) Waiting for the next refill time.
(2) Refilling the bytes and granting requests.
Prior to this PR, the slow path logic involved a leader election algorithm to
pick one thread to perform (1) followed by (2). It elected the thread whose
request was at the front of the highest priority non-empty queue since that
request was most likely to be granted. This algorithm was efficient in terms of
reducing intermediate wakeups, which is a thread waking up only to resume
waiting after finding its request is not granted. However, the conceptual
complexity of this algorithm was too high. It took me a long time to draw a
timeline to understand how it works for just one edge case yet there were so
many.
This PR drops the leader election to reduce conceptual complexity. Now, the two
duties can be performed by whichever thread acquires the lock first. The risk
of this change is increasing the number of intermediate wakeups, however, we
took steps to mitigate that.
- `wait_until_refill_pending_` flag ensures only one thread performs (1). This\
prevents the thundering herd problem at the next refill time. The remaining\
threads wait on their condition variable with an unbounded duration -- thus we\
must remember to notify them to ensure forward progress.
- (1) is typically done by a thread at the front of a queue. This is trivial\
when the queues are initially empty as the first choice that arrives must be\
the only entry in its queue. When queues are initially non-empty, we achieve\
this by having (2) notify a thread at the front of a queue (preferring higher\
priority) to perform the next duty.
- We do not require any additional wakeup for (2). Typically it will just be\
done by the thread that finished (1).
Combined, the second and third bullet points above suggest the refill/granting
will typically be done by a request at the front of its queue. This is
important because one wakeup is saved when a granted request happens to be in an
already running thread.
Note there are a few cases that still lead to intermediate wakeup, however. The
first two are existing issues that also apply to the old algorithm, however, the
third (including both subpoints) is new.
- No request may be granted (only possible when rate limit dynamically\
decreases).
- Requests from a different queue may be granted.
- (2) may be run by a non-front request thread causing it to not be granted even\
if some requests in that same queue are granted. It can happen for a couple\
(unlikely) reasons.
- A new request may sneak in and grab the lock at the refill time, before the\
thread finishing (1) can wake up and grab it.
- A new request may sneak in and grab the lock and execute (1) before (2)'s\
chosen candidate can wake up and grab the lock. Then that non-front request\
thread performing (1) can carry over to perform (2).
Pull Request resolved: https://github.com/facebook/rocksdb/pull/8602
Test Plan:
- Use existing tests. The edge cases listed in the comment are all performance\
related; I could not really think of any related to correctness. The logic\
looks the same whether a thread wakes up/finishes its work early/on-time/late,\
or whether the thread is chosen vs. "steals" the work.
- Verified write throughput and CPU overhead are basically the same with and\
without this change, even in a rate limiter heavy workload:
Test command:
```
$ rm -rf /dev/shm/dbbench/ && TEST_TMPDIR=/dev/shm /usr/bin/time ./db_bench -benchmarks=fillrandom -num_multi_db=64 -num_low_pri_threads=64 -num_high_pri_threads=64 -write_buffer_size=262144 -target_file_size_base=262144 -max_bytes_for_level_base=1048576 -rate_limiter_bytes_per_sec=16777216 -key_size=24 -value_size=1000 -num=10000 -compression_type=none -rate_limiter_refill_period_us=1000
```
Results before this PR:
```
fillrandom : 108.463 micros/op 9219 ops/sec; 9.0 MB/s
7.40user 8.84system 1:26.20elapsed 18%CPU (0avgtext+0avgdata 256140maxresident)k
```
Results after this PR:
```
fillrandom : 108.108 micros/op 9250 ops/sec; 9.0 MB/s
7.45user 8.23system 1:26.68elapsed 18%CPU (0avgtext+0avgdata 255688maxresident)k
```
Reviewed By: hx235
Differential Revision: D30048013
Pulled By: ajkr
fbshipit-source-id: 6741bba9d9dfbccab359806d725105817fef818b
3 years ago
|
|
|
FLAGS_rate_limiter_bytes_per_sec, FLAGS_rate_limiter_refill_period_us,
|
|
|
|
|
10 /* fairness */,
|
|
|
|
|
FLAGS_rate_limit_bg_reads ? RateLimiter::Mode::kReadsOnly
|
|
|
|
|
: RateLimiter::Mode::kWritesOnly,
|
|
|
|
|
FLAGS_rate_limiter_auto_tuned));
|
|
|
|
|
}
|
|
|
|
|
|
Auto recovery from out of space errors (#4164)
Summary:
This commit implements automatic recovery from a Status::NoSpace() error
during background operations such as write callback, flush and
compaction. The broad design is as follows -
1. Compaction errors are treated as soft errors and don't put the
database in read-only mode. A compaction is delayed until enough free
disk space is available to accomodate the compaction outputs, which is
estimated based on the input size. This means that users can continue to
write, and we rely on the WriteController to delay or stop writes if the
compaction debt becomes too high due to persistent low disk space
condition
2. Errors during write callback and flush are treated as hard errors,
i.e the database is put in read-only mode and goes back to read-write
only fater certain recovery actions are taken.
3. Both types of recovery rely on the SstFileManagerImpl to poll for
sufficient disk space. We assume that there is a 1-1 mapping between an
SFM and the underlying OS storage container. For cases where multiple
DBs are hosted on a single storage container, the user is expected to
allocate a single SFM instance and use the same one for all the DBs. If
no SFM is specified by the user, DBImpl::Open() will allocate one, but
this will be one per DB and each DB will recover independently. The
recovery implemented by SFM is as follows -
a) On the first occurance of an out of space error during compaction,
subsequent
compactions will be delayed until the disk free space check indicates
enough available space. The required space is computed as the sum of
input sizes.
b) The free space check requirement will be removed once the amount of
free space is greater than the size reserved by in progress
compactions when the first error occured
c) If the out of space error is a hard error, a background thread in
SFM will poll for sufficient headroom before triggering the recovery
of the database and putting it in write-only mode. The headroom is
calculated as the sum of the write_buffer_size of all the DB instances
associated with the SFM
4. EventListener callbacks will be called at the start and completion of
automatic recovery. Users can disable the auto recov ery in the start
callback, and later initiate it manually by calling DB::Resume()
Todo:
1. More extensive testing
2. Add disk full condition to db_stress (follow-on PR)
Pull Request resolved: https://github.com/facebook/rocksdb/pull/4164
Differential Revision: D9846378
Pulled By: anand1976
fbshipit-source-id: 80ea875dbd7f00205e19c82215ff6e37da10da4a
6 years ago
|
|
|
options.listeners.emplace_back(listener_);
|
|
|
|
|
|
|
|
|
|
if (FLAGS_file_checksum) {
|
|
|
|
|
options.file_checksum_gen_factory.reset(
|
|
|
|
|
new FileChecksumGenCrc32cFactory());
|
|
|
|
|
}
|
|
|
|
|
|
|
|
|
|
if (FLAGS_num_multi_db <= 1) {
|
|
|
|
|
OpenDb(options, FLAGS_db, &db_);
|
|
|
|
|
} else {
|
|
|
|
|
multi_dbs_.clear();
|
|
|
|
|
multi_dbs_.resize(FLAGS_num_multi_db);
|
|
|
|
|
auto wal_dir = options.wal_dir;
|
|
|
|
|
for (int i = 0; i < FLAGS_num_multi_db; i++) {
|
|
|
|
|
if (!wal_dir.empty()) {
|
|
|
|
|
options.wal_dir = GetPathForMultiple(wal_dir, i);
|
|
|
|
|
}
|
|
|
|
|
OpenDb(options, GetPathForMultiple(FLAGS_db, i), &multi_dbs_[i]);
|
|
|
|
|
}
|
|
|
|
|
options.wal_dir = wal_dir;
|
|
|
|
|
}
|
|
|
|
|
|
|
|
|
|
// KeepFilter is a noop filter, this can be used to test compaction filter
|
|
|
|
|
if (FLAGS_use_keep_filter) {
|
|
|
|
|
options.compaction_filter = new KeepFilter();
|
|
|
|
|
fprintf(stdout, "A noop compaction filter is used\n");
|
|
|
|
|
}
|
|
|
|
|
|
|
|
|
|
if (FLAGS_use_existing_keys) {
|
|
|
|
|
// Only work on single database
|
|
|
|
|
assert(db_.db != nullptr);
|
|
|
|
|
ReadOptions read_opts; // before read_options_ initialized
|
|
|
|
|
read_opts.total_order_seek = true;
|
|
|
|
|
Iterator* iter = db_.db->NewIterator(read_opts);
|
|
|
|
|
for (iter->SeekToFirst(); iter->Valid(); iter->Next()) {
|
|
|
|
|
keys_.emplace_back(iter->key().ToString());
|
|
|
|
|
}
|
|
|
|
|
delete iter;
|
|
|
|
|
FLAGS_num = keys_.size();
|
|
|
|
|
}
|
|
|
|
|
}
|
|
|
|
|
|
|
|
|
|
void Open(Options* opts) {
|
|
|
|
|
if (!InitializeOptionsFromFile(opts)) {
|
|
|
|
|
InitializeOptionsFromFlags(opts);
|
|
|
|
|
}
|
|
|
|
|
|
|
|
|
|
InitializeOptionsGeneral(opts);
|
|
|
|
|
}
|
|
|
|
|
|
|
|
|
|
void OpenDb(Options options, const std::string& db_name,
|
|
|
|
|
DBWithColumnFamilies* db) {
|
|
|
|
|
uint64_t open_start = FLAGS_report_open_timing ? FLAGS_env->NowNanos() : 0;
|
|
|
|
|
Status s;
|
|
|
|
|
// Open with column families if necessary.
|
|
|
|
|
if (FLAGS_num_column_families > 1) {
|
|
|
|
|
size_t num_hot = FLAGS_num_column_families;
|
|
|
|
|
if (FLAGS_num_hot_column_families > 0 &&
|
|
|
|
|
FLAGS_num_hot_column_families < FLAGS_num_column_families) {
|
|
|
|
|
num_hot = FLAGS_num_hot_column_families;
|
|
|
|
|
} else {
|
|
|
|
|
FLAGS_num_hot_column_families = FLAGS_num_column_families;
|
|
|
|
|
}
|
|
|
|
|
std::vector<ColumnFamilyDescriptor> column_families;
|
|
|
|
|
for (size_t i = 0; i < num_hot; i++) {
|
|
|
|
|
column_families.push_back(ColumnFamilyDescriptor(
|
|
|
|
|
ColumnFamilyName(i), ColumnFamilyOptions(options)));
|
|
|
|
|
}
|
|
|
|
|
std::vector<int> cfh_idx_to_prob;
|
|
|
|
|
if (!FLAGS_column_family_distribution.empty()) {
|
|
|
|
|
std::stringstream cf_prob_stream(FLAGS_column_family_distribution);
|
|
|
|
|
std::string cf_prob;
|
|
|
|
|
int sum = 0;
|
|
|
|
|
while (std::getline(cf_prob_stream, cf_prob, ',')) {
|
|
|
|
|
cfh_idx_to_prob.push_back(std::stoi(cf_prob));
|
|
|
|
|
sum += cfh_idx_to_prob.back();
|
|
|
|
|
}
|
|
|
|
|
if (sum != 100) {
|
|
|
|
|
fprintf(stderr, "column_family_distribution items must sum to 100\n");
|
|
|
|
|
exit(1);
|
|
|
|
|
}
|
|
|
|
|
if (cfh_idx_to_prob.size() != num_hot) {
|
|
|
|
|
fprintf(stderr,
|
|
|
|
|
"got %" ROCKSDB_PRIszt
|
|
|
|
|
" column_family_distribution items; expected "
|
|
|
|
|
"%" ROCKSDB_PRIszt "\n",
|
|
|
|
|
cfh_idx_to_prob.size(), num_hot);
|
|
|
|
|
exit(1);
|
|
|
|
|
}
|
|
|
|
|
}
|
|
|
|
|
#ifndef ROCKSDB_LITE
|
|
|
|
|
if (FLAGS_readonly) {
|
|
|
|
|
s = DB::OpenForReadOnly(options, db_name, column_families,
|
|
|
|
|
&db->cfh, &db->db);
|
Pessimistic Transactions
Summary:
Initial implementation of Pessimistic Transactions. This diff contains the api changes discussed in D38913. This diff is pretty large, so let me know if people would prefer to meet up to discuss it.
MyRocks folks: please take a look at the API in include/rocksdb/utilities/transaction[_db].h and let me know if you have any issues.
Also, you'll notice a couple of TODOs in the implementation of RollbackToSavePoint(). After chatting with Siying, I'm going to send out a separate diff for an alternate implementation of this feature that implements the rollback inside of WriteBatch/WriteBatchWithIndex. We can then decide which route is preferable.
Next, I'm planning on doing some perf testing and then integrating this diff into MongoRocks for further testing.
Test Plan: Unit tests, db_bench parallel testing.
Reviewers: igor, rven, sdong, yhchiang, yoshinorim
Reviewed By: sdong
Subscribers: hermanlee4, maykov, spetrunia, leveldb, dhruba
Differential Revision: https://reviews.facebook.net/D40869
9 years ago
|
|
|
} else if (FLAGS_optimistic_transaction_db) {
|
|
|
|
|
s = OptimisticTransactionDB::Open(options, db_name, column_families,
|
Pessimistic Transactions
Summary:
Initial implementation of Pessimistic Transactions. This diff contains the api changes discussed in D38913. This diff is pretty large, so let me know if people would prefer to meet up to discuss it.
MyRocks folks: please take a look at the API in include/rocksdb/utilities/transaction[_db].h and let me know if you have any issues.
Also, you'll notice a couple of TODOs in the implementation of RollbackToSavePoint(). After chatting with Siying, I'm going to send out a separate diff for an alternate implementation of this feature that implements the rollback inside of WriteBatch/WriteBatchWithIndex. We can then decide which route is preferable.
Next, I'm planning on doing some perf testing and then integrating this diff into MongoRocks for further testing.
Test Plan: Unit tests, db_bench parallel testing.
Reviewers: igor, rven, sdong, yhchiang, yoshinorim
Reviewed By: sdong
Subscribers: hermanlee4, maykov, spetrunia, leveldb, dhruba
Differential Revision: https://reviews.facebook.net/D40869
9 years ago
|
|
|
&db->cfh, &db->opt_txn_db);
|
|
|
|
|
if (s.ok()) {
|
|
|
|
|
db->db = db->opt_txn_db->GetBaseDB();
|
|
|
|
|
}
|
|
|
|
|
} else if (FLAGS_transaction_db) {
|
|
|
|
|
TransactionDB* ptr;
|
|
|
|
|
TransactionDBOptions txn_db_options;
|
|
|
|
|
if (options.unordered_write) {
|
|
|
|
|
options.two_write_queues = true;
|
|
|
|
|
txn_db_options.skip_concurrency_control = true;
|
|
|
|
|
txn_db_options.write_policy = WRITE_PREPARED;
|
|
|
|
|
}
|
Pessimistic Transactions
Summary:
Initial implementation of Pessimistic Transactions. This diff contains the api changes discussed in D38913. This diff is pretty large, so let me know if people would prefer to meet up to discuss it.
MyRocks folks: please take a look at the API in include/rocksdb/utilities/transaction[_db].h and let me know if you have any issues.
Also, you'll notice a couple of TODOs in the implementation of RollbackToSavePoint(). After chatting with Siying, I'm going to send out a separate diff for an alternate implementation of this feature that implements the rollback inside of WriteBatch/WriteBatchWithIndex. We can then decide which route is preferable.
Next, I'm planning on doing some perf testing and then integrating this diff into MongoRocks for further testing.
Test Plan: Unit tests, db_bench parallel testing.
Reviewers: igor, rven, sdong, yhchiang, yoshinorim
Reviewed By: sdong
Subscribers: hermanlee4, maykov, spetrunia, leveldb, dhruba
Differential Revision: https://reviews.facebook.net/D40869
9 years ago
|
|
|
s = TransactionDB::Open(options, txn_db_options, db_name,
|
|
|
|
|
column_families, &db->cfh, &ptr);
|
|
|
|
|
if (s.ok()) {
|
Pessimistic Transactions
Summary:
Initial implementation of Pessimistic Transactions. This diff contains the api changes discussed in D38913. This diff is pretty large, so let me know if people would prefer to meet up to discuss it.
MyRocks folks: please take a look at the API in include/rocksdb/utilities/transaction[_db].h and let me know if you have any issues.
Also, you'll notice a couple of TODOs in the implementation of RollbackToSavePoint(). After chatting with Siying, I'm going to send out a separate diff for an alternate implementation of this feature that implements the rollback inside of WriteBatch/WriteBatchWithIndex. We can then decide which route is preferable.
Next, I'm planning on doing some perf testing and then integrating this diff into MongoRocks for further testing.
Test Plan: Unit tests, db_bench parallel testing.
Reviewers: igor, rven, sdong, yhchiang, yoshinorim
Reviewed By: sdong
Subscribers: hermanlee4, maykov, spetrunia, leveldb, dhruba
Differential Revision: https://reviews.facebook.net/D40869
9 years ago
|
|
|
db->db = ptr;
|
|
|
|
|
}
|
|
|
|
|
} else {
|
|
|
|
|
s = DB::Open(options, db_name, column_families, &db->cfh, &db->db);
|
|
|
|
|
}
|
|
|
|
|
#else
|
|
|
|
|
s = DB::Open(options, db_name, column_families, &db->cfh, &db->db);
|
|
|
|
|
#endif // ROCKSDB_LITE
|
|
|
|
|
db->cfh.resize(FLAGS_num_column_families);
|
|
|
|
|
db->num_created = num_hot;
|
|
|
|
|
db->num_hot = num_hot;
|
|
|
|
|
db->cfh_idx_to_prob = std::move(cfh_idx_to_prob);
|
|
|
|
|
#ifndef ROCKSDB_LITE
|
|
|
|
|
} else if (FLAGS_readonly) {
|
|
|
|
|
s = DB::OpenForReadOnly(options, db_name, &db->db);
|
Pessimistic Transactions
Summary:
Initial implementation of Pessimistic Transactions. This diff contains the api changes discussed in D38913. This diff is pretty large, so let me know if people would prefer to meet up to discuss it.
MyRocks folks: please take a look at the API in include/rocksdb/utilities/transaction[_db].h and let me know if you have any issues.
Also, you'll notice a couple of TODOs in the implementation of RollbackToSavePoint(). After chatting with Siying, I'm going to send out a separate diff for an alternate implementation of this feature that implements the rollback inside of WriteBatch/WriteBatchWithIndex. We can then decide which route is preferable.
Next, I'm planning on doing some perf testing and then integrating this diff into MongoRocks for further testing.
Test Plan: Unit tests, db_bench parallel testing.
Reviewers: igor, rven, sdong, yhchiang, yoshinorim
Reviewed By: sdong
Subscribers: hermanlee4, maykov, spetrunia, leveldb, dhruba
Differential Revision: https://reviews.facebook.net/D40869
9 years ago
|
|
|
} else if (FLAGS_optimistic_transaction_db) {
|
|
|
|
|
s = OptimisticTransactionDB::Open(options, db_name, &db->opt_txn_db);
|
|
|
|
|
if (s.ok()) {
|
|
|
|
|
db->db = db->opt_txn_db->GetBaseDB();
|
|
|
|
|
}
|
|
|
|
|
} else if (FLAGS_transaction_db) {
|
|
|
|
|
TransactionDB* ptr = nullptr;
|
Pessimistic Transactions
Summary:
Initial implementation of Pessimistic Transactions. This diff contains the api changes discussed in D38913. This diff is pretty large, so let me know if people would prefer to meet up to discuss it.
MyRocks folks: please take a look at the API in include/rocksdb/utilities/transaction[_db].h and let me know if you have any issues.
Also, you'll notice a couple of TODOs in the implementation of RollbackToSavePoint(). After chatting with Siying, I'm going to send out a separate diff for an alternate implementation of this feature that implements the rollback inside of WriteBatch/WriteBatchWithIndex. We can then decide which route is preferable.
Next, I'm planning on doing some perf testing and then integrating this diff into MongoRocks for further testing.
Test Plan: Unit tests, db_bench parallel testing.
Reviewers: igor, rven, sdong, yhchiang, yoshinorim
Reviewed By: sdong
Subscribers: hermanlee4, maykov, spetrunia, leveldb, dhruba
Differential Revision: https://reviews.facebook.net/D40869
9 years ago
|
|
|
TransactionDBOptions txn_db_options;
|
|
|
|
|
if (options.unordered_write) {
|
|
|
|
|
options.two_write_queues = true;
|
|
|
|
|
txn_db_options.skip_concurrency_control = true;
|
|
|
|
|
txn_db_options.write_policy = WRITE_PREPARED;
|
|
|
|
|
}
|
|
|
|
|
s = CreateLoggerFromOptions(db_name, options, &options.info_log);
|
|
|
|
|
if (s.ok()) {
|
|
|
|
|
s = TransactionDB::Open(options, txn_db_options, db_name, &ptr);
|
|
|
|
|
}
|
|
|
|
|
if (s.ok()) {
|
Pessimistic Transactions
Summary:
Initial implementation of Pessimistic Transactions. This diff contains the api changes discussed in D38913. This diff is pretty large, so let me know if people would prefer to meet up to discuss it.
MyRocks folks: please take a look at the API in include/rocksdb/utilities/transaction[_db].h and let me know if you have any issues.
Also, you'll notice a couple of TODOs in the implementation of RollbackToSavePoint(). After chatting with Siying, I'm going to send out a separate diff for an alternate implementation of this feature that implements the rollback inside of WriteBatch/WriteBatchWithIndex. We can then decide which route is preferable.
Next, I'm planning on doing some perf testing and then integrating this diff into MongoRocks for further testing.
Test Plan: Unit tests, db_bench parallel testing.
Reviewers: igor, rven, sdong, yhchiang, yoshinorim
Reviewed By: sdong
Subscribers: hermanlee4, maykov, spetrunia, leveldb, dhruba
Differential Revision: https://reviews.facebook.net/D40869
9 years ago
|
|
|
db->db = ptr;
|
|
|
|
|
}
|
|
|
|
|
} else if (FLAGS_use_blob_db) {
|
|
|
|
|
// Stacked BlobDB
|
|
|
|
|
blob_db::BlobDBOptions blob_db_options;
|
|
|
|
|
blob_db_options.enable_garbage_collection = FLAGS_blob_db_enable_gc;
|
|
|
|
|
blob_db_options.garbage_collection_cutoff = FLAGS_blob_db_gc_cutoff;
|
|
|
|
|
blob_db_options.is_fifo = FLAGS_blob_db_is_fifo;
|
|
|
|
|
blob_db_options.max_db_size = FLAGS_blob_db_max_db_size;
|
|
|
|
|
blob_db_options.ttl_range_secs = FLAGS_blob_db_ttl_range_secs;
|
|
|
|
|
blob_db_options.min_blob_size = FLAGS_blob_db_min_blob_size;
|
|
|
|
|
blob_db_options.bytes_per_sync = FLAGS_blob_db_bytes_per_sync;
|
|
|
|
|
blob_db_options.blob_file_size = FLAGS_blob_db_file_size;
|
|
|
|
|
blob_db_options.compression = FLAGS_blob_db_compression_type_e;
|
|
|
|
|
blob_db::BlobDB* ptr = nullptr;
|
|
|
|
|
s = blob_db::BlobDB::Open(options, blob_db_options, db_name, &ptr);
|
|
|
|
|
if (s.ok()) {
|
|
|
|
|
db->db = ptr;
|
|
|
|
|
}
|
|
|
|
|
} else if (FLAGS_use_secondary_db) {
|
|
|
|
|
if (FLAGS_secondary_path.empty()) {
|
|
|
|
|
std::string default_secondary_path;
|
|
|
|
|
FLAGS_env->GetTestDirectory(&default_secondary_path);
|
|
|
|
|
default_secondary_path += "/dbbench_secondary";
|
|
|
|
|
FLAGS_secondary_path = default_secondary_path;
|
|
|
|
|
}
|
|
|
|
|
s = DB::OpenAsSecondary(options, db_name, FLAGS_secondary_path, &db->db);
|
|
|
|
|
if (s.ok() && FLAGS_secondary_update_interval > 0) {
|
|
|
|
|
secondary_update_thread_.reset(new port::Thread(
|
|
|
|
|
[this](int interval, DBWithColumnFamilies* _db) {
|
|
|
|
|
while (0 == secondary_update_stopped_.load(
|
|
|
|
|
std::memory_order_relaxed)) {
|
|
|
|
|
Status secondary_update_status =
|
|
|
|
|
_db->db->TryCatchUpWithPrimary();
|
|
|
|
|
if (!secondary_update_status.ok()) {
|
|
|
|
|
fprintf(stderr, "Failed to catch up with primary: %s\n",
|
|
|
|
|
secondary_update_status.ToString().c_str());
|
|
|
|
|
break;
|
|
|
|
|
}
|
|
|
|
|
++secondary_db_updates_;
|
|
|
|
|
FLAGS_env->SleepForMicroseconds(interval * 1000000);
|
|
|
|
|
}
|
|
|
|
|
},
|
|
|
|
|
FLAGS_secondary_update_interval, db));
|
|
|
|
|
}
|
|
|
|
|
#endif // ROCKSDB_LITE
|
|
|
|
|
} else {
|
|
|
|
|
s = DB::Open(options, db_name, &db->db);
|
|
|
|
|
}
|
|
|
|
|
if (FLAGS_report_open_timing) {
|
|
|
|
|
std::cout << "OpenDb: "
|
|
|
|
|
<< (FLAGS_env->NowNanos() - open_start) / 1000000.0
|
|
|
|
|
<< " milliseconds\n";
|
|
|
|
|
}
|
|
|
|
|
if (!s.ok()) {
|
|
|
|
|
fprintf(stderr, "open error: %s\n", s.ToString().c_str());
|
|
|
|
|
exit(1);
|
|
|
|
|
}
|
|
|
|
|
}
|
|
|
|
|
|
|
|
|
|
enum WriteMode {
|
|
|
|
|
RANDOM, SEQUENTIAL, UNIQUE_RANDOM
|
|
|
|
|
};
|
|
|
|
|
|
|
|
|
|
void WriteSeqDeterministic(ThreadState* thread) {
|
|
|
|
|
DoDeterministicCompact(thread, open_options_.compaction_style, SEQUENTIAL);
|
|
|
|
|
}
|
|
|
|
|
|
|
|
|
|
void WriteUniqueRandomDeterministic(ThreadState* thread) {
|
|
|
|
|
DoDeterministicCompact(thread, open_options_.compaction_style,
|
|
|
|
|
UNIQUE_RANDOM);
|
|
|
|
|
}
|
|
|
|
|
|
|
|
|
|
void WriteSeq(ThreadState* thread) {
|
|
|
|
|
DoWrite(thread, SEQUENTIAL);
|
|
|
|
|
}
|
|
|
|
|
|
|
|
|
|
void WriteRandom(ThreadState* thread) {
|
|
|
|
|
DoWrite(thread, RANDOM);
|
|
|
|
|
}
|
|
|
|
|
|
|
|
|
|
void WriteUniqueRandom(ThreadState* thread) {
|
|
|
|
|
DoWrite(thread, UNIQUE_RANDOM);
|
|
|
|
|
}
|
|
|
|
|
|
|
|
|
|
class KeyGenerator {
|
|
|
|
|
public:
|
|
|
|
|
KeyGenerator(Random64* rand, WriteMode mode, uint64_t num,
|
|
|
|
|
uint64_t /*num_per_set*/ = 64 * 1024)
|
|
|
|
|
: rand_(rand), mode_(mode), num_(num), next_(0) {
|
|
|
|
|
if (mode_ == UNIQUE_RANDOM) {
|
|
|
|
|
// NOTE: if memory consumption of this approach becomes a concern,
|
|
|
|
|
// we can either break it into pieces and only random shuffle a section
|
|
|
|
|
// each time. Alternatively, use a bit map implementation
|
|
|
|
|
// (https://reviews.facebook.net/differential/diff/54627/)
|
|
|
|
|
values_.resize(num_);
|
|
|
|
|
for (uint64_t i = 0; i < num_; ++i) {
|
|
|
|
|
values_[i] = i;
|
|
|
|
|
}
|
|
|
|
|
RandomShuffle(values_.begin(), values_.end(),
|
|
|
|
|
static_cast<uint32_t>(seed_base));
|
|
|
|
|
}
|
|
|
|
|
}
|
|
|
|
|
|
|
|
|
|
uint64_t Next() {
|
|
|
|
|
switch (mode_) {
|
|
|
|
|
case SEQUENTIAL:
|
|
|
|
|
return next_++;
|
|
|
|
|
case RANDOM:
|
|
|
|
|
return rand_->Next() % num_;
|
|
|
|
|
case UNIQUE_RANDOM:
|
|
|
|
|
assert(next_ < num_);
|
|
|
|
|
return values_[next_++];
|
|
|
|
|
}
|
|
|
|
|
assert(false);
|
|
|
|
|
return std::numeric_limits<uint64_t>::max();
|
|
|
|
|
}
|
|
|
|
|
|
|
|
|
|
// Only available for UNIQUE_RANDOM mode.
|
|
|
|
|
uint64_t Fetch(uint64_t index) {
|
|
|
|
|
assert(mode_ == UNIQUE_RANDOM);
|
|
|
|
|
assert(index < values_.size());
|
|
|
|
|
return values_[index];
|
|
|
|
|
}
|
|
|
|
|
|
|
|
|
|
private:
|
|
|
|
|
Random64* rand_;
|
|
|
|
|
WriteMode mode_;
|
|
|
|
|
const uint64_t num_;
|
|
|
|
|
uint64_t next_;
|
|
|
|
|
std::vector<uint64_t> values_;
|
|
|
|
|
};
|
|
|
|
|
|
|
|
|
|
DB* SelectDB(ThreadState* thread) {
|
|
|
|
|
return SelectDBWithCfh(thread)->db;
|
|
|
|
|
}
|
|
|
|
|
|
|
|
|
|
DBWithColumnFamilies* SelectDBWithCfh(ThreadState* thread) {
|
|
|
|
|
return SelectDBWithCfh(thread->rand.Next());
|
|
|
|
|
}
|
|
|
|
|
|
|
|
|
|
DBWithColumnFamilies* SelectDBWithCfh(uint64_t rand_int) {
|
|
|
|
|
if (db_.db != nullptr) {
|
|
|
|
|
return &db_;
|
|
|
|
|
} else {
|
|
|
|
|
return &multi_dbs_[rand_int % multi_dbs_.size()];
|
|
|
|
|
}
|
|
|
|
|
}
|
|
|
|
|
|
|
|
|
|
double SineRate(double x) {
|
|
|
|
|
return FLAGS_sine_a*sin((FLAGS_sine_b*x) + FLAGS_sine_c) + FLAGS_sine_d;
|
|
|
|
|
}
|
|
|
|
|
|
|
|
|
|
void DoWrite(ThreadState* thread, WriteMode write_mode) {
|
|
|
|
|
const int test_duration = write_mode == RANDOM ? FLAGS_duration : 0;
|
|
|
|
|
const int64_t num_ops = writes_ == 0 ? num_ : writes_;
|
|
|
|
|
|
|
|
|
|
size_t num_key_gens = 1;
|
|
|
|
|
if (db_.db == nullptr) {
|
|
|
|
|
num_key_gens = multi_dbs_.size();
|
|
|
|
|
}
|
|
|
|
|
std::vector<std::unique_ptr<KeyGenerator>> key_gens(num_key_gens);
|
|
|
|
|
int64_t max_ops = num_ops * num_key_gens;
|
|
|
|
|
int64_t ops_per_stage = max_ops;
|
|
|
|
|
if (FLAGS_num_column_families > 1 && FLAGS_num_hot_column_families > 0) {
|
|
|
|
|
ops_per_stage = (max_ops - 1) / (FLAGS_num_column_families /
|
|
|
|
|
FLAGS_num_hot_column_families) +
|
|
|
|
|
1;
|
|
|
|
|
}
|
|
|
|
|
|
|
|
|
|
Duration duration(test_duration, max_ops, ops_per_stage);
|
|
|
|
|
const uint64_t num_per_key_gen = num_ + max_num_range_tombstones_;
|
|
|
|
|
for (size_t i = 0; i < num_key_gens; i++) {
|
|
|
|
|
key_gens[i].reset(new KeyGenerator(&(thread->rand), write_mode,
|
|
|
|
|
num_per_key_gen, ops_per_stage));
|
|
|
|
|
}
|
|
|
|
|
|
|
|
|
|
if (num_ != FLAGS_num) {
|
|
|
|
|
char msg[100];
|
|
|
|
|
snprintf(msg, sizeof(msg), "(%" PRIu64 " ops)", num_);
|
|
|
|
|
thread->stats.AddMessage(msg);
|
|
|
|
|
}
|
|
|
|
|
|
|
|
|
|
RandomGenerator gen;
|
|
|
|
|
WriteBatch batch(/*reserved_bytes=*/0, /*max_bytes=*/0,
|
Revise APIs related to user-defined timestamp (#8946)
Summary:
ajkr reminded me that we have a rule of not including per-kv related data in `WriteOptions`.
Namely, `WriteOptions` should not include information about "what-to-write", but should just
include information about "how-to-write".
According to this rule, `WriteOptions::timestamp` (experimental) is clearly a violation. Therefore,
this PR removes `WriteOptions::timestamp` for compliance.
After the removal, we need to pass timestamp info via another set of APIs. This PR proposes a set
of overloaded functions `Put(write_opts, key, value, ts)`, `Delete(write_opts, key, ts)`, and
`SingleDelete(write_opts, key, ts)`. Planned to add `Write(write_opts, batch, ts)`, but its complexity
made me reconsider doing it in another PR (maybe).
For better checking and returning error early, we also add a new set of APIs to `WriteBatch` that take
extra `timestamp` information when writing to `WriteBatch`es.
These set of APIs in `WriteBatchWithIndex` are currently not supported, and are on our TODO list.
Removed `WriteBatch::AssignTimestamps()` and renamed `WriteBatch::AssignTimestamp()` to
`WriteBatch::UpdateTimestamps()` since this method require that all keys have space for timestamps
allocated already and multiple timestamps can be updated.
The constructor of `WriteBatch` now takes a fourth argument `default_cf_ts_sz` which is the timestamp
size of the default column family. This will be used to allocate space when calling APIs that do not
specify a column family handle.
Also, updated `DB::Get()`, `DB::MultiGet()`, `DB::NewIterator()`, `DB::NewIterators()` methods, replacing
some assertions about timestamp to returning Status code.
Pull Request resolved: https://github.com/facebook/rocksdb/pull/8946
Test Plan:
make check
./db_bench -benchmarks=fillseq,fillrandom,readrandom,readseq,deleterandom -user_timestamp_size=8
./db_stress --user_timestamp_size=8 -nooverwritepercent=0 -test_secondary=0 -secondary_catch_up_one_in=0 -continuous_verification_interval=0
Make sure there is no perf regression by running the following
```
./db_bench_opt -db=/dev/shm/rocksdb -use_existing_db=0 -level0_stop_writes_trigger=256 -level0_slowdown_writes_trigger=256 -level0_file_num_compaction_trigger=256 -disable_wal=1 -duration=10 -benchmarks=fillrandom
```
Before this PR
```
DB path: [/dev/shm/rocksdb]
fillrandom : 1.831 micros/op 546235 ops/sec; 60.4 MB/s
```
After this PR
```
DB path: [/dev/shm/rocksdb]
fillrandom : 1.820 micros/op 549404 ops/sec; 60.8 MB/s
```
Reviewed By: ltamasi
Differential Revision: D33721359
Pulled By: riversand963
fbshipit-source-id: c131561534272c120ffb80711d42748d21badf09
2 years ago
|
|
|
/*protection_bytes_per_key=*/0, user_timestamp_size_);
|
|
|
|
|
Status s;
|
|
|
|
|
int64_t bytes = 0;
|
|
|
|
|
|
|
|
|
|
std::unique_ptr<const char[]> key_guard;
|
|
|
|
|
Slice key = AllocateKey(&key_guard);
|
|
|
|
|
std::unique_ptr<const char[]> begin_key_guard;
|
|
|
|
|
Slice begin_key = AllocateKey(&begin_key_guard);
|
|
|
|
|
std::unique_ptr<const char[]> end_key_guard;
|
|
|
|
|
Slice end_key = AllocateKey(&end_key_guard);
|
|
|
|
|
double p = 0.0;
|
|
|
|
|
uint64_t num_overwrites = 0, num_unique_keys = 0, num_selective_deletes = 0;
|
|
|
|
|
// If user set overwrite_probability flag,
|
|
|
|
|
// check if value is in [0.0,1.0].
|
|
|
|
|
if (FLAGS_overwrite_probability > 0.0) {
|
|
|
|
|
p = FLAGS_overwrite_probability > 1.0 ? 1.0 : FLAGS_overwrite_probability;
|
|
|
|
|
// If overwrite set by user, and UNIQUE_RANDOM mode on,
|
|
|
|
|
// the overwrite_window_size must be > 0.
|
|
|
|
|
if (write_mode == UNIQUE_RANDOM && FLAGS_overwrite_window_size == 0) {
|
|
|
|
|
fprintf(stderr,
|
|
|
|
|
"Overwrite_window_size must be strictly greater than 0.\n");
|
|
|
|
|
ErrorExit();
|
|
|
|
|
}
|
|
|
|
|
}
|
|
|
|
|
|
|
|
|
|
// Default_random_engine provides slightly
|
|
|
|
|
// improved throughput over mt19937.
|
|
|
|
|
std::default_random_engine overwrite_gen{
|
|
|
|
|
static_cast<unsigned int>(seed_base)};
|
|
|
|
|
std::bernoulli_distribution overwrite_decider(p);
|
|
|
|
|
|
|
|
|
|
// Inserted key window is filled with the last N
|
|
|
|
|
// keys previously inserted into the DB (with
|
|
|
|
|
// N=FLAGS_overwrite_window_size).
|
|
|
|
|
// We use a deque struct because:
|
|
|
|
|
// - random access is O(1)
|
|
|
|
|
// - insertion/removal at beginning/end is also O(1).
|
|
|
|
|
std::deque<int64_t> inserted_key_window;
|
|
|
|
|
Random64 reservoir_id_gen(seed_base);
|
|
|
|
|
|
|
|
|
|
// --- Variables used in disposable/persistent keys simulation:
|
|
|
|
|
// The following variables are used when
|
|
|
|
|
// disposable_entries_batch_size is >0. We simualte a workload
|
|
|
|
|
// where the following sequence is repeated multiple times:
|
|
|
|
|
// "A set of keys S1 is inserted ('disposable entries'), then after
|
|
|
|
|
// some delay another set of keys S2 is inserted ('persistent entries')
|
|
|
|
|
// and the first set of keys S1 is deleted. S2 artificially represents
|
|
|
|
|
// the insertion of hypothetical results from some undefined computation
|
|
|
|
|
// done on the first set of keys S1. The next sequence can start as soon
|
|
|
|
|
// as the last disposable entry in the set S1 of this sequence is
|
|
|
|
|
// inserted, if the delay is non negligible"
|
|
|
|
|
bool skip_for_loop = false, is_disposable_entry = true;
|
|
|
|
|
std::vector<uint64_t> disposable_entries_index(num_key_gens, 0);
|
|
|
|
|
std::vector<uint64_t> persistent_ent_and_del_index(num_key_gens, 0);
|
|
|
|
|
const uint64_t kNumDispAndPersEntries =
|
|
|
|
|
FLAGS_disposable_entries_batch_size +
|
|
|
|
|
FLAGS_persistent_entries_batch_size;
|
|
|
|
|
if (kNumDispAndPersEntries > 0) {
|
|
|
|
|
if ((write_mode != UNIQUE_RANDOM) || (writes_per_range_tombstone_ > 0) ||
|
|
|
|
|
(p > 0.0)) {
|
|
|
|
|
fprintf(
|
|
|
|
|
stderr,
|
|
|
|
|
"Disposable/persistent deletes are not compatible with overwrites "
|
|
|
|
|
"and DeleteRanges; and are only supported in filluniquerandom.\n");
|
|
|
|
|
ErrorExit();
|
|
|
|
|
}
|
|
|
|
|
if (FLAGS_disposable_entries_value_size < 0 ||
|
|
|
|
|
FLAGS_persistent_entries_value_size < 0) {
|
|
|
|
|
fprintf(
|
|
|
|
|
stderr,
|
|
|
|
|
"disposable_entries_value_size and persistent_entries_value_size"
|
|
|
|
|
"have to be positive.\n");
|
|
|
|
|
ErrorExit();
|
|
|
|
|
}
|
|
|
|
|
}
|
|
|
|
|
Random rnd_disposable_entry(static_cast<uint32_t>(seed_base));
|
|
|
|
|
std::string random_value;
|
|
|
|
|
// Queue that stores scheduled timestamp of disposable entries deletes,
|
|
|
|
|
// along with starting index of disposable entry keys to delete.
|
|
|
|
|
std::vector<std::queue<std::pair<uint64_t, uint64_t>>> disposable_entries_q(
|
|
|
|
|
num_key_gens);
|
|
|
|
|
// --- End of variables used in disposable/persistent keys simulation.
|
|
|
|
|
|
|
|
|
|
std::vector<std::unique_ptr<const char[]>> expanded_key_guards;
|
|
|
|
|
std::vector<Slice> expanded_keys;
|
|
|
|
|
if (FLAGS_expand_range_tombstones) {
|
|
|
|
|
expanded_key_guards.resize(range_tombstone_width_);
|
|
|
|
|
for (auto& expanded_key_guard : expanded_key_guards) {
|
|
|
|
|
expanded_keys.emplace_back(AllocateKey(&expanded_key_guard));
|
|
|
|
|
}
|
|
|
|
|
}
|
|
|
|
|
|
|
|
|
|
std::unique_ptr<char[]> ts_guard;
|
|
|
|
|
if (user_timestamp_size_ > 0) {
|
|
|
|
|
ts_guard.reset(new char[user_timestamp_size_]);
|
|
|
|
|
}
|
|
|
|
|
|
|
|
|
|
int64_t stage = 0;
|
|
|
|
|
int64_t num_written = 0;
|
|
|
|
|
int64_t next_seq_db_at = num_ops;
|
|
|
|
|
size_t id = 0;
|
|
|
|
|
|
|
|
|
|
while ((num_per_key_gen != 0) && !duration.Done(entries_per_batch_)) {
|
|
|
|
|
if (duration.GetStage() != stage) {
|
|
|
|
|
stage = duration.GetStage();
|
|
|
|
|
if (db_.db != nullptr) {
|
|
|
|
|
db_.CreateNewCf(open_options_, stage);
|
|
|
|
|
} else {
|
|
|
|
|
for (auto& db : multi_dbs_) {
|
|
|
|
|
db.CreateNewCf(open_options_, stage);
|
|
|
|
|
}
|
|
|
|
|
}
|
|
|
|
|
}
|
|
|
|
|
|
|
|
|
|
if (write_mode != SEQUENTIAL) {
|
|
|
|
|
id = thread->rand.Next() % num_key_gens;
|
|
|
|
|
} else {
|
|
|
|
|
// When doing a sequential load with multiple databases, load them in
|
|
|
|
|
// order rather than all at the same time to avoid:
|
|
|
|
|
// 1) long delays between flushing memtables
|
|
|
|
|
// 2) flushing memtables for all of them at the same point in time
|
|
|
|
|
// 3) not putting the same number of keys in each database
|
|
|
|
|
if (num_written >= next_seq_db_at) {
|
|
|
|
|
next_seq_db_at += num_ops;
|
|
|
|
|
id++;
|
|
|
|
|
if (id >= num_key_gens) {
|
|
|
|
|
fprintf(stderr, "Logic error. Filled all databases\n");
|
|
|
|
|
ErrorExit();
|
|
|
|
|
}
|
|
|
|
|
}
|
|
|
|
|
}
|
|
|
|
|
DBWithColumnFamilies* db_with_cfh = SelectDBWithCfh(id);
|
|
|
|
|
|
|
|
|
|
batch.Clear();
|
|
|
|
|
int64_t batch_bytes = 0;
|
|
|
|
|
|
|
|
|
|
for (int64_t j = 0; j < entries_per_batch_; j++) {
|
|
|
|
|
int64_t rand_num = 0;
|
|
|
|
|
if ((write_mode == UNIQUE_RANDOM) && (p > 0.0)) {
|
|
|
|
|
if ((inserted_key_window.size() > 0) &&
|
|
|
|
|
overwrite_decider(overwrite_gen)) {
|
|
|
|
|
num_overwrites++;
|
|
|
|
|
rand_num = inserted_key_window[reservoir_id_gen.Next() %
|
|
|
|
|
inserted_key_window.size()];
|
|
|
|
|
} else {
|
|
|
|
|
num_unique_keys++;
|
|
|
|
|
rand_num = key_gens[id]->Next();
|
|
|
|
|
if (inserted_key_window.size() < FLAGS_overwrite_window_size) {
|
|
|
|
|
inserted_key_window.push_back(rand_num);
|
|
|
|
|
} else {
|
|
|
|
|
inserted_key_window.pop_front();
|
|
|
|
|
inserted_key_window.push_back(rand_num);
|
|
|
|
|
}
|
|
|
|
|
}
|
|
|
|
|
} else if (kNumDispAndPersEntries > 0) {
|
|
|
|
|
// Check if queue is non-empty and if we need to insert
|
|
|
|
|
// 'persistent' KV entries (KV entries that are never deleted)
|
|
|
|
|
// and delete disposable entries previously inserted.
|
|
|
|
|
if (!disposable_entries_q[id].empty() &&
|
|
|
|
|
(disposable_entries_q[id].front().first <
|
|
|
|
|
FLAGS_env->NowMicros())) {
|
|
|
|
|
// If we need to perform a "merge op" pattern,
|
|
|
|
|
// we first write all the persistent KV entries not targeted
|
|
|
|
|
// by deletes, and then we write the disposable entries deletes.
|
|
|
|
|
if (persistent_ent_and_del_index[id] <
|
|
|
|
|
FLAGS_persistent_entries_batch_size) {
|
|
|
|
|
// Generate key to insert.
|
|
|
|
|
rand_num =
|
|
|
|
|
key_gens[id]->Fetch(disposable_entries_q[id].front().second +
|
|
|
|
|
FLAGS_disposable_entries_batch_size +
|
|
|
|
|
persistent_ent_and_del_index[id]);
|
|
|
|
|
persistent_ent_and_del_index[id]++;
|
|
|
|
|
is_disposable_entry = false;
|
|
|
|
|
skip_for_loop = false;
|
|
|
|
|
} else if (persistent_ent_and_del_index[id] <
|
|
|
|
|
kNumDispAndPersEntries) {
|
|
|
|
|
// Find key of the entry to delete.
|
|
|
|
|
rand_num =
|
|
|
|
|
key_gens[id]->Fetch(disposable_entries_q[id].front().second +
|
|
|
|
|
(persistent_ent_and_del_index[id] -
|
|
|
|
|
FLAGS_persistent_entries_batch_size));
|
|
|
|
|
persistent_ent_and_del_index[id]++;
|
|
|
|
|
GenerateKeyFromInt(rand_num, FLAGS_num, &key);
|
|
|
|
|
// For the delete operation, everything happens here and we
|
|
|
|
|
// skip the rest of the for-loop, which is designed for
|
|
|
|
|
// inserts.
|
|
|
|
|
if (FLAGS_num_column_families <= 1) {
|
|
|
|
|
batch.Delete(key);
|
|
|
|
|
} else {
|
|
|
|
|
// We use same rand_num as seed for key and column family so
|
|
|
|
|
// that we can deterministically find the cfh corresponding to a
|
|
|
|
|
// particular key while reading the key.
|
|
|
|
|
batch.Delete(db_with_cfh->GetCfh(rand_num), key);
|
|
|
|
|
}
|
|
|
|
|
// A delete only includes Key+Timestamp (no value).
|
|
|
|
|
batch_bytes += key_size_ + user_timestamp_size_;
|
|
|
|
|
bytes += key_size_ + user_timestamp_size_;
|
|
|
|
|
num_selective_deletes++;
|
|
|
|
|
// Skip rest of the for-loop (j=0, j<entries_per_batch_,j++).
|
|
|
|
|
skip_for_loop = true;
|
|
|
|
|
} else {
|
|
|
|
|
assert(false); // should never reach this point.
|
|
|
|
|
}
|
|
|
|
|
// If disposable_entries_q needs to be updated (ie: when a selective
|
|
|
|
|
// insert+delete was successfully completed, pop the job out of the
|
|
|
|
|
// queue).
|
|
|
|
|
if (!disposable_entries_q[id].empty() &&
|
|
|
|
|
(disposable_entries_q[id].front().first <
|
|
|
|
|
FLAGS_env->NowMicros()) &&
|
|
|
|
|
persistent_ent_and_del_index[id] == kNumDispAndPersEntries) {
|
|
|
|
|
disposable_entries_q[id].pop();
|
|
|
|
|
persistent_ent_and_del_index[id] = 0;
|
|
|
|
|
}
|
|
|
|
|
|
|
|
|
|
// If we are deleting disposable entries, skip the rest of the
|
|
|
|
|
// for-loop since there is no key-value inserts at this moment in
|
|
|
|
|
// time.
|
|
|
|
|
if (skip_for_loop) {
|
|
|
|
|
continue;
|
|
|
|
|
}
|
|
|
|
|
|
|
|
|
|
}
|
|
|
|
|
// If no job is in the queue, then we keep inserting disposable KV
|
|
|
|
|
// entries that will be deleted later by a series of deletes.
|
|
|
|
|
else {
|
|
|
|
|
rand_num = key_gens[id]->Fetch(disposable_entries_index[id]);
|
|
|
|
|
disposable_entries_index[id]++;
|
|
|
|
|
is_disposable_entry = true;
|
|
|
|
|
if ((disposable_entries_index[id] %
|
|
|
|
|
FLAGS_disposable_entries_batch_size) == 0) {
|
|
|
|
|
// Skip the persistent KV entries inserts for now
|
|
|
|
|
disposable_entries_index[id] +=
|
|
|
|
|
FLAGS_persistent_entries_batch_size;
|
|
|
|
|
}
|
|
|
|
|
}
|
|
|
|
|
} else {
|
|
|
|
|
rand_num = key_gens[id]->Next();
|
|
|
|
|
}
|
|
|
|
|
GenerateKeyFromInt(rand_num, FLAGS_num, &key);
|
|
|
|
|
Slice val;
|
|
|
|
|
if (kNumDispAndPersEntries > 0) {
|
|
|
|
|
random_value = rnd_disposable_entry.RandomString(
|
|
|
|
|
is_disposable_entry ? FLAGS_disposable_entries_value_size
|
|
|
|
|
: FLAGS_persistent_entries_value_size);
|
|
|
|
|
val = Slice(random_value);
|
|
|
|
|
num_unique_keys++;
|
|
|
|
|
} else {
|
|
|
|
|
val = gen.Generate();
|
|
|
|
|
}
|
|
|
|
|
if (use_blob_db_) {
|
|
|
|
|
#ifndef ROCKSDB_LITE
|
|
|
|
|
// Stacked BlobDB
|
|
|
|
|
blob_db::BlobDB* blobdb =
|
|
|
|
|
static_cast<blob_db::BlobDB*>(db_with_cfh->db);
|
|
|
|
|
if (FLAGS_blob_db_max_ttl_range > 0) {
|
|
|
|
|
int ttl = rand() % FLAGS_blob_db_max_ttl_range;
|
|
|
|
|
s = blobdb->PutWithTTL(write_options_, key, val, ttl);
|
|
|
|
|
} else {
|
|
|
|
|
s = blobdb->Put(write_options_, key, val);
|
|
|
|
|
}
|
|
|
|
|
#endif // ROCKSDB_LITE
|
|
|
|
|
} else if (FLAGS_num_column_families <= 1) {
|
|
|
|
|
batch.Put(key, val);
|
|
|
|
|
} else {
|
|
|
|
|
// We use same rand_num as seed for key and column family so that we
|
|
|
|
|
// can deterministically find the cfh corresponding to a particular
|
|
|
|
|
// key while reading the key.
|
|
|
|
|
batch.Put(db_with_cfh->GetCfh(rand_num), key,
|
|
|
|
|
val);
|
|
|
|
|
}
|
|
|
|
|
batch_bytes += val.size() + key_size_ + user_timestamp_size_;
|
|
|
|
|
bytes += val.size() + key_size_ + user_timestamp_size_;
|
|
|
|
|
++num_written;
|
|
|
|
|
|
|
|
|
|
// If all disposable entries have been inserted, then we need to
|
|
|
|
|
// add in the job queue a call for 'persistent entry insertions +
|
|
|
|
|
// disposable entry deletions'.
|
|
|
|
|
if (kNumDispAndPersEntries > 0 && is_disposable_entry &&
|
|
|
|
|
((disposable_entries_index[id] % kNumDispAndPersEntries) == 0)) {
|
|
|
|
|
// Queue contains [timestamp, starting_idx],
|
|
|
|
|
// timestamp = current_time + delay (minimum aboslute time when to
|
|
|
|
|
// start inserting the selective deletes) starting_idx = index in the
|
|
|
|
|
// keygen of the rand_num to generate the key of the first KV entry to
|
|
|
|
|
// delete (= key of the first selective delete).
|
|
|
|
|
disposable_entries_q[id].push(std::make_pair(
|
|
|
|
|
FLAGS_env->NowMicros() +
|
|
|
|
|
FLAGS_disposable_entries_delete_delay /* timestamp */,
|
|
|
|
|
disposable_entries_index[id] - kNumDispAndPersEntries
|
|
|
|
|
/*starting idx*/));
|
|
|
|
|
}
|
|
|
|
|
if (writes_per_range_tombstone_ > 0 &&
|
|
|
|
|
num_written > writes_before_delete_range_ &&
|
|
|
|
|
(num_written - writes_before_delete_range_) /
|
|
|
|
|
writes_per_range_tombstone_ <=
|
|
|
|
|
max_num_range_tombstones_ &&
|
|
|
|
|
(num_written - writes_before_delete_range_) %
|
|
|
|
|
writes_per_range_tombstone_ ==
|
|
|
|
|
0) {
|
|
|
|
|
int64_t begin_num = key_gens[id]->Next();
|
|
|
|
|
if (FLAGS_expand_range_tombstones) {
|
|
|
|
|
for (int64_t offset = 0; offset < range_tombstone_width_;
|
|
|
|
|
++offset) {
|
|
|
|
|
GenerateKeyFromInt(begin_num + offset, FLAGS_num,
|
|
|
|
|
&expanded_keys[offset]);
|
|
|
|
|
if (use_blob_db_) {
|
|
|
|
|
#ifndef ROCKSDB_LITE
|
|
|
|
|
// Stacked BlobDB
|
|
|
|
|
s = db_with_cfh->db->Delete(write_options_,
|
|
|
|
|
expanded_keys[offset]);
|
|
|
|
|
#endif // ROCKSDB_LITE
|
|
|
|
|
} else if (FLAGS_num_column_families <= 1) {
|
|
|
|
|
batch.Delete(expanded_keys[offset]);
|
|
|
|
|
} else {
|
|
|
|
|
batch.Delete(db_with_cfh->GetCfh(rand_num),
|
|
|
|
|
expanded_keys[offset]);
|
|
|
|
|
}
|
|
|
|
|
}
|
|
|
|
|
} else {
|
|
|
|
|
GenerateKeyFromInt(begin_num, FLAGS_num, &begin_key);
|
|
|
|
|
GenerateKeyFromInt(begin_num + range_tombstone_width_, FLAGS_num,
|
|
|
|
|
&end_key);
|
|
|
|
|
if (use_blob_db_) {
|
|
|
|
|
#ifndef ROCKSDB_LITE
|
|
|
|
|
// Stacked BlobDB
|
|
|
|
|
s = db_with_cfh->db->DeleteRange(
|
|
|
|
|
write_options_, db_with_cfh->db->DefaultColumnFamily(),
|
|
|
|
|
begin_key, end_key);
|
|
|
|
|
#endif // ROCKSDB_LITE
|
|
|
|
|
} else if (FLAGS_num_column_families <= 1) {
|
|
|
|
|
batch.DeleteRange(begin_key, end_key);
|
|
|
|
|
} else {
|
|
|
|
|
batch.DeleteRange(db_with_cfh->GetCfh(rand_num), begin_key,
|
|
|
|
|
end_key);
|
|
|
|
|
}
|
|
|
|
|
}
|
|
|
|
|
}
|
|
|
|
|
}
|
|
|
|
|
if (thread->shared->write_rate_limiter.get() != nullptr) {
|
|
|
|
|
thread->shared->write_rate_limiter->Request(
|
|
|
|
|
batch_bytes, Env::IO_HIGH,
|
|
|
|
|
nullptr /* stats */, RateLimiter::OpType::kWrite);
|
|
|
|
|
// Set time at which last op finished to Now() to hide latency and
|
|
|
|
|
// sleep from rate limiter. Also, do the check once per batch, not
|
|
|
|
|
// once per write.
|
|
|
|
|
thread->stats.ResetLastOpTime();
|
|
|
|
|
}
|
|
|
|
|
if (user_timestamp_size_ > 0) {
|
|
|
|
|
Slice user_ts = mock_app_clock_->Allocate(ts_guard.get());
|
Revise APIs related to user-defined timestamp (#8946)
Summary:
ajkr reminded me that we have a rule of not including per-kv related data in `WriteOptions`.
Namely, `WriteOptions` should not include information about "what-to-write", but should just
include information about "how-to-write".
According to this rule, `WriteOptions::timestamp` (experimental) is clearly a violation. Therefore,
this PR removes `WriteOptions::timestamp` for compliance.
After the removal, we need to pass timestamp info via another set of APIs. This PR proposes a set
of overloaded functions `Put(write_opts, key, value, ts)`, `Delete(write_opts, key, ts)`, and
`SingleDelete(write_opts, key, ts)`. Planned to add `Write(write_opts, batch, ts)`, but its complexity
made me reconsider doing it in another PR (maybe).
For better checking and returning error early, we also add a new set of APIs to `WriteBatch` that take
extra `timestamp` information when writing to `WriteBatch`es.
These set of APIs in `WriteBatchWithIndex` are currently not supported, and are on our TODO list.
Removed `WriteBatch::AssignTimestamps()` and renamed `WriteBatch::AssignTimestamp()` to
`WriteBatch::UpdateTimestamps()` since this method require that all keys have space for timestamps
allocated already and multiple timestamps can be updated.
The constructor of `WriteBatch` now takes a fourth argument `default_cf_ts_sz` which is the timestamp
size of the default column family. This will be used to allocate space when calling APIs that do not
specify a column family handle.
Also, updated `DB::Get()`, `DB::MultiGet()`, `DB::NewIterator()`, `DB::NewIterators()` methods, replacing
some assertions about timestamp to returning Status code.
Pull Request resolved: https://github.com/facebook/rocksdb/pull/8946
Test Plan:
make check
./db_bench -benchmarks=fillseq,fillrandom,readrandom,readseq,deleterandom -user_timestamp_size=8
./db_stress --user_timestamp_size=8 -nooverwritepercent=0 -test_secondary=0 -secondary_catch_up_one_in=0 -continuous_verification_interval=0
Make sure there is no perf regression by running the following
```
./db_bench_opt -db=/dev/shm/rocksdb -use_existing_db=0 -level0_stop_writes_trigger=256 -level0_slowdown_writes_trigger=256 -level0_file_num_compaction_trigger=256 -disable_wal=1 -duration=10 -benchmarks=fillrandom
```
Before this PR
```
DB path: [/dev/shm/rocksdb]
fillrandom : 1.831 micros/op 546235 ops/sec; 60.4 MB/s
```
After this PR
```
DB path: [/dev/shm/rocksdb]
fillrandom : 1.820 micros/op 549404 ops/sec; 60.8 MB/s
```
Reviewed By: ltamasi
Differential Revision: D33721359
Pulled By: riversand963
fbshipit-source-id: c131561534272c120ffb80711d42748d21badf09
2 years ago
|
|
|
s = batch.UpdateTimestamps(
|
|
|
|
|
user_ts, [this](uint32_t) { return user_timestamp_size_; });
|
|
|
|
|
if (!s.ok()) {
|
|
|
|
|
fprintf(stderr, "assign timestamp to write batch: %s\n",
|
|
|
|
|
s.ToString().c_str());
|
|
|
|
|
ErrorExit();
|
|
|
|
|
}
|
|
|
|
|
}
|
|
|
|
|
if (!use_blob_db_) {
|
|
|
|
|
// Not stacked BlobDB
|
|
|
|
|
s = db_with_cfh->db->Write(write_options_, &batch);
|
|
|
|
|
}
|
|
|
|
|
thread->stats.FinishedOps(db_with_cfh, db_with_cfh->db,
|
|
|
|
|
entries_per_batch_, kWrite);
|
|
|
|
|
if (FLAGS_sine_write_rate) {
|
|
|
|
|
uint64_t now = FLAGS_env->NowMicros();
|
|
|
|
|
|
|
|
|
|
uint64_t usecs_since_last;
|
|
|
|
|
if (now > thread->stats.GetSineInterval()) {
|
|
|
|
|
usecs_since_last = now - thread->stats.GetSineInterval();
|
|
|
|
|
} else {
|
|
|
|
|
usecs_since_last = 0;
|
|
|
|
|
}
|
|
|
|
|
|
|
|
|
|
if (usecs_since_last >
|
|
|
|
|
(FLAGS_sine_write_rate_interval_milliseconds * uint64_t{1000})) {
|
|
|
|
|
double usecs_since_start =
|
|
|
|
|
static_cast<double>(now - thread->stats.GetStart());
|
|
|
|
|
thread->stats.ResetSineInterval();
|
|
|
|
|
uint64_t write_rate =
|
|
|
|
|
static_cast<uint64_t>(SineRate(usecs_since_start / 1000000.0));
|
|
|
|
|
thread->shared->write_rate_limiter.reset(
|
|
|
|
|
NewGenericRateLimiter(write_rate));
|
|
|
|
|
}
|
|
|
|
|
}
|
Auto recovery from out of space errors (#4164)
Summary:
This commit implements automatic recovery from a Status::NoSpace() error
during background operations such as write callback, flush and
compaction. The broad design is as follows -
1. Compaction errors are treated as soft errors and don't put the
database in read-only mode. A compaction is delayed until enough free
disk space is available to accomodate the compaction outputs, which is
estimated based on the input size. This means that users can continue to
write, and we rely on the WriteController to delay or stop writes if the
compaction debt becomes too high due to persistent low disk space
condition
2. Errors during write callback and flush are treated as hard errors,
i.e the database is put in read-only mode and goes back to read-write
only fater certain recovery actions are taken.
3. Both types of recovery rely on the SstFileManagerImpl to poll for
sufficient disk space. We assume that there is a 1-1 mapping between an
SFM and the underlying OS storage container. For cases where multiple
DBs are hosted on a single storage container, the user is expected to
allocate a single SFM instance and use the same one for all the DBs. If
no SFM is specified by the user, DBImpl::Open() will allocate one, but
this will be one per DB and each DB will recover independently. The
recovery implemented by SFM is as follows -
a) On the first occurance of an out of space error during compaction,
subsequent
compactions will be delayed until the disk free space check indicates
enough available space. The required space is computed as the sum of
input sizes.
b) The free space check requirement will be removed once the amount of
free space is greater than the size reserved by in progress
compactions when the first error occured
c) If the out of space error is a hard error, a background thread in
SFM will poll for sufficient headroom before triggering the recovery
of the database and putting it in write-only mode. The headroom is
calculated as the sum of the write_buffer_size of all the DB instances
associated with the SFM
4. EventListener callbacks will be called at the start and completion of
automatic recovery. Users can disable the auto recov ery in the start
callback, and later initiate it manually by calling DB::Resume()
Todo:
1. More extensive testing
2. Add disk full condition to db_stress (follow-on PR)
Pull Request resolved: https://github.com/facebook/rocksdb/pull/4164
Differential Revision: D9846378
Pulled By: anand1976
fbshipit-source-id: 80ea875dbd7f00205e19c82215ff6e37da10da4a
6 years ago
|
|
|
if (!s.ok()) {
|
|
|
|
|
s = listener_->WaitForRecovery(600000000) ? Status::OK() : s;
|
|
|
|
|
}
|
|
|
|
|
|
|
|
|
|
if (!s.ok()) {
|
|
|
|
|
fprintf(stderr, "put error: %s\n", s.ToString().c_str());
|
|
|
|
|
ErrorExit();
|
|
|
|
|
}
|
|
|
|
|
}
|
|
|
|
|
if ((write_mode == UNIQUE_RANDOM) && (p > 0.0)) {
|
|
|
|
|
fprintf(stdout,
|
|
|
|
|
"Number of unique keys inserted: %" PRIu64
|
|
|
|
|
".\nNumber of overwrites: %" PRIu64 "\n",
|
|
|
|
|
num_unique_keys, num_overwrites);
|
|
|
|
|
} else if (kNumDispAndPersEntries > 0) {
|
|
|
|
|
fprintf(stdout,
|
|
|
|
|
"Number of unique keys inserted (disposable+persistent): %" PRIu64
|
|
|
|
|
".\nNumber of 'disposable entry delete': %" PRIu64 "\n",
|
|
|
|
|
num_written, num_selective_deletes);
|
|
|
|
|
}
|
|
|
|
|
thread->stats.AddBytes(bytes);
|
|
|
|
|
}
|
|
|
|
|
|
|
|
|
|
Status DoDeterministicCompact(ThreadState* thread,
|
|
|
|
|
CompactionStyle compaction_style,
|
|
|
|
|
WriteMode write_mode) {
|
|
|
|
|
#ifndef ROCKSDB_LITE
|
|
|
|
|
ColumnFamilyMetaData meta;
|
|
|
|
|
std::vector<DB*> db_list;
|
|
|
|
|
if (db_.db != nullptr) {
|
|
|
|
|
db_list.push_back(db_.db);
|
|
|
|
|
} else {
|
|
|
|
|
for (auto& db : multi_dbs_) {
|
|
|
|
|
db_list.push_back(db.db);
|
|
|
|
|
}
|
|
|
|
|
}
|
|
|
|
|
std::vector<Options> options_list;
|
|
|
|
|
for (auto db : db_list) {
|
|
|
|
|
options_list.push_back(db->GetOptions());
|
|
|
|
|
if (compaction_style != kCompactionStyleFIFO) {
|
|
|
|
|
db->SetOptions({{"disable_auto_compactions", "1"},
|
|
|
|
|
{"level0_slowdown_writes_trigger", "400000000"},
|
|
|
|
|
{"level0_stop_writes_trigger", "400000000"}});
|
|
|
|
|
} else {
|
|
|
|
|
db->SetOptions({{"disable_auto_compactions", "1"}});
|
|
|
|
|
}
|
|
|
|
|
}
|
|
|
|
|
|
|
|
|
|
assert(!db_list.empty());
|
|
|
|
|
auto num_db = db_list.size();
|
|
|
|
|
size_t num_levels = static_cast<size_t>(open_options_.num_levels);
|
|
|
|
|
size_t output_level = open_options_.num_levels - 1;
|
|
|
|
|
std::vector<std::vector<std::vector<SstFileMetaData>>> sorted_runs(num_db);
|
|
|
|
|
std::vector<size_t> num_files_at_level0(num_db, 0);
|
|
|
|
|
if (compaction_style == kCompactionStyleLevel) {
|
|
|
|
|
if (num_levels == 0) {
|
|
|
|
|
return Status::InvalidArgument("num_levels should be larger than 1");
|
|
|
|
|
}
|
|
|
|
|
bool should_stop = false;
|
|
|
|
|
while (!should_stop) {
|
|
|
|
|
if (sorted_runs[0].empty()) {
|
|
|
|
|
DoWrite(thread, write_mode);
|
|
|
|
|
} else {
|
|
|
|
|
DoWrite(thread, UNIQUE_RANDOM);
|
|
|
|
|
}
|
|
|
|
|
for (size_t i = 0; i < num_db; i++) {
|
|
|
|
|
auto db = db_list[i];
|
|
|
|
|
db->Flush(FlushOptions());
|
|
|
|
|
db->GetColumnFamilyMetaData(&meta);
|
|
|
|
|
if (num_files_at_level0[i] == meta.levels[0].files.size() ||
|
|
|
|
|
writes_ == 0) {
|
|
|
|
|
should_stop = true;
|
|
|
|
|
continue;
|
|
|
|
|
}
|
|
|
|
|
sorted_runs[i].emplace_back(
|
|
|
|
|
meta.levels[0].files.begin(),
|
|
|
|
|
meta.levels[0].files.end() - num_files_at_level0[i]);
|
|
|
|
|
num_files_at_level0[i] = meta.levels[0].files.size();
|
|
|
|
|
if (sorted_runs[i].back().size() == 1) {
|
|
|
|
|
should_stop = true;
|
|
|
|
|
continue;
|
|
|
|
|
}
|
|
|
|
|
if (sorted_runs[i].size() == output_level) {
|
|
|
|
|
auto& L1 = sorted_runs[i].back();
|
|
|
|
|
L1.erase(L1.begin(), L1.begin() + L1.size() / 3);
|
|
|
|
|
should_stop = true;
|
|
|
|
|
continue;
|
|
|
|
|
}
|
|
|
|
|
}
|
|
|
|
|
writes_ /= static_cast<int64_t>(open_options_.max_bytes_for_level_multiplier);
|
|
|
|
|
}
|
|
|
|
|
for (size_t i = 0; i < num_db; i++) {
|
|
|
|
|
if (sorted_runs[i].size() < num_levels - 1) {
|
|
|
|
|
fprintf(stderr, "n is too small to fill %" ROCKSDB_PRIszt " levels\n", num_levels);
|
|
|
|
|
exit(1);
|
|
|
|
|
}
|
|
|
|
|
}
|
|
|
|
|
for (size_t i = 0; i < num_db; i++) {
|
|
|
|
|
auto db = db_list[i];
|
|
|
|
|
auto compactionOptions = CompactionOptions();
|
|
|
|
|
compactionOptions.compression = FLAGS_compression_type_e;
|
|
|
|
|
auto options = db->GetOptions();
|
|
|
|
|
MutableCFOptions mutable_cf_options(options);
|
|
|
|
|
for (size_t j = 0; j < sorted_runs[i].size(); j++) {
|
|
|
|
|
compactionOptions.output_file_size_limit =
|
|
|
|
|
MaxFileSizeForLevel(mutable_cf_options,
|
|
|
|
|
static_cast<int>(output_level), compaction_style);
|
|
|
|
|
std::cout << sorted_runs[i][j].size() << std::endl;
|
|
|
|
|
db->CompactFiles(compactionOptions, {sorted_runs[i][j].back().name,
|
|
|
|
|
sorted_runs[i][j].front().name},
|
|
|
|
|
static_cast<int>(output_level - j) /*level*/);
|
|
|
|
|
}
|
|
|
|
|
}
|
|
|
|
|
} else if (compaction_style == kCompactionStyleUniversal) {
|
|
|
|
|
auto ratio = open_options_.compaction_options_universal.size_ratio;
|
|
|
|
|
bool should_stop = false;
|
|
|
|
|
while (!should_stop) {
|
|
|
|
|
if (sorted_runs[0].empty()) {
|
|
|
|
|
DoWrite(thread, write_mode);
|
|
|
|
|
} else {
|
|
|
|
|
DoWrite(thread, UNIQUE_RANDOM);
|
|
|
|
|
}
|
|
|
|
|
for (size_t i = 0; i < num_db; i++) {
|
|
|
|
|
auto db = db_list[i];
|
|
|
|
|
db->Flush(FlushOptions());
|
|
|
|
|
db->GetColumnFamilyMetaData(&meta);
|
|
|
|
|
if (num_files_at_level0[i] == meta.levels[0].files.size() ||
|
|
|
|
|
writes_ == 0) {
|
|
|
|
|
should_stop = true;
|
|
|
|
|
continue;
|
|
|
|
|
}
|
|
|
|
|
sorted_runs[i].emplace_back(
|
|
|
|
|
meta.levels[0].files.begin(),
|
|
|
|
|
meta.levels[0].files.end() - num_files_at_level0[i]);
|
|
|
|
|
num_files_at_level0[i] = meta.levels[0].files.size();
|
|
|
|
|
if (sorted_runs[i].back().size() == 1) {
|
|
|
|
|
should_stop = true;
|
|
|
|
|
continue;
|
|
|
|
|
}
|
|
|
|
|
num_files_at_level0[i] = meta.levels[0].files.size();
|
|
|
|
|
}
|
|
|
|
|
writes_ = static_cast<int64_t>(writes_* static_cast<double>(100) / (ratio + 200));
|
|
|
|
|
}
|
|
|
|
|
for (size_t i = 0; i < num_db; i++) {
|
|
|
|
|
if (sorted_runs[i].size() < num_levels) {
|
|
|
|
|
fprintf(stderr, "n is too small to fill %" ROCKSDB_PRIszt " levels\n", num_levels);
|
|
|
|
|
exit(1);
|
|
|
|
|
}
|
|
|
|
|
}
|
|
|
|
|
for (size_t i = 0; i < num_db; i++) {
|
|
|
|
|
auto db = db_list[i];
|
|
|
|
|
auto compactionOptions = CompactionOptions();
|
|
|
|
|
compactionOptions.compression = FLAGS_compression_type_e;
|
|
|
|
|
auto options = db->GetOptions();
|
|
|
|
|
MutableCFOptions mutable_cf_options(options);
|
|
|
|
|
for (size_t j = 0; j < sorted_runs[i].size(); j++) {
|
|
|
|
|
compactionOptions.output_file_size_limit =
|
|
|
|
|
MaxFileSizeForLevel(mutable_cf_options,
|
|
|
|
|
static_cast<int>(output_level), compaction_style);
|
|
|
|
|
db->CompactFiles(
|
|
|
|
|
compactionOptions,
|
|
|
|
|
{sorted_runs[i][j].back().name, sorted_runs[i][j].front().name},
|
|
|
|
|
(output_level > j ? static_cast<int>(output_level - j)
|
|
|
|
|
: 0) /*level*/);
|
|
|
|
|
}
|
|
|
|
|
}
|
|
|
|
|
} else if (compaction_style == kCompactionStyleFIFO) {
|
|
|
|
|
if (num_levels != 1) {
|
|
|
|
|
return Status::InvalidArgument(
|
|
|
|
|
"num_levels should be 1 for FIFO compaction");
|
|
|
|
|
}
|
|
|
|
|
if (FLAGS_num_multi_db != 0) {
|
|
|
|
|
return Status::InvalidArgument("Doesn't support multiDB");
|
|
|
|
|
}
|
|
|
|
|
auto db = db_list[0];
|
|
|
|
|
std::vector<std::string> file_names;
|
|
|
|
|
while (true) {
|
|
|
|
|
if (sorted_runs[0].empty()) {
|
|
|
|
|
DoWrite(thread, write_mode);
|
|
|
|
|
} else {
|
|
|
|
|
DoWrite(thread, UNIQUE_RANDOM);
|
|
|
|
|
}
|
|
|
|
|
db->Flush(FlushOptions());
|
|
|
|
|
db->GetColumnFamilyMetaData(&meta);
|
|
|
|
|
auto total_size = meta.levels[0].size;
|
|
|
|
|
if (total_size >=
|
|
|
|
|
db->GetOptions().compaction_options_fifo.max_table_files_size) {
|
|
|
|
|
for (auto file_meta : meta.levels[0].files) {
|
|
|
|
|
file_names.emplace_back(file_meta.name);
|
|
|
|
|
}
|
|
|
|
|
break;
|
|
|
|
|
}
|
|
|
|
|
}
|
|
|
|
|
// TODO(shuzhang1989): Investigate why CompactFiles not working
|
|
|
|
|
// auto compactionOptions = CompactionOptions();
|
|
|
|
|
// db->CompactFiles(compactionOptions, file_names, 0);
|
|
|
|
|
auto compactionOptions = CompactRangeOptions();
|
|
|
|
|
db->CompactRange(compactionOptions, nullptr, nullptr);
|
|
|
|
|
} else {
|
|
|
|
|
fprintf(stdout,
|
|
|
|
|
"%-12s : skipped (-compaction_stype=kCompactionStyleNone)\n",
|
|
|
|
|
"filldeterministic");
|
|
|
|
|
return Status::InvalidArgument("None compaction is not supported");
|
|
|
|
|
}
|
|
|
|
|
|
|
|
|
|
// Verify seqno and key range
|
|
|
|
|
// Note: the seqno get changed at the max level by implementation
|
|
|
|
|
// optimization, so skip the check of the max level.
|
|
|
|
|
#ifndef NDEBUG
|
|
|
|
|
for (size_t k = 0; k < num_db; k++) {
|
|
|
|
|
auto db = db_list[k];
|
|
|
|
|
db->GetColumnFamilyMetaData(&meta);
|
|
|
|
|
// verify the number of sorted runs
|
|
|
|
|
if (compaction_style == kCompactionStyleLevel) {
|
|
|
|
|
assert(num_levels - 1 == sorted_runs[k].size());
|
|
|
|
|
} else if (compaction_style == kCompactionStyleUniversal) {
|
|
|
|
|
assert(meta.levels[0].files.size() + num_levels - 1 ==
|
|
|
|
|
sorted_runs[k].size());
|
|
|
|
|
} else if (compaction_style == kCompactionStyleFIFO) {
|
|
|
|
|
// TODO(gzh): FIFO compaction
|
|
|
|
|
db->GetColumnFamilyMetaData(&meta);
|
|
|
|
|
auto total_size = meta.levels[0].size;
|
|
|
|
|
assert(total_size <=
|
|
|
|
|
db->GetOptions().compaction_options_fifo.max_table_files_size);
|
|
|
|
|
break;
|
|
|
|
|
}
|
|
|
|
|
|
|
|
|
|
// verify smallest/largest seqno and key range of each sorted run
|
|
|
|
|
auto max_level = num_levels - 1;
|
|
|
|
|
int level;
|
|
|
|
|
for (size_t i = 0; i < sorted_runs[k].size(); i++) {
|
|
|
|
|
level = static_cast<int>(max_level - i);
|
|
|
|
|
SequenceNumber sorted_run_smallest_seqno = kMaxSequenceNumber;
|
|
|
|
|
SequenceNumber sorted_run_largest_seqno = 0;
|
|
|
|
|
std::string sorted_run_smallest_key, sorted_run_largest_key;
|
|
|
|
|
bool first_key = true;
|
|
|
|
|
for (auto fileMeta : sorted_runs[k][i]) {
|
|
|
|
|
sorted_run_smallest_seqno =
|
|
|
|
|
std::min(sorted_run_smallest_seqno, fileMeta.smallest_seqno);
|
|
|
|
|
sorted_run_largest_seqno =
|
|
|
|
|
std::max(sorted_run_largest_seqno, fileMeta.largest_seqno);
|
|
|
|
|
if (first_key ||
|
|
|
|
|
db->DefaultColumnFamily()->GetComparator()->Compare(
|
|
|
|
|
fileMeta.smallestkey, sorted_run_smallest_key) < 0) {
|
|
|
|
|
sorted_run_smallest_key = fileMeta.smallestkey;
|
|
|
|
|
}
|
|
|
|
|
if (first_key ||
|
|
|
|
|
db->DefaultColumnFamily()->GetComparator()->Compare(
|
|
|
|
|
fileMeta.largestkey, sorted_run_largest_key) > 0) {
|
|
|
|
|
sorted_run_largest_key = fileMeta.largestkey;
|
|
|
|
|
}
|
|
|
|
|
first_key = false;
|
|
|
|
|
}
|
|
|
|
|
if (compaction_style == kCompactionStyleLevel ||
|
|
|
|
|
(compaction_style == kCompactionStyleUniversal && level > 0)) {
|
|
|
|
|
SequenceNumber level_smallest_seqno = kMaxSequenceNumber;
|
|
|
|
|
SequenceNumber level_largest_seqno = 0;
|
|
|
|
|
for (auto fileMeta : meta.levels[level].files) {
|
|
|
|
|
level_smallest_seqno =
|
|
|
|
|
std::min(level_smallest_seqno, fileMeta.smallest_seqno);
|
|
|
|
|
level_largest_seqno =
|
|
|
|
|
std::max(level_largest_seqno, fileMeta.largest_seqno);
|
|
|
|
|
}
|
|
|
|
|
assert(sorted_run_smallest_key ==
|
|
|
|
|
meta.levels[level].files.front().smallestkey);
|
|
|
|
|
assert(sorted_run_largest_key ==
|
|
|
|
|
meta.levels[level].files.back().largestkey);
|
|
|
|
|
if (level != static_cast<int>(max_level)) {
|
|
|
|
|
// compaction at max_level would change sequence number
|
|
|
|
|
assert(sorted_run_smallest_seqno == level_smallest_seqno);
|
|
|
|
|
assert(sorted_run_largest_seqno == level_largest_seqno);
|
|
|
|
|
}
|
|
|
|
|
} else if (compaction_style == kCompactionStyleUniversal) {
|
|
|
|
|
// level <= 0 means sorted runs on level 0
|
|
|
|
|
auto level0_file =
|
|
|
|
|
meta.levels[0].files[sorted_runs[k].size() - 1 - i];
|
|
|
|
|
assert(sorted_run_smallest_key == level0_file.smallestkey);
|
|
|
|
|
assert(sorted_run_largest_key == level0_file.largestkey);
|
|
|
|
|
if (level != static_cast<int>(max_level)) {
|
|
|
|
|
assert(sorted_run_smallest_seqno == level0_file.smallest_seqno);
|
|
|
|
|
assert(sorted_run_largest_seqno == level0_file.largest_seqno);
|
|
|
|
|
}
|
|
|
|
|
}
|
|
|
|
|
}
|
|
|
|
|
}
|
|
|
|
|
#endif
|
|
|
|
|
// print the size of each sorted_run
|
|
|
|
|
for (size_t k = 0; k < num_db; k++) {
|
|
|
|
|
auto db = db_list[k];
|
|
|
|
|
fprintf(stdout,
|
|
|
|
|
"---------------------- DB %" ROCKSDB_PRIszt " LSM ---------------------\n", k);
|
|
|
|
|
db->GetColumnFamilyMetaData(&meta);
|
|
|
|
|
for (auto& levelMeta : meta.levels) {
|
|
|
|
|
if (levelMeta.files.empty()) {
|
|
|
|
|
continue;
|
|
|
|
|
}
|
|
|
|
|
if (levelMeta.level == 0) {
|
|
|
|
|
for (auto& fileMeta : levelMeta.files) {
|
|
|
|
|
fprintf(stdout, "Level[%d]: %s(size: %" PRIi64 " bytes)\n",
|
|
|
|
|
levelMeta.level, fileMeta.name.c_str(), fileMeta.size);
|
|
|
|
|
}
|
|
|
|
|
} else {
|
|
|
|
|
fprintf(stdout, "Level[%d]: %s - %s(total size: %" PRIi64 " bytes)\n",
|
|
|
|
|
levelMeta.level, levelMeta.files.front().name.c_str(),
|
|
|
|
|
levelMeta.files.back().name.c_str(), levelMeta.size);
|
|
|
|
|
}
|
|
|
|
|
}
|
|
|
|
|
}
|
|
|
|
|
for (size_t i = 0; i < num_db; i++) {
|
|
|
|
|
db_list[i]->SetOptions(
|
|
|
|
|
{{"disable_auto_compactions",
|
|
|
|
|
std::to_string(options_list[i].disable_auto_compactions)},
|
|
|
|
|
{"level0_slowdown_writes_trigger",
|
|
|
|
|
std::to_string(options_list[i].level0_slowdown_writes_trigger)},
|
|
|
|
|
{"level0_stop_writes_trigger",
|
|
|
|
|
std::to_string(options_list[i].level0_stop_writes_trigger)}});
|
|
|
|
|
}
|
|
|
|
|
return Status::OK();
|
|
|
|
|
#else
|
|
|
|
|
(void)thread;
|
|
|
|
|
(void)compaction_style;
|
|
|
|
|
(void)write_mode;
|
|
|
|
|
fprintf(stderr, "Rocksdb Lite doesn't support filldeterministic\n");
|
|
|
|
|
return Status::NotSupported(
|
|
|
|
|
"Rocksdb Lite doesn't support filldeterministic");
|
|
|
|
|
#endif // ROCKSDB_LITE
|
|
|
|
|
}
|
|
|
|
|
|
|
|
|
|
void ReadSequential(ThreadState* thread) {
|
|
|
|
|
if (db_.db != nullptr) {
|
|
|
|
|
ReadSequential(thread, db_.db);
|
|
|
|
|
} else {
|
|
|
|
|
for (const auto& db_with_cfh : multi_dbs_) {
|
|
|
|
|
ReadSequential(thread, db_with_cfh.db);
|
|
|
|
|
}
|
|
|
|
|
}
|
|
|
|
|
}
|
|
|
|
|
|
|
|
|
|
void ReadSequential(ThreadState* thread, DB* db) {
|
|
|
|
|
ReadOptions options = read_options_;
|
|
|
|
|
std::unique_ptr<char[]> ts_guard;
|
|
|
|
|
Slice ts;
|
|
|
|
|
if (user_timestamp_size_ > 0) {
|
|
|
|
|
ts_guard.reset(new char[user_timestamp_size_]);
|
|
|
|
|
ts = mock_app_clock_->GetTimestampForRead(thread->rand, ts_guard.get());
|
|
|
|
|
options.timestamp = &ts;
|
|
|
|
|
}
|
|
|
|
|
|
|
|
|
|
options.adaptive_readahead = FLAGS_adaptive_readahead;
|
|
|
|
|
options.async_io = FLAGS_async_io;
|
|
|
|
|
|
|
|
|
|
Iterator* iter = db->NewIterator(options);
|
|
|
|
|
int64_t i = 0;
|
|
|
|
|
int64_t bytes = 0;
|
|
|
|
|
for (iter->SeekToFirst(); i < reads_ && iter->Valid(); iter->Next()) {
|
|
|
|
|
bytes += iter->key().size() + iter->value().size();
|
|
|
|
|
thread->stats.FinishedOps(nullptr, db, 1, kRead);
|
|
|
|
|
++i;
|
|
|
|
|
|
|
|
|
|
if (thread->shared->read_rate_limiter.get() != nullptr &&
|
|
|
|
|
i % 1024 == 1023) {
|
|
|
|
|
thread->shared->read_rate_limiter->Request(1024, Env::IO_HIGH,
|
|
|
|
|
nullptr /* stats */,
|
|
|
|
|
RateLimiter::OpType::kRead);
|
|
|
|
|
}
|
|
|
|
|
}
|
|
|
|
|
|
|
|
|
|
delete iter;
|
|
|
|
|
thread->stats.AddBytes(bytes);
|
|
|
|
|
if (FLAGS_perf_level > ROCKSDB_NAMESPACE::PerfLevel::kDisable) {
|
|
|
|
|
thread->stats.AddMessage(std::string("PERF_CONTEXT:\n") +
|
|
|
|
|
get_perf_context()->ToString());
|
|
|
|
|
}
|
|
|
|
|
}
|
|
|
|
|
|
|
|
|
|
void ReadToRowCache(ThreadState* thread) {
|
|
|
|
|
int64_t read = 0;
|
|
|
|
|
int64_t found = 0;
|
|
|
|
|
int64_t bytes = 0;
|
|
|
|
|
int64_t key_rand = 0;
|
|
|
|
|
std::unique_ptr<const char[]> key_guard;
|
|
|
|
|
Slice key = AllocateKey(&key_guard);
|
|
|
|
|
PinnableSlice pinnable_val;
|
|
|
|
|
|
|
|
|
|
while (key_rand < FLAGS_num) {
|
|
|
|
|
DBWithColumnFamilies* db_with_cfh = SelectDBWithCfh(thread);
|
|
|
|
|
// We use same key_rand as seed for key and column family so that we can
|
|
|
|
|
// deterministically find the cfh corresponding to a particular key, as it
|
|
|
|
|
// is done in DoWrite method.
|
|
|
|
|
GenerateKeyFromInt(key_rand, FLAGS_num, &key);
|
|
|
|
|
key_rand++;
|
|
|
|
|
read++;
|
|
|
|
|
Status s;
|
|
|
|
|
if (FLAGS_num_column_families > 1) {
|
|
|
|
|
s = db_with_cfh->db->Get(read_options_, db_with_cfh->GetCfh(key_rand),
|
|
|
|
|
key, &pinnable_val);
|
|
|
|
|
} else {
|
|
|
|
|
pinnable_val.Reset();
|
|
|
|
|
s = db_with_cfh->db->Get(read_options_,
|
|
|
|
|
db_with_cfh->db->DefaultColumnFamily(), key,
|
|
|
|
|
&pinnable_val);
|
|
|
|
|
}
|
|
|
|
|
|
|
|
|
|
if (s.ok()) {
|
|
|
|
|
found++;
|
|
|
|
|
bytes += key.size() + pinnable_val.size();
|
|
|
|
|
} else if (!s.IsNotFound()) {
|
|
|
|
|
fprintf(stderr, "Get returned an error: %s\n", s.ToString().c_str());
|
|
|
|
|
abort();
|
|
|
|
|
}
|
|
|
|
|
|
|
|
|
|
if (thread->shared->read_rate_limiter.get() != nullptr &&
|
|
|
|
|
read % 256 == 255) {
|
|
|
|
|
thread->shared->read_rate_limiter->Request(
|
|
|
|
|
256, Env::IO_HIGH, nullptr /* stats */, RateLimiter::OpType::kRead);
|
|
|
|
|
}
|
|
|
|
|
|
|
|
|
|
thread->stats.FinishedOps(db_with_cfh, db_with_cfh->db, 1, kRead);
|
|
|
|
|
}
|
|
|
|
|
|
|
|
|
|
char msg[100];
|
|
|
|
|
snprintf(msg, sizeof(msg), "(%" PRIu64 " of %" PRIu64 " found)\n", found,
|
|
|
|
|
read);
|
|
|
|
|
|
|
|
|
|
thread->stats.AddBytes(bytes);
|
|
|
|
|
thread->stats.AddMessage(msg);
|
|
|
|
|
|
|
|
|
|
if (FLAGS_perf_level > ROCKSDB_NAMESPACE::PerfLevel::kDisable) {
|
|
|
|
|
thread->stats.AddMessage(std::string("PERF_CONTEXT:\n") +
|
|
|
|
|
get_perf_context()->ToString());
|
|
|
|
|
}
|
|
|
|
|
}
|
|
|
|
|
|
|
|
|
|
void ReadReverse(ThreadState* thread) {
|
|
|
|
|
if (db_.db != nullptr) {
|
|
|
|
|
ReadReverse(thread, db_.db);
|
|
|
|
|
} else {
|
|
|
|
|
for (const auto& db_with_cfh : multi_dbs_) {
|
|
|
|
|
ReadReverse(thread, db_with_cfh.db);
|
|
|
|
|
}
|
|
|
|
|
}
|
|
|
|
|
}
|
|
|
|
|
|
|
|
|
|
void ReadReverse(ThreadState* thread, DB* db) {
|
|
|
|
|
Iterator* iter = db->NewIterator(read_options_);
|
|
|
|
|
int64_t i = 0;
|
|
|
|
|
int64_t bytes = 0;
|
|
|
|
|
for (iter->SeekToLast(); i < reads_ && iter->Valid(); iter->Prev()) {
|
|
|
|
|
bytes += iter->key().size() + iter->value().size();
|
|
|
|
|
thread->stats.FinishedOps(nullptr, db, 1, kRead);
|
|
|
|
|
++i;
|
|
|
|
|
if (thread->shared->read_rate_limiter.get() != nullptr &&
|
|
|
|
|
i % 1024 == 1023) {
|
|
|
|
|
thread->shared->read_rate_limiter->Request(1024, Env::IO_HIGH,
|
|
|
|
|
nullptr /* stats */,
|
|
|
|
|
RateLimiter::OpType::kRead);
|
|
|
|
|
}
|
|
|
|
|
}
|
|
|
|
|
delete iter;
|
|
|
|
|
thread->stats.AddBytes(bytes);
|
|
|
|
|
}
|
|
|
|
|
|
|
|
|
|
void ReadRandomFast(ThreadState* thread) {
|
|
|
|
|
int64_t read = 0;
|
|
|
|
|
int64_t found = 0;
|
|
|
|
|
int64_t nonexist = 0;
|
|
|
|
|
ReadOptions options = read_options_;
|
|
|
|
|
std::unique_ptr<const char[]> key_guard;
|
|
|
|
|
Slice key = AllocateKey(&key_guard);
|
|
|
|
|
std::string value;
|
|
|
|
|
Slice ts;
|
|
|
|
|
std::unique_ptr<char[]> ts_guard;
|
|
|
|
|
if (user_timestamp_size_ > 0) {
|
|
|
|
|
ts_guard.reset(new char[user_timestamp_size_]);
|
|
|
|
|
}
|
|
|
|
|
DB* db = SelectDBWithCfh(thread)->db;
|
|
|
|
|
|
|
|
|
|
int64_t pot = 1;
|
|
|
|
|
while (pot < FLAGS_num) {
|
|
|
|
|
pot <<= 1;
|
|
|
|
|
}
|
|
|
|
|
|
|
|
|
|
Duration duration(FLAGS_duration, reads_);
|
|
|
|
|
do {
|
|
|
|
|
for (int i = 0; i < 100; ++i) {
|
|
|
|
|
int64_t key_rand = thread->rand.Next() & (pot - 1);
|
|
|
|
|
GenerateKeyFromInt(key_rand, FLAGS_num, &key);
|
|
|
|
|
++read;
|
|
|
|
|
std::string ts_ret;
|
|
|
|
|
std::string* ts_ptr = nullptr;
|
|
|
|
|
if (user_timestamp_size_ > 0) {
|
|
|
|
|
ts = mock_app_clock_->GetTimestampForRead(thread->rand,
|
|
|
|
|
ts_guard.get());
|
|
|
|
|
options.timestamp = &ts;
|
|
|
|
|
ts_ptr = &ts_ret;
|
|
|
|
|
}
|
|
|
|
|
auto status = db->Get(options, key, &value, ts_ptr);
|
|
|
|
|
if (status.ok()) {
|
|
|
|
|
++found;
|
|
|
|
|
} else if (!status.IsNotFound()) {
|
|
|
|
|
fprintf(stderr, "Get returned an error: %s\n",
|
|
|
|
|
status.ToString().c_str());
|
|
|
|
|
abort();
|
|
|
|
|
}
|
|
|
|
|
if (key_rand >= FLAGS_num) {
|
|
|
|
|
++nonexist;
|
|
|
|
|
}
|
|
|
|
|
}
|
|
|
|
|
if (thread->shared->read_rate_limiter.get() != nullptr) {
|
|
|
|
|
thread->shared->read_rate_limiter->Request(
|
|
|
|
|
100, Env::IO_HIGH, nullptr /* stats */, RateLimiter::OpType::kRead);
|
|
|
|
|
}
|
|
|
|
|
|
|
|
|
|
thread->stats.FinishedOps(nullptr, db, 100, kRead);
|
|
|
|
|
} while (!duration.Done(100));
|
|
|
|
|
|
|
|
|
|
char msg[100];
|
|
|
|
|
snprintf(msg, sizeof(msg), "(%" PRIu64 " of %" PRIu64 " found, "
|
|
|
|
|
"issued %" PRIu64 " non-exist keys)\n",
|
|
|
|
|
found, read, nonexist);
|
|
|
|
|
|
|
|
|
|
thread->stats.AddMessage(msg);
|
|
|
|
|
|
|
|
|
|
if (FLAGS_perf_level > ROCKSDB_NAMESPACE::PerfLevel::kDisable) {
|
|
|
|
|
thread->stats.AddMessage(std::string("PERF_CONTEXT:\n") +
|
|
|
|
|
get_perf_context()->ToString());
|
|
|
|
|
}
|
|
|
|
|
}
|
|
|
|
|
|
|
|
|
|
int64_t GetRandomKey(Random64* rand) {
|
|
|
|
|
uint64_t rand_int = rand->Next();
|
|
|
|
|
int64_t key_rand;
|
|
|
|
|
if (read_random_exp_range_ == 0) {
|
|
|
|
|
key_rand = rand_int % FLAGS_num;
|
|
|
|
|
} else {
|
|
|
|
|
const uint64_t kBigInt = static_cast<uint64_t>(1U) << 62;
|
|
|
|
|
long double order = -static_cast<long double>(rand_int % kBigInt) /
|
|
|
|
|
static_cast<long double>(kBigInt) *
|
|
|
|
|
read_random_exp_range_;
|
|
|
|
|
long double exp_ran = std::exp(order);
|
|
|
|
|
uint64_t rand_num =
|
|
|
|
|
static_cast<int64_t>(exp_ran * static_cast<long double>(FLAGS_num));
|
|
|
|
|
// Map to a different number to avoid locality.
|
|
|
|
|
const uint64_t kBigPrime = 0x5bd1e995;
|
|
|
|
|
// Overflow is like %(2^64). Will have little impact of results.
|
|
|
|
|
key_rand = static_cast<int64_t>((rand_num * kBigPrime) % FLAGS_num);
|
|
|
|
|
}
|
|
|
|
|
return key_rand;
|
|
|
|
|
}
|
|
|
|
|
|
|
|
|
|
void ReadRandom(ThreadState* thread) {
|
|
|
|
|
int64_t read = 0;
|
|
|
|
|
int64_t found = 0;
|
|
|
|
|
int64_t bytes = 0;
|
Introduce a new MultiGet batching implementation (#5011)
Summary:
This PR introduces a new MultiGet() API, with the underlying implementation grouping keys based on SST file and batching lookups in a file. The reason for the new API is twofold - the definition allows callers to allocate storage for status and values on stack instead of std::vector, as well as return values as PinnableSlices in order to avoid copying, and it keeps the original MultiGet() implementation intact while we experiment with batching.
Batching is useful when there is some spatial locality to the keys being queries, as well as larger batch sizes. The main benefits are due to -
1. Fewer function calls, especially to BlockBasedTableReader::MultiGet() and FullFilterBlockReader::KeysMayMatch()
2. Bloom filter cachelines can be prefetched, hiding the cache miss latency
The next step is to optimize the binary searches in the level_storage_info, index blocks and data blocks, since we could reduce the number of key comparisons if the keys are relatively close to each other. The batching optimizations also need to be extended to other formats, such as PlainTable and filter formats. This also needs to be added to db_stress.
Benchmark results from db_bench for various batch size/locality of reference combinations are given below. Locality was simulated by offsetting the keys in a batch by a stride length. Each SST file is about 8.6MB uncompressed and key/value size is 16/100 uncompressed. To focus on the cpu benefit of batching, the runs were single threaded and bound to the same cpu to eliminate interference from other system events. The results show a 10-25% improvement in micros/op from smaller to larger batch sizes (4 - 32).
Batch Sizes
1 | 2 | 4 | 8 | 16 | 32
Random pattern (Stride length 0)
4.158 | 4.109 | 4.026 | 4.05 | 4.1 | 4.074 - Get
4.438 | 4.302 | 4.165 | 4.122 | 4.096 | 4.075 - MultiGet (no batching)
4.461 | 4.256 | 4.277 | 4.11 | 4.182 | 4.14 - MultiGet (w/ batching)
Good locality (Stride length 16)
4.048 | 3.659 | 3.248 | 2.99 | 2.84 | 2.753
4.429 | 3.728 | 3.406 | 3.053 | 2.911 | 2.781
4.452 | 3.45 | 2.833 | 2.451 | 2.233 | 2.135
Good locality (Stride length 256)
4.066 | 3.786 | 3.581 | 3.447 | 3.415 | 3.232
4.406 | 4.005 | 3.644 | 3.49 | 3.381 | 3.268
4.393 | 3.649 | 3.186 | 2.882 | 2.676 | 2.62
Medium locality (Stride length 4096)
4.012 | 3.922 | 3.768 | 3.61 | 3.582 | 3.555
4.364 | 4.057 | 3.791 | 3.65 | 3.57 | 3.465
4.479 | 3.758 | 3.316 | 3.077 | 2.959 | 2.891
dbbench command used (on a DB with 4 levels, 12 million keys)-
TEST_TMPDIR=/dev/shm numactl -C 10 ./db_bench.tmp -use_existing_db=true -benchmarks="readseq,multireadrandom" -write_buffer_size=4194304 -target_file_size_base=4194304 -max_bytes_for_level_base=16777216 -num=12000000 -reads=12000000 -duration=90 -threads=1 -compression_type=none -cache_size=4194304000 -batch_size=32 -disable_auto_compactions=true -bloom_bits=10 -cache_index_and_filter_blocks=true -pin_l0_filter_and_index_blocks_in_cache=true -multiread_batched=true -multiread_stride=4
Pull Request resolved: https://github.com/facebook/rocksdb/pull/5011
Differential Revision: D14348703
Pulled By: anand1976
fbshipit-source-id: 774406dab3776d979c809522a67bedac6c17f84b
5 years ago
|
|
|
int num_keys = 0;
|
|
|
|
|
int64_t key_rand = 0;
|
|
|
|
|
ReadOptions options = read_options_;
|
|
|
|
|
std::unique_ptr<const char[]> key_guard;
|
|
|
|
|
Slice key = AllocateKey(&key_guard);
|
|
|
|
|
PinnableSlice pinnable_val;
|
|
|
|
|
std::vector<PinnableSlice> pinnable_vals;
|
|
|
|
|
if (read_operands_) {
|
|
|
|
|
// Start off with a small-ish value that'll be increased later if
|
|
|
|
|
// `GetMergeOperands()` tells us it is not large enough.
|
|
|
|
|
pinnable_vals.resize(8);
|
|
|
|
|
}
|
|
|
|
|
std::unique_ptr<char[]> ts_guard;
|
|
|
|
|
Slice ts;
|
|
|
|
|
if (user_timestamp_size_ > 0) {
|
|
|
|
|
ts_guard.reset(new char[user_timestamp_size_]);
|
|
|
|
|
}
|
|
|
|
|
|
|
|
|
|
Duration duration(FLAGS_duration, reads_);
|
|
|
|
|
while (!duration.Done(1)) {
|
|
|
|
|
DBWithColumnFamilies* db_with_cfh = SelectDBWithCfh(thread);
|
|
|
|
|
// We use same key_rand as seed for key and column family so that we can
|
|
|
|
|
// deterministically find the cfh corresponding to a particular key, as it
|
|
|
|
|
// is done in DoWrite method.
|
Introduce a new MultiGet batching implementation (#5011)
Summary:
This PR introduces a new MultiGet() API, with the underlying implementation grouping keys based on SST file and batching lookups in a file. The reason for the new API is twofold - the definition allows callers to allocate storage for status and values on stack instead of std::vector, as well as return values as PinnableSlices in order to avoid copying, and it keeps the original MultiGet() implementation intact while we experiment with batching.
Batching is useful when there is some spatial locality to the keys being queries, as well as larger batch sizes. The main benefits are due to -
1. Fewer function calls, especially to BlockBasedTableReader::MultiGet() and FullFilterBlockReader::KeysMayMatch()
2. Bloom filter cachelines can be prefetched, hiding the cache miss latency
The next step is to optimize the binary searches in the level_storage_info, index blocks and data blocks, since we could reduce the number of key comparisons if the keys are relatively close to each other. The batching optimizations also need to be extended to other formats, such as PlainTable and filter formats. This also needs to be added to db_stress.
Benchmark results from db_bench for various batch size/locality of reference combinations are given below. Locality was simulated by offsetting the keys in a batch by a stride length. Each SST file is about 8.6MB uncompressed and key/value size is 16/100 uncompressed. To focus on the cpu benefit of batching, the runs were single threaded and bound to the same cpu to eliminate interference from other system events. The results show a 10-25% improvement in micros/op from smaller to larger batch sizes (4 - 32).
Batch Sizes
1 | 2 | 4 | 8 | 16 | 32
Random pattern (Stride length 0)
4.158 | 4.109 | 4.026 | 4.05 | 4.1 | 4.074 - Get
4.438 | 4.302 | 4.165 | 4.122 | 4.096 | 4.075 - MultiGet (no batching)
4.461 | 4.256 | 4.277 | 4.11 | 4.182 | 4.14 - MultiGet (w/ batching)
Good locality (Stride length 16)
4.048 | 3.659 | 3.248 | 2.99 | 2.84 | 2.753
4.429 | 3.728 | 3.406 | 3.053 | 2.911 | 2.781
4.452 | 3.45 | 2.833 | 2.451 | 2.233 | 2.135
Good locality (Stride length 256)
4.066 | 3.786 | 3.581 | 3.447 | 3.415 | 3.232
4.406 | 4.005 | 3.644 | 3.49 | 3.381 | 3.268
4.393 | 3.649 | 3.186 | 2.882 | 2.676 | 2.62
Medium locality (Stride length 4096)
4.012 | 3.922 | 3.768 | 3.61 | 3.582 | 3.555
4.364 | 4.057 | 3.791 | 3.65 | 3.57 | 3.465
4.479 | 3.758 | 3.316 | 3.077 | 2.959 | 2.891
dbbench command used (on a DB with 4 levels, 12 million keys)-
TEST_TMPDIR=/dev/shm numactl -C 10 ./db_bench.tmp -use_existing_db=true -benchmarks="readseq,multireadrandom" -write_buffer_size=4194304 -target_file_size_base=4194304 -max_bytes_for_level_base=16777216 -num=12000000 -reads=12000000 -duration=90 -threads=1 -compression_type=none -cache_size=4194304000 -batch_size=32 -disable_auto_compactions=true -bloom_bits=10 -cache_index_and_filter_blocks=true -pin_l0_filter_and_index_blocks_in_cache=true -multiread_batched=true -multiread_stride=4
Pull Request resolved: https://github.com/facebook/rocksdb/pull/5011
Differential Revision: D14348703
Pulled By: anand1976
fbshipit-source-id: 774406dab3776d979c809522a67bedac6c17f84b
5 years ago
|
|
|
if (entries_per_batch_ > 1 && FLAGS_multiread_stride) {
|
|
|
|
|
if (++num_keys == entries_per_batch_) {
|
|
|
|
|
num_keys = 0;
|
|
|
|
|
key_rand = GetRandomKey(&thread->rand);
|
|
|
|
|
if ((key_rand + (entries_per_batch_ - 1) * FLAGS_multiread_stride) >=
|
|
|
|
|
FLAGS_num) {
|
|
|
|
|
key_rand = FLAGS_num - entries_per_batch_ * FLAGS_multiread_stride;
|
|
|
|
|
}
|
|
|
|
|
} else {
|
|
|
|
|
key_rand += FLAGS_multiread_stride;
|
|
|
|
|
}
|
|
|
|
|
} else {
|
|
|
|
|
key_rand = GetRandomKey(&thread->rand);
|
|
|
|
|
}
|
|
|
|
|
GenerateKeyFromInt(key_rand, FLAGS_num, &key);
|
|
|
|
|
read++;
|
|
|
|
|
std::string ts_ret;
|
|
|
|
|
std::string* ts_ptr = nullptr;
|
|
|
|
|
if (user_timestamp_size_ > 0) {
|
|
|
|
|
ts = mock_app_clock_->GetTimestampForRead(thread->rand, ts_guard.get());
|
|
|
|
|
options.timestamp = &ts;
|
|
|
|
|
ts_ptr = &ts_ret;
|
|
|
|
|
}
|
|
|
|
|
Status s;
|
|
|
|
|
pinnable_val.Reset();
|
|
|
|
|
for (size_t i = 0; i < pinnable_vals.size(); ++i) {
|
|
|
|
|
pinnable_vals[i].Reset();
|
|
|
|
|
}
|
|
|
|
|
ColumnFamilyHandle* cfh;
|
|
|
|
|
if (FLAGS_num_column_families > 1) {
|
|
|
|
|
cfh = db_with_cfh->GetCfh(key_rand);
|
|
|
|
|
} else {
|
|
|
|
|
cfh = db_with_cfh->db->DefaultColumnFamily();
|
|
|
|
|
}
|
|
|
|
|
if (read_operands_) {
|
|
|
|
|
GetMergeOperandsOptions get_merge_operands_options;
|
|
|
|
|
get_merge_operands_options.expected_max_number_of_operands =
|
|
|
|
|
static_cast<int>(pinnable_vals.size());
|
|
|
|
|
int number_of_operands;
|
|
|
|
|
s = db_with_cfh->db->GetMergeOperands(
|
|
|
|
|
options, cfh, key, pinnable_vals.data(),
|
|
|
|
|
&get_merge_operands_options, &number_of_operands);
|
|
|
|
|
if (s.IsIncomplete()) {
|
|
|
|
|
// Should only happen a few times when we encounter a key that had
|
|
|
|
|
// more merge operands than any key seen so far. Production use case
|
|
|
|
|
// would typically retry in such event to get all the operands so do
|
|
|
|
|
// that here.
|
|
|
|
|
pinnable_vals.resize(number_of_operands);
|
|
|
|
|
get_merge_operands_options.expected_max_number_of_operands =
|
|
|
|
|
static_cast<int>(pinnable_vals.size());
|
|
|
|
|
s = db_with_cfh->db->GetMergeOperands(
|
|
|
|
|
options, cfh, key, pinnable_vals.data(),
|
|
|
|
|
&get_merge_operands_options, &number_of_operands);
|
|
|
|
|
}
|
|
|
|
|
} else {
|
|
|
|
|
s = db_with_cfh->db->Get(options, cfh, key, &pinnable_val, ts_ptr);
|
|
|
|
|
}
|
|
|
|
|
|
|
|
|
|
if (s.ok()) {
|
|
|
|
|
found++;
|
|
|
|
|
bytes += key.size() + pinnable_val.size() + user_timestamp_size_;
|
|
|
|
|
for (size_t i = 0; i < pinnable_vals.size(); ++i) {
|
|
|
|
|
bytes += pinnable_vals[i].size();
|
|
|
|
|
}
|
|
|
|
|
} else if (!s.IsNotFound()) {
|
|
|
|
|
fprintf(stderr, "Get returned an error: %s\n", s.ToString().c_str());
|
|
|
|
|
abort();
|
|
|
|
|
}
|
|
|
|
|
|
|
|
|
|
if (thread->shared->read_rate_limiter.get() != nullptr &&
|
|
|
|
|
read % 256 == 255) {
|
|
|
|
|
thread->shared->read_rate_limiter->Request(
|
|
|
|
|
256, Env::IO_HIGH, nullptr /* stats */, RateLimiter::OpType::kRead);
|
|
|
|
|
}
|
|
|
|
|
|
|
|
|
|
thread->stats.FinishedOps(db_with_cfh, db_with_cfh->db, 1, kRead);
|
|
|
|
|
}
|
|
|
|
|
|
|
|
|
|
char msg[100];
|
|
|
|
|
snprintf(msg, sizeof(msg), "(%" PRIu64 " of %" PRIu64 " found)\n",
|
|
|
|
|
found, read);
|
|
|
|
|
|
|
|
|
|
thread->stats.AddBytes(bytes);
|
|
|
|
|
thread->stats.AddMessage(msg);
|
|
|
|
|
|
|
|
|
|
if (FLAGS_perf_level > ROCKSDB_NAMESPACE::PerfLevel::kDisable) {
|
|
|
|
|
thread->stats.AddMessage(std::string("PERF_CONTEXT:\n") +
|
|
|
|
|
get_perf_context()->ToString());
|
|
|
|
|
}
|
|
|
|
|
}
|
|
|
|
|
|
|
|
|
|
// Calls MultiGet over a list of keys from a random distribution.
|
|
|
|
|
// Returns the total number of keys found.
|
|
|
|
|
void MultiReadRandom(ThreadState* thread) {
|
|
|
|
|
int64_t read = 0;
|
|
|
|
|
int64_t bytes = 0;
|
|
|
|
|
int64_t num_multireads = 0;
|
|
|
|
|
int64_t found = 0;
|
|
|
|
|
ReadOptions options = read_options_;
|
|
|
|
|
std::vector<Slice> keys;
|
|
|
|
|
std::vector<std::unique_ptr<const char[]> > key_guards;
|
|
|
|
|
std::vector<std::string> values(entries_per_batch_);
|
Introduce a new MultiGet batching implementation (#5011)
Summary:
This PR introduces a new MultiGet() API, with the underlying implementation grouping keys based on SST file and batching lookups in a file. The reason for the new API is twofold - the definition allows callers to allocate storage for status and values on stack instead of std::vector, as well as return values as PinnableSlices in order to avoid copying, and it keeps the original MultiGet() implementation intact while we experiment with batching.
Batching is useful when there is some spatial locality to the keys being queries, as well as larger batch sizes. The main benefits are due to -
1. Fewer function calls, especially to BlockBasedTableReader::MultiGet() and FullFilterBlockReader::KeysMayMatch()
2. Bloom filter cachelines can be prefetched, hiding the cache miss latency
The next step is to optimize the binary searches in the level_storage_info, index blocks and data blocks, since we could reduce the number of key comparisons if the keys are relatively close to each other. The batching optimizations also need to be extended to other formats, such as PlainTable and filter formats. This also needs to be added to db_stress.
Benchmark results from db_bench for various batch size/locality of reference combinations are given below. Locality was simulated by offsetting the keys in a batch by a stride length. Each SST file is about 8.6MB uncompressed and key/value size is 16/100 uncompressed. To focus on the cpu benefit of batching, the runs were single threaded and bound to the same cpu to eliminate interference from other system events. The results show a 10-25% improvement in micros/op from smaller to larger batch sizes (4 - 32).
Batch Sizes
1 | 2 | 4 | 8 | 16 | 32
Random pattern (Stride length 0)
4.158 | 4.109 | 4.026 | 4.05 | 4.1 | 4.074 - Get
4.438 | 4.302 | 4.165 | 4.122 | 4.096 | 4.075 - MultiGet (no batching)
4.461 | 4.256 | 4.277 | 4.11 | 4.182 | 4.14 - MultiGet (w/ batching)
Good locality (Stride length 16)
4.048 | 3.659 | 3.248 | 2.99 | 2.84 | 2.753
4.429 | 3.728 | 3.406 | 3.053 | 2.911 | 2.781
4.452 | 3.45 | 2.833 | 2.451 | 2.233 | 2.135
Good locality (Stride length 256)
4.066 | 3.786 | 3.581 | 3.447 | 3.415 | 3.232
4.406 | 4.005 | 3.644 | 3.49 | 3.381 | 3.268
4.393 | 3.649 | 3.186 | 2.882 | 2.676 | 2.62
Medium locality (Stride length 4096)
4.012 | 3.922 | 3.768 | 3.61 | 3.582 | 3.555
4.364 | 4.057 | 3.791 | 3.65 | 3.57 | 3.465
4.479 | 3.758 | 3.316 | 3.077 | 2.959 | 2.891
dbbench command used (on a DB with 4 levels, 12 million keys)-
TEST_TMPDIR=/dev/shm numactl -C 10 ./db_bench.tmp -use_existing_db=true -benchmarks="readseq,multireadrandom" -write_buffer_size=4194304 -target_file_size_base=4194304 -max_bytes_for_level_base=16777216 -num=12000000 -reads=12000000 -duration=90 -threads=1 -compression_type=none -cache_size=4194304000 -batch_size=32 -disable_auto_compactions=true -bloom_bits=10 -cache_index_and_filter_blocks=true -pin_l0_filter_and_index_blocks_in_cache=true -multiread_batched=true -multiread_stride=4
Pull Request resolved: https://github.com/facebook/rocksdb/pull/5011
Differential Revision: D14348703
Pulled By: anand1976
fbshipit-source-id: 774406dab3776d979c809522a67bedac6c17f84b
5 years ago
|
|
|
PinnableSlice* pin_values = new PinnableSlice[entries_per_batch_];
|
|
|
|
|
std::unique_ptr<PinnableSlice[]> pin_values_guard(pin_values);
|
Introduce a new MultiGet batching implementation (#5011)
Summary:
This PR introduces a new MultiGet() API, with the underlying implementation grouping keys based on SST file and batching lookups in a file. The reason for the new API is twofold - the definition allows callers to allocate storage for status and values on stack instead of std::vector, as well as return values as PinnableSlices in order to avoid copying, and it keeps the original MultiGet() implementation intact while we experiment with batching.
Batching is useful when there is some spatial locality to the keys being queries, as well as larger batch sizes. The main benefits are due to -
1. Fewer function calls, especially to BlockBasedTableReader::MultiGet() and FullFilterBlockReader::KeysMayMatch()
2. Bloom filter cachelines can be prefetched, hiding the cache miss latency
The next step is to optimize the binary searches in the level_storage_info, index blocks and data blocks, since we could reduce the number of key comparisons if the keys are relatively close to each other. The batching optimizations also need to be extended to other formats, such as PlainTable and filter formats. This also needs to be added to db_stress.
Benchmark results from db_bench for various batch size/locality of reference combinations are given below. Locality was simulated by offsetting the keys in a batch by a stride length. Each SST file is about 8.6MB uncompressed and key/value size is 16/100 uncompressed. To focus on the cpu benefit of batching, the runs were single threaded and bound to the same cpu to eliminate interference from other system events. The results show a 10-25% improvement in micros/op from smaller to larger batch sizes (4 - 32).
Batch Sizes
1 | 2 | 4 | 8 | 16 | 32
Random pattern (Stride length 0)
4.158 | 4.109 | 4.026 | 4.05 | 4.1 | 4.074 - Get
4.438 | 4.302 | 4.165 | 4.122 | 4.096 | 4.075 - MultiGet (no batching)
4.461 | 4.256 | 4.277 | 4.11 | 4.182 | 4.14 - MultiGet (w/ batching)
Good locality (Stride length 16)
4.048 | 3.659 | 3.248 | 2.99 | 2.84 | 2.753
4.429 | 3.728 | 3.406 | 3.053 | 2.911 | 2.781
4.452 | 3.45 | 2.833 | 2.451 | 2.233 | 2.135
Good locality (Stride length 256)
4.066 | 3.786 | 3.581 | 3.447 | 3.415 | 3.232
4.406 | 4.005 | 3.644 | 3.49 | 3.381 | 3.268
4.393 | 3.649 | 3.186 | 2.882 | 2.676 | 2.62
Medium locality (Stride length 4096)
4.012 | 3.922 | 3.768 | 3.61 | 3.582 | 3.555
4.364 | 4.057 | 3.791 | 3.65 | 3.57 | 3.465
4.479 | 3.758 | 3.316 | 3.077 | 2.959 | 2.891
dbbench command used (on a DB with 4 levels, 12 million keys)-
TEST_TMPDIR=/dev/shm numactl -C 10 ./db_bench.tmp -use_existing_db=true -benchmarks="readseq,multireadrandom" -write_buffer_size=4194304 -target_file_size_base=4194304 -max_bytes_for_level_base=16777216 -num=12000000 -reads=12000000 -duration=90 -threads=1 -compression_type=none -cache_size=4194304000 -batch_size=32 -disable_auto_compactions=true -bloom_bits=10 -cache_index_and_filter_blocks=true -pin_l0_filter_and_index_blocks_in_cache=true -multiread_batched=true -multiread_stride=4
Pull Request resolved: https://github.com/facebook/rocksdb/pull/5011
Differential Revision: D14348703
Pulled By: anand1976
fbshipit-source-id: 774406dab3776d979c809522a67bedac6c17f84b
5 years ago
|
|
|
std::vector<Status> stat_list(entries_per_batch_);
|
|
|
|
|
while (static_cast<int64_t>(keys.size()) < entries_per_batch_) {
|
|
|
|
|
key_guards.push_back(std::unique_ptr<const char[]>());
|
|
|
|
|
keys.push_back(AllocateKey(&key_guards.back()));
|
|
|
|
|
}
|
|
|
|
|
|
|
|
|
|
std::unique_ptr<char[]> ts_guard;
|
|
|
|
|
if (user_timestamp_size_ > 0) {
|
|
|
|
|
ts_guard.reset(new char[user_timestamp_size_]);
|
|
|
|
|
}
|
|
|
|
|
|
|
|
|
|
Duration duration(FLAGS_duration, reads_);
|
|
|
|
|
while (!duration.Done(entries_per_batch_)) {
|
|
|
|
|
DB* db = SelectDB(thread);
|
Introduce a new MultiGet batching implementation (#5011)
Summary:
This PR introduces a new MultiGet() API, with the underlying implementation grouping keys based on SST file and batching lookups in a file. The reason for the new API is twofold - the definition allows callers to allocate storage for status and values on stack instead of std::vector, as well as return values as PinnableSlices in order to avoid copying, and it keeps the original MultiGet() implementation intact while we experiment with batching.
Batching is useful when there is some spatial locality to the keys being queries, as well as larger batch sizes. The main benefits are due to -
1. Fewer function calls, especially to BlockBasedTableReader::MultiGet() and FullFilterBlockReader::KeysMayMatch()
2. Bloom filter cachelines can be prefetched, hiding the cache miss latency
The next step is to optimize the binary searches in the level_storage_info, index blocks and data blocks, since we could reduce the number of key comparisons if the keys are relatively close to each other. The batching optimizations also need to be extended to other formats, such as PlainTable and filter formats. This also needs to be added to db_stress.
Benchmark results from db_bench for various batch size/locality of reference combinations are given below. Locality was simulated by offsetting the keys in a batch by a stride length. Each SST file is about 8.6MB uncompressed and key/value size is 16/100 uncompressed. To focus on the cpu benefit of batching, the runs were single threaded and bound to the same cpu to eliminate interference from other system events. The results show a 10-25% improvement in micros/op from smaller to larger batch sizes (4 - 32).
Batch Sizes
1 | 2 | 4 | 8 | 16 | 32
Random pattern (Stride length 0)
4.158 | 4.109 | 4.026 | 4.05 | 4.1 | 4.074 - Get
4.438 | 4.302 | 4.165 | 4.122 | 4.096 | 4.075 - MultiGet (no batching)
4.461 | 4.256 | 4.277 | 4.11 | 4.182 | 4.14 - MultiGet (w/ batching)
Good locality (Stride length 16)
4.048 | 3.659 | 3.248 | 2.99 | 2.84 | 2.753
4.429 | 3.728 | 3.406 | 3.053 | 2.911 | 2.781
4.452 | 3.45 | 2.833 | 2.451 | 2.233 | 2.135
Good locality (Stride length 256)
4.066 | 3.786 | 3.581 | 3.447 | 3.415 | 3.232
4.406 | 4.005 | 3.644 | 3.49 | 3.381 | 3.268
4.393 | 3.649 | 3.186 | 2.882 | 2.676 | 2.62
Medium locality (Stride length 4096)
4.012 | 3.922 | 3.768 | 3.61 | 3.582 | 3.555
4.364 | 4.057 | 3.791 | 3.65 | 3.57 | 3.465
4.479 | 3.758 | 3.316 | 3.077 | 2.959 | 2.891
dbbench command used (on a DB with 4 levels, 12 million keys)-
TEST_TMPDIR=/dev/shm numactl -C 10 ./db_bench.tmp -use_existing_db=true -benchmarks="readseq,multireadrandom" -write_buffer_size=4194304 -target_file_size_base=4194304 -max_bytes_for_level_base=16777216 -num=12000000 -reads=12000000 -duration=90 -threads=1 -compression_type=none -cache_size=4194304000 -batch_size=32 -disable_auto_compactions=true -bloom_bits=10 -cache_index_and_filter_blocks=true -pin_l0_filter_and_index_blocks_in_cache=true -multiread_batched=true -multiread_stride=4
Pull Request resolved: https://github.com/facebook/rocksdb/pull/5011
Differential Revision: D14348703
Pulled By: anand1976
fbshipit-source-id: 774406dab3776d979c809522a67bedac6c17f84b
5 years ago
|
|
|
if (FLAGS_multiread_stride) {
|
|
|
|
|
int64_t key = GetRandomKey(&thread->rand);
|
|
|
|
|
if ((key + (entries_per_batch_ - 1) * FLAGS_multiread_stride) >=
|
|
|
|
|
static_cast<int64_t>(FLAGS_num)) {
|
Introduce a new MultiGet batching implementation (#5011)
Summary:
This PR introduces a new MultiGet() API, with the underlying implementation grouping keys based on SST file and batching lookups in a file. The reason for the new API is twofold - the definition allows callers to allocate storage for status and values on stack instead of std::vector, as well as return values as PinnableSlices in order to avoid copying, and it keeps the original MultiGet() implementation intact while we experiment with batching.
Batching is useful when there is some spatial locality to the keys being queries, as well as larger batch sizes. The main benefits are due to -
1. Fewer function calls, especially to BlockBasedTableReader::MultiGet() and FullFilterBlockReader::KeysMayMatch()
2. Bloom filter cachelines can be prefetched, hiding the cache miss latency
The next step is to optimize the binary searches in the level_storage_info, index blocks and data blocks, since we could reduce the number of key comparisons if the keys are relatively close to each other. The batching optimizations also need to be extended to other formats, such as PlainTable and filter formats. This also needs to be added to db_stress.
Benchmark results from db_bench for various batch size/locality of reference combinations are given below. Locality was simulated by offsetting the keys in a batch by a stride length. Each SST file is about 8.6MB uncompressed and key/value size is 16/100 uncompressed. To focus on the cpu benefit of batching, the runs were single threaded and bound to the same cpu to eliminate interference from other system events. The results show a 10-25% improvement in micros/op from smaller to larger batch sizes (4 - 32).
Batch Sizes
1 | 2 | 4 | 8 | 16 | 32
Random pattern (Stride length 0)
4.158 | 4.109 | 4.026 | 4.05 | 4.1 | 4.074 - Get
4.438 | 4.302 | 4.165 | 4.122 | 4.096 | 4.075 - MultiGet (no batching)
4.461 | 4.256 | 4.277 | 4.11 | 4.182 | 4.14 - MultiGet (w/ batching)
Good locality (Stride length 16)
4.048 | 3.659 | 3.248 | 2.99 | 2.84 | 2.753
4.429 | 3.728 | 3.406 | 3.053 | 2.911 | 2.781
4.452 | 3.45 | 2.833 | 2.451 | 2.233 | 2.135
Good locality (Stride length 256)
4.066 | 3.786 | 3.581 | 3.447 | 3.415 | 3.232
4.406 | 4.005 | 3.644 | 3.49 | 3.381 | 3.268
4.393 | 3.649 | 3.186 | 2.882 | 2.676 | 2.62
Medium locality (Stride length 4096)
4.012 | 3.922 | 3.768 | 3.61 | 3.582 | 3.555
4.364 | 4.057 | 3.791 | 3.65 | 3.57 | 3.465
4.479 | 3.758 | 3.316 | 3.077 | 2.959 | 2.891
dbbench command used (on a DB with 4 levels, 12 million keys)-
TEST_TMPDIR=/dev/shm numactl -C 10 ./db_bench.tmp -use_existing_db=true -benchmarks="readseq,multireadrandom" -write_buffer_size=4194304 -target_file_size_base=4194304 -max_bytes_for_level_base=16777216 -num=12000000 -reads=12000000 -duration=90 -threads=1 -compression_type=none -cache_size=4194304000 -batch_size=32 -disable_auto_compactions=true -bloom_bits=10 -cache_index_and_filter_blocks=true -pin_l0_filter_and_index_blocks_in_cache=true -multiread_batched=true -multiread_stride=4
Pull Request resolved: https://github.com/facebook/rocksdb/pull/5011
Differential Revision: D14348703
Pulled By: anand1976
fbshipit-source-id: 774406dab3776d979c809522a67bedac6c17f84b
5 years ago
|
|
|
key = FLAGS_num - entries_per_batch_ * FLAGS_multiread_stride;
|
|
|
|
|
}
|
|
|
|
|
for (int64_t i = 0; i < entries_per_batch_; ++i) {
|
|
|
|
|
GenerateKeyFromInt(key, FLAGS_num, &keys[i]);
|
|
|
|
|
key += FLAGS_multiread_stride;
|
|
|
|
|
}
|
|
|
|
|
} else {
|
|
|
|
|
for (int64_t i = 0; i < entries_per_batch_; ++i) {
|
|
|
|
|
GenerateKeyFromInt(GetRandomKey(&thread->rand), FLAGS_num, &keys[i]);
|
|
|
|
|
}
|
|
|
|
|
}
|
|
|
|
|
Slice ts;
|
|
|
|
|
if (user_timestamp_size_ > 0) {
|
|
|
|
|
ts = mock_app_clock_->GetTimestampForRead(thread->rand, ts_guard.get());
|
|
|
|
|
options.timestamp = &ts;
|
|
|
|
|
}
|
Introduce a new MultiGet batching implementation (#5011)
Summary:
This PR introduces a new MultiGet() API, with the underlying implementation grouping keys based on SST file and batching lookups in a file. The reason for the new API is twofold - the definition allows callers to allocate storage for status and values on stack instead of std::vector, as well as return values as PinnableSlices in order to avoid copying, and it keeps the original MultiGet() implementation intact while we experiment with batching.
Batching is useful when there is some spatial locality to the keys being queries, as well as larger batch sizes. The main benefits are due to -
1. Fewer function calls, especially to BlockBasedTableReader::MultiGet() and FullFilterBlockReader::KeysMayMatch()
2. Bloom filter cachelines can be prefetched, hiding the cache miss latency
The next step is to optimize the binary searches in the level_storage_info, index blocks and data blocks, since we could reduce the number of key comparisons if the keys are relatively close to each other. The batching optimizations also need to be extended to other formats, such as PlainTable and filter formats. This also needs to be added to db_stress.
Benchmark results from db_bench for various batch size/locality of reference combinations are given below. Locality was simulated by offsetting the keys in a batch by a stride length. Each SST file is about 8.6MB uncompressed and key/value size is 16/100 uncompressed. To focus on the cpu benefit of batching, the runs were single threaded and bound to the same cpu to eliminate interference from other system events. The results show a 10-25% improvement in micros/op from smaller to larger batch sizes (4 - 32).
Batch Sizes
1 | 2 | 4 | 8 | 16 | 32
Random pattern (Stride length 0)
4.158 | 4.109 | 4.026 | 4.05 | 4.1 | 4.074 - Get
4.438 | 4.302 | 4.165 | 4.122 | 4.096 | 4.075 - MultiGet (no batching)
4.461 | 4.256 | 4.277 | 4.11 | 4.182 | 4.14 - MultiGet (w/ batching)
Good locality (Stride length 16)
4.048 | 3.659 | 3.248 | 2.99 | 2.84 | 2.753
4.429 | 3.728 | 3.406 | 3.053 | 2.911 | 2.781
4.452 | 3.45 | 2.833 | 2.451 | 2.233 | 2.135
Good locality (Stride length 256)
4.066 | 3.786 | 3.581 | 3.447 | 3.415 | 3.232
4.406 | 4.005 | 3.644 | 3.49 | 3.381 | 3.268
4.393 | 3.649 | 3.186 | 2.882 | 2.676 | 2.62
Medium locality (Stride length 4096)
4.012 | 3.922 | 3.768 | 3.61 | 3.582 | 3.555
4.364 | 4.057 | 3.791 | 3.65 | 3.57 | 3.465
4.479 | 3.758 | 3.316 | 3.077 | 2.959 | 2.891
dbbench command used (on a DB with 4 levels, 12 million keys)-
TEST_TMPDIR=/dev/shm numactl -C 10 ./db_bench.tmp -use_existing_db=true -benchmarks="readseq,multireadrandom" -write_buffer_size=4194304 -target_file_size_base=4194304 -max_bytes_for_level_base=16777216 -num=12000000 -reads=12000000 -duration=90 -threads=1 -compression_type=none -cache_size=4194304000 -batch_size=32 -disable_auto_compactions=true -bloom_bits=10 -cache_index_and_filter_blocks=true -pin_l0_filter_and_index_blocks_in_cache=true -multiread_batched=true -multiread_stride=4
Pull Request resolved: https://github.com/facebook/rocksdb/pull/5011
Differential Revision: D14348703
Pulled By: anand1976
fbshipit-source-id: 774406dab3776d979c809522a67bedac6c17f84b
5 years ago
|
|
|
if (!FLAGS_multiread_batched) {
|
|
|
|
|
std::vector<Status> statuses = db->MultiGet(options, keys, &values);
|
|
|
|
|
assert(static_cast<int64_t>(statuses.size()) == entries_per_batch_);
|
|
|
|
|
|
|
|
|
|
read += entries_per_batch_;
|
|
|
|
|
num_multireads++;
|
|
|
|
|
for (int64_t i = 0; i < entries_per_batch_; ++i) {
|
|
|
|
|
if (statuses[i].ok()) {
|
|
|
|
|
bytes += keys[i].size() + values[i].size() + user_timestamp_size_;
|
Introduce a new MultiGet batching implementation (#5011)
Summary:
This PR introduces a new MultiGet() API, with the underlying implementation grouping keys based on SST file and batching lookups in a file. The reason for the new API is twofold - the definition allows callers to allocate storage for status and values on stack instead of std::vector, as well as return values as PinnableSlices in order to avoid copying, and it keeps the original MultiGet() implementation intact while we experiment with batching.
Batching is useful when there is some spatial locality to the keys being queries, as well as larger batch sizes. The main benefits are due to -
1. Fewer function calls, especially to BlockBasedTableReader::MultiGet() and FullFilterBlockReader::KeysMayMatch()
2. Bloom filter cachelines can be prefetched, hiding the cache miss latency
The next step is to optimize the binary searches in the level_storage_info, index blocks and data blocks, since we could reduce the number of key comparisons if the keys are relatively close to each other. The batching optimizations also need to be extended to other formats, such as PlainTable and filter formats. This also needs to be added to db_stress.
Benchmark results from db_bench for various batch size/locality of reference combinations are given below. Locality was simulated by offsetting the keys in a batch by a stride length. Each SST file is about 8.6MB uncompressed and key/value size is 16/100 uncompressed. To focus on the cpu benefit of batching, the runs were single threaded and bound to the same cpu to eliminate interference from other system events. The results show a 10-25% improvement in micros/op from smaller to larger batch sizes (4 - 32).
Batch Sizes
1 | 2 | 4 | 8 | 16 | 32
Random pattern (Stride length 0)
4.158 | 4.109 | 4.026 | 4.05 | 4.1 | 4.074 - Get
4.438 | 4.302 | 4.165 | 4.122 | 4.096 | 4.075 - MultiGet (no batching)
4.461 | 4.256 | 4.277 | 4.11 | 4.182 | 4.14 - MultiGet (w/ batching)
Good locality (Stride length 16)
4.048 | 3.659 | 3.248 | 2.99 | 2.84 | 2.753
4.429 | 3.728 | 3.406 | 3.053 | 2.911 | 2.781
4.452 | 3.45 | 2.833 | 2.451 | 2.233 | 2.135
Good locality (Stride length 256)
4.066 | 3.786 | 3.581 | 3.447 | 3.415 | 3.232
4.406 | 4.005 | 3.644 | 3.49 | 3.381 | 3.268
4.393 | 3.649 | 3.186 | 2.882 | 2.676 | 2.62
Medium locality (Stride length 4096)
4.012 | 3.922 | 3.768 | 3.61 | 3.582 | 3.555
4.364 | 4.057 | 3.791 | 3.65 | 3.57 | 3.465
4.479 | 3.758 | 3.316 | 3.077 | 2.959 | 2.891
dbbench command used (on a DB with 4 levels, 12 million keys)-
TEST_TMPDIR=/dev/shm numactl -C 10 ./db_bench.tmp -use_existing_db=true -benchmarks="readseq,multireadrandom" -write_buffer_size=4194304 -target_file_size_base=4194304 -max_bytes_for_level_base=16777216 -num=12000000 -reads=12000000 -duration=90 -threads=1 -compression_type=none -cache_size=4194304000 -batch_size=32 -disable_auto_compactions=true -bloom_bits=10 -cache_index_and_filter_blocks=true -pin_l0_filter_and_index_blocks_in_cache=true -multiread_batched=true -multiread_stride=4
Pull Request resolved: https://github.com/facebook/rocksdb/pull/5011
Differential Revision: D14348703
Pulled By: anand1976
fbshipit-source-id: 774406dab3776d979c809522a67bedac6c17f84b
5 years ago
|
|
|
++found;
|
|
|
|
|
} else if (!statuses[i].IsNotFound()) {
|
|
|
|
|
fprintf(stderr, "MultiGet returned an error: %s\n",
|
|
|
|
|
statuses[i].ToString().c_str());
|
|
|
|
|
abort();
|
|
|
|
|
}
|
|
|
|
|
}
|
|
|
|
|
} else {
|
|
|
|
|
db->MultiGet(options, db->DefaultColumnFamily(), keys.size(),
|
|
|
|
|
keys.data(), pin_values, stat_list.data());
|
|
|
|
|
|
|
|
|
|
read += entries_per_batch_;
|
|
|
|
|
num_multireads++;
|
|
|
|
|
for (int64_t i = 0; i < entries_per_batch_; ++i) {
|
|
|
|
|
if (stat_list[i].ok()) {
|
|
|
|
|
bytes +=
|
|
|
|
|
keys[i].size() + pin_values[i].size() + user_timestamp_size_;
|
Introduce a new MultiGet batching implementation (#5011)
Summary:
This PR introduces a new MultiGet() API, with the underlying implementation grouping keys based on SST file and batching lookups in a file. The reason for the new API is twofold - the definition allows callers to allocate storage for status and values on stack instead of std::vector, as well as return values as PinnableSlices in order to avoid copying, and it keeps the original MultiGet() implementation intact while we experiment with batching.
Batching is useful when there is some spatial locality to the keys being queries, as well as larger batch sizes. The main benefits are due to -
1. Fewer function calls, especially to BlockBasedTableReader::MultiGet() and FullFilterBlockReader::KeysMayMatch()
2. Bloom filter cachelines can be prefetched, hiding the cache miss latency
The next step is to optimize the binary searches in the level_storage_info, index blocks and data blocks, since we could reduce the number of key comparisons if the keys are relatively close to each other. The batching optimizations also need to be extended to other formats, such as PlainTable and filter formats. This also needs to be added to db_stress.
Benchmark results from db_bench for various batch size/locality of reference combinations are given below. Locality was simulated by offsetting the keys in a batch by a stride length. Each SST file is about 8.6MB uncompressed and key/value size is 16/100 uncompressed. To focus on the cpu benefit of batching, the runs were single threaded and bound to the same cpu to eliminate interference from other system events. The results show a 10-25% improvement in micros/op from smaller to larger batch sizes (4 - 32).
Batch Sizes
1 | 2 | 4 | 8 | 16 | 32
Random pattern (Stride length 0)
4.158 | 4.109 | 4.026 | 4.05 | 4.1 | 4.074 - Get
4.438 | 4.302 | 4.165 | 4.122 | 4.096 | 4.075 - MultiGet (no batching)
4.461 | 4.256 | 4.277 | 4.11 | 4.182 | 4.14 - MultiGet (w/ batching)
Good locality (Stride length 16)
4.048 | 3.659 | 3.248 | 2.99 | 2.84 | 2.753
4.429 | 3.728 | 3.406 | 3.053 | 2.911 | 2.781
4.452 | 3.45 | 2.833 | 2.451 | 2.233 | 2.135
Good locality (Stride length 256)
4.066 | 3.786 | 3.581 | 3.447 | 3.415 | 3.232
4.406 | 4.005 | 3.644 | 3.49 | 3.381 | 3.268
4.393 | 3.649 | 3.186 | 2.882 | 2.676 | 2.62
Medium locality (Stride length 4096)
4.012 | 3.922 | 3.768 | 3.61 | 3.582 | 3.555
4.364 | 4.057 | 3.791 | 3.65 | 3.57 | 3.465
4.479 | 3.758 | 3.316 | 3.077 | 2.959 | 2.891
dbbench command used (on a DB with 4 levels, 12 million keys)-
TEST_TMPDIR=/dev/shm numactl -C 10 ./db_bench.tmp -use_existing_db=true -benchmarks="readseq,multireadrandom" -write_buffer_size=4194304 -target_file_size_base=4194304 -max_bytes_for_level_base=16777216 -num=12000000 -reads=12000000 -duration=90 -threads=1 -compression_type=none -cache_size=4194304000 -batch_size=32 -disable_auto_compactions=true -bloom_bits=10 -cache_index_and_filter_blocks=true -pin_l0_filter_and_index_blocks_in_cache=true -multiread_batched=true -multiread_stride=4
Pull Request resolved: https://github.com/facebook/rocksdb/pull/5011
Differential Revision: D14348703
Pulled By: anand1976
fbshipit-source-id: 774406dab3776d979c809522a67bedac6c17f84b
5 years ago
|
|
|
++found;
|
|
|
|
|
} else if (!stat_list[i].IsNotFound()) {
|
|
|
|
|
fprintf(stderr, "MultiGet returned an error: %s\n",
|
|
|
|
|
stat_list[i].ToString().c_str());
|
|
|
|
|
abort();
|
|
|
|
|
}
|
|
|
|
|
stat_list[i] = Status::OK();
|
|
|
|
|
pin_values[i].Reset();
|
|
|
|
|
}
|
|
|
|
|
}
|
|
|
|
|
if (thread->shared->read_rate_limiter.get() != nullptr &&
|
|
|
|
|
num_multireads % 256 == 255) {
|
|
|
|
|
thread->shared->read_rate_limiter->Request(
|
|
|
|
|
256 * entries_per_batch_, Env::IO_HIGH, nullptr /* stats */,
|
|
|
|
|
RateLimiter::OpType::kRead);
|
|
|
|
|
}
|
|
|
|
|
thread->stats.FinishedOps(nullptr, db, entries_per_batch_, kRead);
|
|
|
|
|
}
|
|
|
|
|
|
|
|
|
|
char msg[100];
|
|
|
|
|
snprintf(msg, sizeof(msg), "(%" PRIu64 " of %" PRIu64 " found)",
|
|
|
|
|
found, read);
|
|
|
|
|
thread->stats.AddBytes(bytes);
|
|
|
|
|
thread->stats.AddMessage(msg);
|
|
|
|
|
}
|
|
|
|
|
|
For ApproximateSizes, pro-rate table metadata size over data blocks (#6784)
Summary:
The implementation of GetApproximateSizes was inconsistent in
its treatment of the size of non-data blocks of SST files, sometimes
including and sometimes now. This was at its worst with large portion
of table file used by filters and querying a small range that crossed
a table boundary: the size estimate would include large filter size.
It's conceivable that someone might want only to know the size in terms
of data blocks, but I believe that's unlikely enough to ignore for now.
Similarly, there's no evidence the internal function AppoximateOffsetOf
is used for anything other than a one-sided ApproximateSize, so I intend
to refactor to remove redundancy in a follow-up commit.
So to fix this, GetApproximateSizes (and implementation details
ApproximateSize and ApproximateOffsetOf) now consistently include in
their returned sizes a portion of table file metadata (incl filters
and indexes) based on the size portion of the data blocks in range. In
other words, if a key range covers data blocks that are X% by size of all
the table's data blocks, returned approximate size is X% of the total
file size. It would technically be more accurate to attribute metadata
based on number of keys, but that's not computationally efficient with
data available and rarely a meaningful difference.
Also includes miscellaneous comment improvements / clarifications.
Also included is a new approximatesizerandom benchmark for db_bench.
No significant performance difference seen with this change, whether ~700 ops/sec with cache_index_and_filter_blocks and small cache or ~150k ops/sec without cache_index_and_filter_blocks.
Pull Request resolved: https://github.com/facebook/rocksdb/pull/6784
Test Plan:
Test added to DBTest.ApproximateSizesFilesWithErrorMargin.
Old code running new test...
[ RUN ] DBTest.ApproximateSizesFilesWithErrorMargin
db/db_test.cc:1562: Failure
Expected: (size) <= (11 * 100), actual: 9478 vs 1100
Other tests updated to reflect consistent accounting of metadata.
Reviewed By: siying
Differential Revision: D21334706
Pulled By: pdillinger
fbshipit-source-id: 6f86870e45213334fedbe9c73b4ebb1d8d611185
4 years ago
|
|
|
// Calls ApproximateSize over random key ranges.
|
|
|
|
|
void ApproximateSizeRandom(ThreadState* thread) {
|
|
|
|
|
int64_t size_sum = 0;
|
|
|
|
|
int64_t num_sizes = 0;
|
|
|
|
|
const size_t batch_size = entries_per_batch_;
|
|
|
|
|
std::vector<Range> ranges;
|
|
|
|
|
std::vector<Slice> lkeys;
|
|
|
|
|
std::vector<std::unique_ptr<const char[]>> lkey_guards;
|
|
|
|
|
std::vector<Slice> rkeys;
|
|
|
|
|
std::vector<std::unique_ptr<const char[]>> rkey_guards;
|
|
|
|
|
std::vector<uint64_t> sizes;
|
|
|
|
|
while (ranges.size() < batch_size) {
|
|
|
|
|
// Ugly without C++17 return from emplace_back
|
|
|
|
|
lkey_guards.emplace_back();
|
|
|
|
|
rkey_guards.emplace_back();
|
|
|
|
|
lkeys.emplace_back(AllocateKey(&lkey_guards.back()));
|
|
|
|
|
rkeys.emplace_back(AllocateKey(&rkey_guards.back()));
|
|
|
|
|
ranges.emplace_back(lkeys.back(), rkeys.back());
|
|
|
|
|
sizes.push_back(0);
|
|
|
|
|
}
|
|
|
|
|
Duration duration(FLAGS_duration, reads_);
|
|
|
|
|
while (!duration.Done(1)) {
|
|
|
|
|
DB* db = SelectDB(thread);
|
|
|
|
|
for (size_t i = 0; i < batch_size; ++i) {
|
|
|
|
|
int64_t lkey = GetRandomKey(&thread->rand);
|
|
|
|
|
int64_t rkey = GetRandomKey(&thread->rand);
|
|
|
|
|
if (lkey > rkey) {
|
|
|
|
|
std::swap(lkey, rkey);
|
|
|
|
|
}
|
|
|
|
|
GenerateKeyFromInt(lkey, FLAGS_num, &lkeys[i]);
|
|
|
|
|
GenerateKeyFromInt(rkey, FLAGS_num, &rkeys[i]);
|
|
|
|
|
}
|
|
|
|
|
db->GetApproximateSizes(&ranges[0], static_cast<int>(entries_per_batch_),
|
|
|
|
|
&sizes[0]);
|
|
|
|
|
num_sizes += entries_per_batch_;
|
|
|
|
|
for (int64_t size : sizes) {
|
|
|
|
|
size_sum += size;
|
|
|
|
|
}
|
|
|
|
|
thread->stats.FinishedOps(nullptr, db, entries_per_batch_, kOthers);
|
|
|
|
|
}
|
|
|
|
|
|
|
|
|
|
char msg[100];
|
|
|
|
|
snprintf(msg, sizeof(msg), "(Avg approx size=%g)",
|
|
|
|
|
static_cast<double>(size_sum) / static_cast<double>(num_sizes));
|
|
|
|
|
thread->stats.AddMessage(msg);
|
|
|
|
|
}
|
|
|
|
|
|
Workload generator (Mixgraph) based on prefix hotness (#5953)
Summary:
In the previous PR https://github.com/facebook/rocksdb/issues/4788, user can use db_bench mix_graph option to generate the workload that is from the social graph. The key is generated based on the key access hotness. In this PR, user can further model the key-range hotness and fit those to two-term-exponential distribution. First, user cuts the whole key space into small key ranges (e.g., key-ranges are the same size and the key-range number is the number of SST files). Then, user calculates the average access count per key of each key-range as the key-range hotness. Next, user fits the key-range hotness to two-term-exponential distribution (f(x) = f(x) = a*exp(b*x) + c*exp(d*x)) and generate the value of a, b, c, and d. They are the parameters in db_bench: prefix_dist_a, prefix_dist_b, prefix_dist_c, and prefix_dist_d. Finally, user can run db_bench by specify the parameters.
For example:
`./db_bench --benchmarks="mixgraph" -use_direct_io_for_flush_and_compaction=true -use_direct_reads=true -cache_size=268435456 -key_dist_a=0.002312 -key_dist_b=0.3467 -keyrange_dist_a=14.18 -keyrange_dist_b=-2.917 -keyrange_dist_c=0.0164 -keyrange_dist_d=-0.08082 -keyrange_num=30 -value_k=0.2615 -value_sigma=25.45 -iter_k=2.517 -iter_sigma=14.236 -mix_get_ratio=0.85 -mix_put_ratio=0.14 -mix_seek_ratio=0.01 -sine_mix_rate_interval_milliseconds=5000 -sine_a=350 -sine_b=0.0105 -sine_d=50000 --perf_level=2 -reads=1000000 -num=5000000 -key_size=48`
Pull Request resolved: https://github.com/facebook/rocksdb/pull/5953
Test Plan: run db_bench with different parameters and checked the results.
Differential Revision: D18053527
Pulled By: zhichao-cao
fbshipit-source-id: 171f8b3142bd76462f1967c58345ad7e4f84bab7
5 years ago
|
|
|
// The inverse function of Pareto distribution
|
Generate mixed workload with Get, Put, Seek in db_bench (#4788)
Summary:
Based on the specific workload models (key access distribution, value size distribution, and iterator scan length distribution, the QPS variation), the MixGraph benchmark generate the synthetic workload according to these distributions which can reflect the real-world workload characteristics.
After user enable the tracing function, they will get the trace file. By analyzing the trace file with the trace_analyzer tool, user can generate a set of statistic data files including. The *_accessed_key_stats.txt, *-accessed_value_size_distribution.txt, *-iterator_length_distribution.txt, and *-qps_stats.txt are mainly used to fit the Matlab model fitting. After that, user can get the parameters of the workload distributions (the modeling details are described: [here](https://github.com/facebook/rocksdb/wiki/RocksDB-Trace%2C-Replay%2C-and-Analyzer))
The key access distribution follows the The two-term power model. The probability density function is: `f(x) = ax^{b}+c`. The corresponding parameters are key_dist_a, key_dist_b, and key_dist_c in db_bench
For the value size distribution and iterator scan length distribution, they both follow the Generalized Pareto Distribution. The probability density function is `f(x) = (1/sigma)(1+k*(x-theta)/sigma))^{-1-1/k)`. The parameters are: value_k, value_theta, value_sigma and iter_k, iter_theta, iter_sigma. For more information about the Generalized Pareto Distribution, users can find the [wiki](https://en.wikipedia.org/wiki/Generalized_Pareto_distribution) and [Matalb page](https://www.mathworks.com/help/stats/generalized-pareto-distribution.html)
As for the QPS, it follows the diurnal pattern. So Sine is a good model to fit it. `F(x) = sine_a*sin(sine_b*x + sine_c) + sine_d`. The trace_will tell you the average QPS in the print out resutls, which is sine_d. After user fit the "*-qps_stats.txt" to the Matlab model, user can get the sine_a, sine_b, and sine_c. By using the 4 parameters, user can control the QPS variation including the period, average, changes.
To use the bench mark, user can indicate the following parameters as examples:
```
-benchmarks="mixgraph" -key_dist_a=0.002312 -key_dist_b=0.3467 -value_k=0.9233 -value_sigma=226.4092 -iter_k=2.517 -iter_sigma=14.236 -mix_get_ratio=0.7 -mix_put_ratio=0.25 -mix_seek_ratio=0.05 -sine_mix_rate_interval_milliseconds=500 -sine_a=15000 -sine_b=1 -sine_d=20000
```
Pull Request resolved: https://github.com/facebook/rocksdb/pull/4788
Differential Revision: D13573940
Pulled By: sagar0
fbshipit-source-id: e184c27e07b4f1bc0b436c2be36c5090c1fb0222
6 years ago
|
|
|
int64_t ParetoCdfInversion(double u, double theta, double k, double sigma) {
|
|
|
|
|
double ret;
|
|
|
|
|
if (k == 0.0) {
|
|
|
|
|
ret = theta - sigma * std::log(u);
|
|
|
|
|
} else {
|
|
|
|
|
ret = theta + sigma * (std::pow(u, -1 * k) - 1) / k;
|
|
|
|
|
}
|
|
|
|
|
return static_cast<int64_t>(ceil(ret));
|
|
|
|
|
}
|
Workload generator (Mixgraph) based on prefix hotness (#5953)
Summary:
In the previous PR https://github.com/facebook/rocksdb/issues/4788, user can use db_bench mix_graph option to generate the workload that is from the social graph. The key is generated based on the key access hotness. In this PR, user can further model the key-range hotness and fit those to two-term-exponential distribution. First, user cuts the whole key space into small key ranges (e.g., key-ranges are the same size and the key-range number is the number of SST files). Then, user calculates the average access count per key of each key-range as the key-range hotness. Next, user fits the key-range hotness to two-term-exponential distribution (f(x) = f(x) = a*exp(b*x) + c*exp(d*x)) and generate the value of a, b, c, and d. They are the parameters in db_bench: prefix_dist_a, prefix_dist_b, prefix_dist_c, and prefix_dist_d. Finally, user can run db_bench by specify the parameters.
For example:
`./db_bench --benchmarks="mixgraph" -use_direct_io_for_flush_and_compaction=true -use_direct_reads=true -cache_size=268435456 -key_dist_a=0.002312 -key_dist_b=0.3467 -keyrange_dist_a=14.18 -keyrange_dist_b=-2.917 -keyrange_dist_c=0.0164 -keyrange_dist_d=-0.08082 -keyrange_num=30 -value_k=0.2615 -value_sigma=25.45 -iter_k=2.517 -iter_sigma=14.236 -mix_get_ratio=0.85 -mix_put_ratio=0.14 -mix_seek_ratio=0.01 -sine_mix_rate_interval_milliseconds=5000 -sine_a=350 -sine_b=0.0105 -sine_d=50000 --perf_level=2 -reads=1000000 -num=5000000 -key_size=48`
Pull Request resolved: https://github.com/facebook/rocksdb/pull/5953
Test Plan: run db_bench with different parameters and checked the results.
Differential Revision: D18053527
Pulled By: zhichao-cao
fbshipit-source-id: 171f8b3142bd76462f1967c58345ad7e4f84bab7
5 years ago
|
|
|
// The inverse function of power distribution (y=ax^b)
|
Generate mixed workload with Get, Put, Seek in db_bench (#4788)
Summary:
Based on the specific workload models (key access distribution, value size distribution, and iterator scan length distribution, the QPS variation), the MixGraph benchmark generate the synthetic workload according to these distributions which can reflect the real-world workload characteristics.
After user enable the tracing function, they will get the trace file. By analyzing the trace file with the trace_analyzer tool, user can generate a set of statistic data files including. The *_accessed_key_stats.txt, *-accessed_value_size_distribution.txt, *-iterator_length_distribution.txt, and *-qps_stats.txt are mainly used to fit the Matlab model fitting. After that, user can get the parameters of the workload distributions (the modeling details are described: [here](https://github.com/facebook/rocksdb/wiki/RocksDB-Trace%2C-Replay%2C-and-Analyzer))
The key access distribution follows the The two-term power model. The probability density function is: `f(x) = ax^{b}+c`. The corresponding parameters are key_dist_a, key_dist_b, and key_dist_c in db_bench
For the value size distribution and iterator scan length distribution, they both follow the Generalized Pareto Distribution. The probability density function is `f(x) = (1/sigma)(1+k*(x-theta)/sigma))^{-1-1/k)`. The parameters are: value_k, value_theta, value_sigma and iter_k, iter_theta, iter_sigma. For more information about the Generalized Pareto Distribution, users can find the [wiki](https://en.wikipedia.org/wiki/Generalized_Pareto_distribution) and [Matalb page](https://www.mathworks.com/help/stats/generalized-pareto-distribution.html)
As for the QPS, it follows the diurnal pattern. So Sine is a good model to fit it. `F(x) = sine_a*sin(sine_b*x + sine_c) + sine_d`. The trace_will tell you the average QPS in the print out resutls, which is sine_d. After user fit the "*-qps_stats.txt" to the Matlab model, user can get the sine_a, sine_b, and sine_c. By using the 4 parameters, user can control the QPS variation including the period, average, changes.
To use the bench mark, user can indicate the following parameters as examples:
```
-benchmarks="mixgraph" -key_dist_a=0.002312 -key_dist_b=0.3467 -value_k=0.9233 -value_sigma=226.4092 -iter_k=2.517 -iter_sigma=14.236 -mix_get_ratio=0.7 -mix_put_ratio=0.25 -mix_seek_ratio=0.05 -sine_mix_rate_interval_milliseconds=500 -sine_a=15000 -sine_b=1 -sine_d=20000
```
Pull Request resolved: https://github.com/facebook/rocksdb/pull/4788
Differential Revision: D13573940
Pulled By: sagar0
fbshipit-source-id: e184c27e07b4f1bc0b436c2be36c5090c1fb0222
6 years ago
|
|
|
int64_t PowerCdfInversion(double u, double a, double b) {
|
|
|
|
|
double ret;
|
|
|
|
|
ret = std::pow((u / a), (1 / b));
|
|
|
|
|
return static_cast<int64_t>(ceil(ret));
|
|
|
|
|
}
|
|
|
|
|
|
|
|
|
|
// Add the noice to the QPS
|
|
|
|
|
double AddNoise(double origin, double noise_ratio) {
|
|
|
|
|
if (noise_ratio < 0.0 || noise_ratio > 1.0) {
|
|
|
|
|
return origin;
|
|
|
|
|
}
|
|
|
|
|
int band_int = static_cast<int>(FLAGS_sine_a);
|
|
|
|
|
double delta = (rand() % band_int - band_int / 2) * noise_ratio;
|
|
|
|
|
if (origin + delta < 0) {
|
|
|
|
|
return origin;
|
|
|
|
|
} else {
|
|
|
|
|
return (origin + delta);
|
|
|
|
|
}
|
|
|
|
|
}
|
|
|
|
|
|
Workload generator (Mixgraph) based on prefix hotness (#5953)
Summary:
In the previous PR https://github.com/facebook/rocksdb/issues/4788, user can use db_bench mix_graph option to generate the workload that is from the social graph. The key is generated based on the key access hotness. In this PR, user can further model the key-range hotness and fit those to two-term-exponential distribution. First, user cuts the whole key space into small key ranges (e.g., key-ranges are the same size and the key-range number is the number of SST files). Then, user calculates the average access count per key of each key-range as the key-range hotness. Next, user fits the key-range hotness to two-term-exponential distribution (f(x) = f(x) = a*exp(b*x) + c*exp(d*x)) and generate the value of a, b, c, and d. They are the parameters in db_bench: prefix_dist_a, prefix_dist_b, prefix_dist_c, and prefix_dist_d. Finally, user can run db_bench by specify the parameters.
For example:
`./db_bench --benchmarks="mixgraph" -use_direct_io_for_flush_and_compaction=true -use_direct_reads=true -cache_size=268435456 -key_dist_a=0.002312 -key_dist_b=0.3467 -keyrange_dist_a=14.18 -keyrange_dist_b=-2.917 -keyrange_dist_c=0.0164 -keyrange_dist_d=-0.08082 -keyrange_num=30 -value_k=0.2615 -value_sigma=25.45 -iter_k=2.517 -iter_sigma=14.236 -mix_get_ratio=0.85 -mix_put_ratio=0.14 -mix_seek_ratio=0.01 -sine_mix_rate_interval_milliseconds=5000 -sine_a=350 -sine_b=0.0105 -sine_d=50000 --perf_level=2 -reads=1000000 -num=5000000 -key_size=48`
Pull Request resolved: https://github.com/facebook/rocksdb/pull/5953
Test Plan: run db_bench with different parameters and checked the results.
Differential Revision: D18053527
Pulled By: zhichao-cao
fbshipit-source-id: 171f8b3142bd76462f1967c58345ad7e4f84bab7
5 years ago
|
|
|
// Decide the ratio of different query types
|
Generate mixed workload with Get, Put, Seek in db_bench (#4788)
Summary:
Based on the specific workload models (key access distribution, value size distribution, and iterator scan length distribution, the QPS variation), the MixGraph benchmark generate the synthetic workload according to these distributions which can reflect the real-world workload characteristics.
After user enable the tracing function, they will get the trace file. By analyzing the trace file with the trace_analyzer tool, user can generate a set of statistic data files including. The *_accessed_key_stats.txt, *-accessed_value_size_distribution.txt, *-iterator_length_distribution.txt, and *-qps_stats.txt are mainly used to fit the Matlab model fitting. After that, user can get the parameters of the workload distributions (the modeling details are described: [here](https://github.com/facebook/rocksdb/wiki/RocksDB-Trace%2C-Replay%2C-and-Analyzer))
The key access distribution follows the The two-term power model. The probability density function is: `f(x) = ax^{b}+c`. The corresponding parameters are key_dist_a, key_dist_b, and key_dist_c in db_bench
For the value size distribution and iterator scan length distribution, they both follow the Generalized Pareto Distribution. The probability density function is `f(x) = (1/sigma)(1+k*(x-theta)/sigma))^{-1-1/k)`. The parameters are: value_k, value_theta, value_sigma and iter_k, iter_theta, iter_sigma. For more information about the Generalized Pareto Distribution, users can find the [wiki](https://en.wikipedia.org/wiki/Generalized_Pareto_distribution) and [Matalb page](https://www.mathworks.com/help/stats/generalized-pareto-distribution.html)
As for the QPS, it follows the diurnal pattern. So Sine is a good model to fit it. `F(x) = sine_a*sin(sine_b*x + sine_c) + sine_d`. The trace_will tell you the average QPS in the print out resutls, which is sine_d. After user fit the "*-qps_stats.txt" to the Matlab model, user can get the sine_a, sine_b, and sine_c. By using the 4 parameters, user can control the QPS variation including the period, average, changes.
To use the bench mark, user can indicate the following parameters as examples:
```
-benchmarks="mixgraph" -key_dist_a=0.002312 -key_dist_b=0.3467 -value_k=0.9233 -value_sigma=226.4092 -iter_k=2.517 -iter_sigma=14.236 -mix_get_ratio=0.7 -mix_put_ratio=0.25 -mix_seek_ratio=0.05 -sine_mix_rate_interval_milliseconds=500 -sine_a=15000 -sine_b=1 -sine_d=20000
```
Pull Request resolved: https://github.com/facebook/rocksdb/pull/4788
Differential Revision: D13573940
Pulled By: sagar0
fbshipit-source-id: e184c27e07b4f1bc0b436c2be36c5090c1fb0222
6 years ago
|
|
|
// 0 Get, 1 Put, 2 Seek, 3 SeekForPrev, 4 Delete, 5 SingleDelete, 6 merge
|
|
|
|
|
class QueryDecider {
|
|
|
|
|
public:
|
|
|
|
|
std::vector<int> type_;
|
|
|
|
|
std::vector<double> ratio_;
|
|
|
|
|
int range_;
|
|
|
|
|
|
|
|
|
|
QueryDecider() {}
|
|
|
|
|
~QueryDecider() {}
|
|
|
|
|
|
|
|
|
|
Status Initiate(std::vector<double> ratio_input) {
|
|
|
|
|
int range_max = 1000;
|
|
|
|
|
double sum = 0.0;
|
|
|
|
|
for (auto& ratio : ratio_input) {
|
|
|
|
|
sum += ratio;
|
|
|
|
|
}
|
|
|
|
|
range_ = 0;
|
|
|
|
|
for (auto& ratio : ratio_input) {
|
|
|
|
|
range_ += static_cast<int>(ceil(range_max * (ratio / sum)));
|
|
|
|
|
type_.push_back(range_);
|
|
|
|
|
ratio_.push_back(ratio / sum);
|
|
|
|
|
}
|
|
|
|
|
return Status::OK();
|
|
|
|
|
}
|
|
|
|
|
|
|
|
|
|
int GetType(int64_t rand_num) {
|
|
|
|
|
if (rand_num < 0) {
|
|
|
|
|
rand_num = rand_num * (-1);
|
|
|
|
|
}
|
|
|
|
|
assert(range_ != 0);
|
Generate mixed workload with Get, Put, Seek in db_bench (#4788)
Summary:
Based on the specific workload models (key access distribution, value size distribution, and iterator scan length distribution, the QPS variation), the MixGraph benchmark generate the synthetic workload according to these distributions which can reflect the real-world workload characteristics.
After user enable the tracing function, they will get the trace file. By analyzing the trace file with the trace_analyzer tool, user can generate a set of statistic data files including. The *_accessed_key_stats.txt, *-accessed_value_size_distribution.txt, *-iterator_length_distribution.txt, and *-qps_stats.txt are mainly used to fit the Matlab model fitting. After that, user can get the parameters of the workload distributions (the modeling details are described: [here](https://github.com/facebook/rocksdb/wiki/RocksDB-Trace%2C-Replay%2C-and-Analyzer))
The key access distribution follows the The two-term power model. The probability density function is: `f(x) = ax^{b}+c`. The corresponding parameters are key_dist_a, key_dist_b, and key_dist_c in db_bench
For the value size distribution and iterator scan length distribution, they both follow the Generalized Pareto Distribution. The probability density function is `f(x) = (1/sigma)(1+k*(x-theta)/sigma))^{-1-1/k)`. The parameters are: value_k, value_theta, value_sigma and iter_k, iter_theta, iter_sigma. For more information about the Generalized Pareto Distribution, users can find the [wiki](https://en.wikipedia.org/wiki/Generalized_Pareto_distribution) and [Matalb page](https://www.mathworks.com/help/stats/generalized-pareto-distribution.html)
As for the QPS, it follows the diurnal pattern. So Sine is a good model to fit it. `F(x) = sine_a*sin(sine_b*x + sine_c) + sine_d`. The trace_will tell you the average QPS in the print out resutls, which is sine_d. After user fit the "*-qps_stats.txt" to the Matlab model, user can get the sine_a, sine_b, and sine_c. By using the 4 parameters, user can control the QPS variation including the period, average, changes.
To use the bench mark, user can indicate the following parameters as examples:
```
-benchmarks="mixgraph" -key_dist_a=0.002312 -key_dist_b=0.3467 -value_k=0.9233 -value_sigma=226.4092 -iter_k=2.517 -iter_sigma=14.236 -mix_get_ratio=0.7 -mix_put_ratio=0.25 -mix_seek_ratio=0.05 -sine_mix_rate_interval_milliseconds=500 -sine_a=15000 -sine_b=1 -sine_d=20000
```
Pull Request resolved: https://github.com/facebook/rocksdb/pull/4788
Differential Revision: D13573940
Pulled By: sagar0
fbshipit-source-id: e184c27e07b4f1bc0b436c2be36c5090c1fb0222
6 years ago
|
|
|
int pos = static_cast<int>(rand_num % range_);
|
|
|
|
|
for (int i = 0; i < static_cast<int>(type_.size()); i++) {
|
|
|
|
|
if (pos < type_[i]) {
|
|
|
|
|
return i;
|
|
|
|
|
}
|
|
|
|
|
}
|
|
|
|
|
return 0;
|
|
|
|
|
}
|
|
|
|
|
};
|
|
|
|
|
|
Workload generator (Mixgraph) based on prefix hotness (#5953)
Summary:
In the previous PR https://github.com/facebook/rocksdb/issues/4788, user can use db_bench mix_graph option to generate the workload that is from the social graph. The key is generated based on the key access hotness. In this PR, user can further model the key-range hotness and fit those to two-term-exponential distribution. First, user cuts the whole key space into small key ranges (e.g., key-ranges are the same size and the key-range number is the number of SST files). Then, user calculates the average access count per key of each key-range as the key-range hotness. Next, user fits the key-range hotness to two-term-exponential distribution (f(x) = f(x) = a*exp(b*x) + c*exp(d*x)) and generate the value of a, b, c, and d. They are the parameters in db_bench: prefix_dist_a, prefix_dist_b, prefix_dist_c, and prefix_dist_d. Finally, user can run db_bench by specify the parameters.
For example:
`./db_bench --benchmarks="mixgraph" -use_direct_io_for_flush_and_compaction=true -use_direct_reads=true -cache_size=268435456 -key_dist_a=0.002312 -key_dist_b=0.3467 -keyrange_dist_a=14.18 -keyrange_dist_b=-2.917 -keyrange_dist_c=0.0164 -keyrange_dist_d=-0.08082 -keyrange_num=30 -value_k=0.2615 -value_sigma=25.45 -iter_k=2.517 -iter_sigma=14.236 -mix_get_ratio=0.85 -mix_put_ratio=0.14 -mix_seek_ratio=0.01 -sine_mix_rate_interval_milliseconds=5000 -sine_a=350 -sine_b=0.0105 -sine_d=50000 --perf_level=2 -reads=1000000 -num=5000000 -key_size=48`
Pull Request resolved: https://github.com/facebook/rocksdb/pull/5953
Test Plan: run db_bench with different parameters and checked the results.
Differential Revision: D18053527
Pulled By: zhichao-cao
fbshipit-source-id: 171f8b3142bd76462f1967c58345ad7e4f84bab7
5 years ago
|
|
|
// KeyrangeUnit is the struct of a keyrange. It is used in a keyrange vector
|
|
|
|
|
// to transfer a random value to one keyrange based on the hotness.
|
|
|
|
|
struct KeyrangeUnit {
|
|
|
|
|
int64_t keyrange_start;
|
|
|
|
|
int64_t keyrange_access;
|
|
|
|
|
int64_t keyrange_keys;
|
|
|
|
|
};
|
|
|
|
|
|
|
|
|
|
// From our observations, the prefix hotness (key-range hotness) follows
|
|
|
|
|
// the two-term-exponential distribution: f(x) = a*exp(b*x) + c*exp(d*x).
|
|
|
|
|
// However, we cannot directly use the inverse function to decide a
|
|
|
|
|
// key-range from a random distribution. To achieve it, we create a list of
|
|
|
|
|
// KeyrangeUnit, each KeyrangeUnit occupies a range of integers whose size is
|
|
|
|
|
// decided based on the hotness of the key-range. When a random value is
|
|
|
|
|
// generated based on uniform distribution, we map it to the KeyrangeUnit Vec
|
|
|
|
|
// and one KeyrangeUnit is selected. The probability of a KeyrangeUnit being
|
|
|
|
|
// selected is the same as the hotness of this KeyrangeUnit. After that, the
|
|
|
|
|
// key can be randomly allocated to the key-range of this KeyrangeUnit, or we
|
|
|
|
|
// can based on the power distribution (y=ax^b) to generate the offset of
|
|
|
|
|
// the key in the selected key-range. In this way, we generate the keyID
|
|
|
|
|
// based on the hotness of the prefix and also the key hotness distribution.
|
|
|
|
|
class GenerateTwoTermExpKeys {
|
|
|
|
|
public:
|
|
|
|
|
// Avoid uninitialized warning-as-error in some compilers
|
|
|
|
|
int64_t keyrange_rand_max_ = 0;
|
|
|
|
|
int64_t keyrange_size_ = 0;
|
|
|
|
|
int64_t keyrange_num_ = 0;
|
Workload generator (Mixgraph) based on prefix hotness (#5953)
Summary:
In the previous PR https://github.com/facebook/rocksdb/issues/4788, user can use db_bench mix_graph option to generate the workload that is from the social graph. The key is generated based on the key access hotness. In this PR, user can further model the key-range hotness and fit those to two-term-exponential distribution. First, user cuts the whole key space into small key ranges (e.g., key-ranges are the same size and the key-range number is the number of SST files). Then, user calculates the average access count per key of each key-range as the key-range hotness. Next, user fits the key-range hotness to two-term-exponential distribution (f(x) = f(x) = a*exp(b*x) + c*exp(d*x)) and generate the value of a, b, c, and d. They are the parameters in db_bench: prefix_dist_a, prefix_dist_b, prefix_dist_c, and prefix_dist_d. Finally, user can run db_bench by specify the parameters.
For example:
`./db_bench --benchmarks="mixgraph" -use_direct_io_for_flush_and_compaction=true -use_direct_reads=true -cache_size=268435456 -key_dist_a=0.002312 -key_dist_b=0.3467 -keyrange_dist_a=14.18 -keyrange_dist_b=-2.917 -keyrange_dist_c=0.0164 -keyrange_dist_d=-0.08082 -keyrange_num=30 -value_k=0.2615 -value_sigma=25.45 -iter_k=2.517 -iter_sigma=14.236 -mix_get_ratio=0.85 -mix_put_ratio=0.14 -mix_seek_ratio=0.01 -sine_mix_rate_interval_milliseconds=5000 -sine_a=350 -sine_b=0.0105 -sine_d=50000 --perf_level=2 -reads=1000000 -num=5000000 -key_size=48`
Pull Request resolved: https://github.com/facebook/rocksdb/pull/5953
Test Plan: run db_bench with different parameters and checked the results.
Differential Revision: D18053527
Pulled By: zhichao-cao
fbshipit-source-id: 171f8b3142bd76462f1967c58345ad7e4f84bab7
5 years ago
|
|
|
std::vector<KeyrangeUnit> keyrange_set_;
|
|
|
|
|
|
|
|
|
|
// Initiate the KeyrangeUnit vector and calculate the size of each
|
|
|
|
|
// KeyrangeUnit.
|
|
|
|
|
Status InitiateExpDistribution(int64_t total_keys, double prefix_a,
|
|
|
|
|
double prefix_b, double prefix_c,
|
|
|
|
|
double prefix_d) {
|
|
|
|
|
int64_t amplify = 0;
|
|
|
|
|
int64_t keyrange_start = 0;
|
|
|
|
|
if (FLAGS_keyrange_num <= 0) {
|
|
|
|
|
keyrange_num_ = 1;
|
|
|
|
|
} else {
|
|
|
|
|
keyrange_num_ = FLAGS_keyrange_num;
|
|
|
|
|
}
|
|
|
|
|
keyrange_size_ = total_keys / keyrange_num_;
|
|
|
|
|
|
|
|
|
|
// Calculate the key-range shares size based on the input parameters
|
|
|
|
|
for (int64_t pfx = keyrange_num_; pfx >= 1; pfx--) {
|
|
|
|
|
// Step 1. Calculate the probability that this key range will be
|
|
|
|
|
// accessed in a query. It is based on the two-term expoential
|
|
|
|
|
// distribution
|
|
|
|
|
double keyrange_p = prefix_a * std::exp(prefix_b * pfx) +
|
|
|
|
|
prefix_c * std::exp(prefix_d * pfx);
|
|
|
|
|
if (keyrange_p < std::pow(10.0, -16.0)) {
|
|
|
|
|
keyrange_p = 0.0;
|
|
|
|
|
}
|
|
|
|
|
// Step 2. Calculate the amplify
|
|
|
|
|
// In order to allocate a query to a key-range based on the random
|
|
|
|
|
// number generated for this query, we need to extend the probability
|
|
|
|
|
// of each key range from [0,1] to [0, amplify]. Amplify is calculated
|
|
|
|
|
// by 1/(smallest key-range probability). In this way, we ensure that
|
|
|
|
|
// all key-ranges are assigned with an Integer that >=0
|
|
|
|
|
if (amplify == 0 && keyrange_p > 0) {
|
|
|
|
|
amplify = static_cast<int64_t>(std::floor(1 / keyrange_p)) + 1;
|
|
|
|
|
}
|
|
|
|
|
|
|
|
|
|
// Step 3. For each key-range, we calculate its position in the
|
|
|
|
|
// [0, amplify] range, including the start, the size (keyrange_access)
|
|
|
|
|
KeyrangeUnit p_unit;
|
|
|
|
|
p_unit.keyrange_start = keyrange_start;
|
|
|
|
|
if (0.0 >= keyrange_p) {
|
|
|
|
|
p_unit.keyrange_access = 0;
|
|
|
|
|
} else {
|
|
|
|
|
p_unit.keyrange_access =
|
|
|
|
|
static_cast<int64_t>(std::floor(amplify * keyrange_p));
|
|
|
|
|
}
|
|
|
|
|
p_unit.keyrange_keys = keyrange_size_;
|
|
|
|
|
keyrange_set_.push_back(p_unit);
|
|
|
|
|
keyrange_start += p_unit.keyrange_access;
|
|
|
|
|
}
|
|
|
|
|
keyrange_rand_max_ = keyrange_start;
|
|
|
|
|
|
|
|
|
|
// Step 4. Shuffle the key-ranges randomly
|
|
|
|
|
// Since the access probability is calculated from small to large,
|
|
|
|
|
// If we do not re-allocate them, hot key-ranges are always at the end
|
|
|
|
|
// and cold key-ranges are at the begin of the key space. Therefore, the
|
|
|
|
|
// key-ranges are shuffled and the rand seed is only decide by the
|
|
|
|
|
// key-range hotness distribution. With the same distribution parameters
|
|
|
|
|
// the shuffle results are the same.
|
|
|
|
|
Random64 rand_loca(keyrange_rand_max_);
|
|
|
|
|
for (int64_t i = 0; i < FLAGS_keyrange_num; i++) {
|
|
|
|
|
int64_t pos = rand_loca.Next() % FLAGS_keyrange_num;
|
|
|
|
|
assert(i >= 0 && i < static_cast<int64_t>(keyrange_set_.size()) &&
|
|
|
|
|
pos >= 0 && pos < static_cast<int64_t>(keyrange_set_.size()));
|
|
|
|
|
std::swap(keyrange_set_[i], keyrange_set_[pos]);
|
|
|
|
|
}
|
|
|
|
|
|
|
|
|
|
// Step 5. Recalculate the prefix start postion after shuffling
|
|
|
|
|
int64_t offset = 0;
|
|
|
|
|
for (auto& p_unit : keyrange_set_) {
|
|
|
|
|
p_unit.keyrange_start = offset;
|
|
|
|
|
offset += p_unit.keyrange_access;
|
|
|
|
|
}
|
|
|
|
|
|
|
|
|
|
return Status::OK();
|
|
|
|
|
}
|
|
|
|
|
|
|
|
|
|
// Generate the Key ID according to the input ini_rand and key distribution
|
|
|
|
|
int64_t DistGetKeyID(int64_t ini_rand, double key_dist_a,
|
|
|
|
|
double key_dist_b) {
|
|
|
|
|
int64_t keyrange_rand = ini_rand % keyrange_rand_max_;
|
|
|
|
|
|
|
|
|
|
// Calculate and select one key-range that contains the new key
|
|
|
|
|
int64_t start = 0, end = static_cast<int64_t>(keyrange_set_.size());
|
|
|
|
|
while (start + 1 < end) {
|
|
|
|
|
int64_t mid = start + (end - start) / 2;
|
|
|
|
|
assert(mid >= 0 && mid < static_cast<int64_t>(keyrange_set_.size()));
|
|
|
|
|
if (keyrange_rand < keyrange_set_[mid].keyrange_start) {
|
|
|
|
|
end = mid;
|
|
|
|
|
} else {
|
|
|
|
|
start = mid;
|
|
|
|
|
}
|
|
|
|
|
}
|
|
|
|
|
int64_t keyrange_id = start;
|
|
|
|
|
|
|
|
|
|
// Select one key in the key-range and compose the keyID
|
|
|
|
|
int64_t key_offset = 0, key_seed;
|
|
|
|
|
if (key_dist_a == 0.0 || key_dist_b == 0.0) {
|
Workload generator (Mixgraph) based on prefix hotness (#5953)
Summary:
In the previous PR https://github.com/facebook/rocksdb/issues/4788, user can use db_bench mix_graph option to generate the workload that is from the social graph. The key is generated based on the key access hotness. In this PR, user can further model the key-range hotness and fit those to two-term-exponential distribution. First, user cuts the whole key space into small key ranges (e.g., key-ranges are the same size and the key-range number is the number of SST files). Then, user calculates the average access count per key of each key-range as the key-range hotness. Next, user fits the key-range hotness to two-term-exponential distribution (f(x) = f(x) = a*exp(b*x) + c*exp(d*x)) and generate the value of a, b, c, and d. They are the parameters in db_bench: prefix_dist_a, prefix_dist_b, prefix_dist_c, and prefix_dist_d. Finally, user can run db_bench by specify the parameters.
For example:
`./db_bench --benchmarks="mixgraph" -use_direct_io_for_flush_and_compaction=true -use_direct_reads=true -cache_size=268435456 -key_dist_a=0.002312 -key_dist_b=0.3467 -keyrange_dist_a=14.18 -keyrange_dist_b=-2.917 -keyrange_dist_c=0.0164 -keyrange_dist_d=-0.08082 -keyrange_num=30 -value_k=0.2615 -value_sigma=25.45 -iter_k=2.517 -iter_sigma=14.236 -mix_get_ratio=0.85 -mix_put_ratio=0.14 -mix_seek_ratio=0.01 -sine_mix_rate_interval_milliseconds=5000 -sine_a=350 -sine_b=0.0105 -sine_d=50000 --perf_level=2 -reads=1000000 -num=5000000 -key_size=48`
Pull Request resolved: https://github.com/facebook/rocksdb/pull/5953
Test Plan: run db_bench with different parameters and checked the results.
Differential Revision: D18053527
Pulled By: zhichao-cao
fbshipit-source-id: 171f8b3142bd76462f1967c58345ad7e4f84bab7
5 years ago
|
|
|
key_offset = ini_rand % keyrange_size_;
|
|
|
|
|
} else {
|
|
|
|
|
double u =
|
|
|
|
|
static_cast<double>(ini_rand % keyrange_size_) / keyrange_size_;
|
Workload generator (Mixgraph) based on prefix hotness (#5953)
Summary:
In the previous PR https://github.com/facebook/rocksdb/issues/4788, user can use db_bench mix_graph option to generate the workload that is from the social graph. The key is generated based on the key access hotness. In this PR, user can further model the key-range hotness and fit those to two-term-exponential distribution. First, user cuts the whole key space into small key ranges (e.g., key-ranges are the same size and the key-range number is the number of SST files). Then, user calculates the average access count per key of each key-range as the key-range hotness. Next, user fits the key-range hotness to two-term-exponential distribution (f(x) = f(x) = a*exp(b*x) + c*exp(d*x)) and generate the value of a, b, c, and d. They are the parameters in db_bench: prefix_dist_a, prefix_dist_b, prefix_dist_c, and prefix_dist_d. Finally, user can run db_bench by specify the parameters.
For example:
`./db_bench --benchmarks="mixgraph" -use_direct_io_for_flush_and_compaction=true -use_direct_reads=true -cache_size=268435456 -key_dist_a=0.002312 -key_dist_b=0.3467 -keyrange_dist_a=14.18 -keyrange_dist_b=-2.917 -keyrange_dist_c=0.0164 -keyrange_dist_d=-0.08082 -keyrange_num=30 -value_k=0.2615 -value_sigma=25.45 -iter_k=2.517 -iter_sigma=14.236 -mix_get_ratio=0.85 -mix_put_ratio=0.14 -mix_seek_ratio=0.01 -sine_mix_rate_interval_milliseconds=5000 -sine_a=350 -sine_b=0.0105 -sine_d=50000 --perf_level=2 -reads=1000000 -num=5000000 -key_size=48`
Pull Request resolved: https://github.com/facebook/rocksdb/pull/5953
Test Plan: run db_bench with different parameters and checked the results.
Differential Revision: D18053527
Pulled By: zhichao-cao
fbshipit-source-id: 171f8b3142bd76462f1967c58345ad7e4f84bab7
5 years ago
|
|
|
key_seed = static_cast<int64_t>(
|
|
|
|
|
ceil(std::pow((u / key_dist_a), (1 / key_dist_b))));
|
Workload generator (Mixgraph) based on prefix hotness (#5953)
Summary:
In the previous PR https://github.com/facebook/rocksdb/issues/4788, user can use db_bench mix_graph option to generate the workload that is from the social graph. The key is generated based on the key access hotness. In this PR, user can further model the key-range hotness and fit those to two-term-exponential distribution. First, user cuts the whole key space into small key ranges (e.g., key-ranges are the same size and the key-range number is the number of SST files). Then, user calculates the average access count per key of each key-range as the key-range hotness. Next, user fits the key-range hotness to two-term-exponential distribution (f(x) = f(x) = a*exp(b*x) + c*exp(d*x)) and generate the value of a, b, c, and d. They are the parameters in db_bench: prefix_dist_a, prefix_dist_b, prefix_dist_c, and prefix_dist_d. Finally, user can run db_bench by specify the parameters.
For example:
`./db_bench --benchmarks="mixgraph" -use_direct_io_for_flush_and_compaction=true -use_direct_reads=true -cache_size=268435456 -key_dist_a=0.002312 -key_dist_b=0.3467 -keyrange_dist_a=14.18 -keyrange_dist_b=-2.917 -keyrange_dist_c=0.0164 -keyrange_dist_d=-0.08082 -keyrange_num=30 -value_k=0.2615 -value_sigma=25.45 -iter_k=2.517 -iter_sigma=14.236 -mix_get_ratio=0.85 -mix_put_ratio=0.14 -mix_seek_ratio=0.01 -sine_mix_rate_interval_milliseconds=5000 -sine_a=350 -sine_b=0.0105 -sine_d=50000 --perf_level=2 -reads=1000000 -num=5000000 -key_size=48`
Pull Request resolved: https://github.com/facebook/rocksdb/pull/5953
Test Plan: run db_bench with different parameters and checked the results.
Differential Revision: D18053527
Pulled By: zhichao-cao
fbshipit-source-id: 171f8b3142bd76462f1967c58345ad7e4f84bab7
5 years ago
|
|
|
Random64 rand_key(key_seed);
|
|
|
|
|
key_offset = rand_key.Next() % keyrange_size_;
|
Workload generator (Mixgraph) based on prefix hotness (#5953)
Summary:
In the previous PR https://github.com/facebook/rocksdb/issues/4788, user can use db_bench mix_graph option to generate the workload that is from the social graph. The key is generated based on the key access hotness. In this PR, user can further model the key-range hotness and fit those to two-term-exponential distribution. First, user cuts the whole key space into small key ranges (e.g., key-ranges are the same size and the key-range number is the number of SST files). Then, user calculates the average access count per key of each key-range as the key-range hotness. Next, user fits the key-range hotness to two-term-exponential distribution (f(x) = f(x) = a*exp(b*x) + c*exp(d*x)) and generate the value of a, b, c, and d. They are the parameters in db_bench: prefix_dist_a, prefix_dist_b, prefix_dist_c, and prefix_dist_d. Finally, user can run db_bench by specify the parameters.
For example:
`./db_bench --benchmarks="mixgraph" -use_direct_io_for_flush_and_compaction=true -use_direct_reads=true -cache_size=268435456 -key_dist_a=0.002312 -key_dist_b=0.3467 -keyrange_dist_a=14.18 -keyrange_dist_b=-2.917 -keyrange_dist_c=0.0164 -keyrange_dist_d=-0.08082 -keyrange_num=30 -value_k=0.2615 -value_sigma=25.45 -iter_k=2.517 -iter_sigma=14.236 -mix_get_ratio=0.85 -mix_put_ratio=0.14 -mix_seek_ratio=0.01 -sine_mix_rate_interval_milliseconds=5000 -sine_a=350 -sine_b=0.0105 -sine_d=50000 --perf_level=2 -reads=1000000 -num=5000000 -key_size=48`
Pull Request resolved: https://github.com/facebook/rocksdb/pull/5953
Test Plan: run db_bench with different parameters and checked the results.
Differential Revision: D18053527
Pulled By: zhichao-cao
fbshipit-source-id: 171f8b3142bd76462f1967c58345ad7e4f84bab7
5 years ago
|
|
|
}
|
|
|
|
|
return keyrange_size_ * keyrange_id + key_offset;
|
|
|
|
|
}
|
|
|
|
|
};
|
|
|
|
|
|
|
|
|
|
// The social graph workload mixed with Get, Put, Iterator queries.
|
Workload generator (Mixgraph) based on prefix hotness (#5953)
Summary:
In the previous PR https://github.com/facebook/rocksdb/issues/4788, user can use db_bench mix_graph option to generate the workload that is from the social graph. The key is generated based on the key access hotness. In this PR, user can further model the key-range hotness and fit those to two-term-exponential distribution. First, user cuts the whole key space into small key ranges (e.g., key-ranges are the same size and the key-range number is the number of SST files). Then, user calculates the average access count per key of each key-range as the key-range hotness. Next, user fits the key-range hotness to two-term-exponential distribution (f(x) = f(x) = a*exp(b*x) + c*exp(d*x)) and generate the value of a, b, c, and d. They are the parameters in db_bench: prefix_dist_a, prefix_dist_b, prefix_dist_c, and prefix_dist_d. Finally, user can run db_bench by specify the parameters.
For example:
`./db_bench --benchmarks="mixgraph" -use_direct_io_for_flush_and_compaction=true -use_direct_reads=true -cache_size=268435456 -key_dist_a=0.002312 -key_dist_b=0.3467 -keyrange_dist_a=14.18 -keyrange_dist_b=-2.917 -keyrange_dist_c=0.0164 -keyrange_dist_d=-0.08082 -keyrange_num=30 -value_k=0.2615 -value_sigma=25.45 -iter_k=2.517 -iter_sigma=14.236 -mix_get_ratio=0.85 -mix_put_ratio=0.14 -mix_seek_ratio=0.01 -sine_mix_rate_interval_milliseconds=5000 -sine_a=350 -sine_b=0.0105 -sine_d=50000 --perf_level=2 -reads=1000000 -num=5000000 -key_size=48`
Pull Request resolved: https://github.com/facebook/rocksdb/pull/5953
Test Plan: run db_bench with different parameters and checked the results.
Differential Revision: D18053527
Pulled By: zhichao-cao
fbshipit-source-id: 171f8b3142bd76462f1967c58345ad7e4f84bab7
5 years ago
|
|
|
// The value size and iterator length follow Pareto distribution.
|
|
|
|
|
// The overall key access follow power distribution. If user models the
|
|
|
|
|
// workload based on different key-ranges (or different prefixes), user
|
|
|
|
|
// can use two-term-exponential distribution to fit the workload. User
|
|
|
|
|
// needs to decide the ratio between Get, Put, Iterator queries before
|
Workload generator (Mixgraph) based on prefix hotness (#5953)
Summary:
In the previous PR https://github.com/facebook/rocksdb/issues/4788, user can use db_bench mix_graph option to generate the workload that is from the social graph. The key is generated based on the key access hotness. In this PR, user can further model the key-range hotness and fit those to two-term-exponential distribution. First, user cuts the whole key space into small key ranges (e.g., key-ranges are the same size and the key-range number is the number of SST files). Then, user calculates the average access count per key of each key-range as the key-range hotness. Next, user fits the key-range hotness to two-term-exponential distribution (f(x) = f(x) = a*exp(b*x) + c*exp(d*x)) and generate the value of a, b, c, and d. They are the parameters in db_bench: prefix_dist_a, prefix_dist_b, prefix_dist_c, and prefix_dist_d. Finally, user can run db_bench by specify the parameters.
For example:
`./db_bench --benchmarks="mixgraph" -use_direct_io_for_flush_and_compaction=true -use_direct_reads=true -cache_size=268435456 -key_dist_a=0.002312 -key_dist_b=0.3467 -keyrange_dist_a=14.18 -keyrange_dist_b=-2.917 -keyrange_dist_c=0.0164 -keyrange_dist_d=-0.08082 -keyrange_num=30 -value_k=0.2615 -value_sigma=25.45 -iter_k=2.517 -iter_sigma=14.236 -mix_get_ratio=0.85 -mix_put_ratio=0.14 -mix_seek_ratio=0.01 -sine_mix_rate_interval_milliseconds=5000 -sine_a=350 -sine_b=0.0105 -sine_d=50000 --perf_level=2 -reads=1000000 -num=5000000 -key_size=48`
Pull Request resolved: https://github.com/facebook/rocksdb/pull/5953
Test Plan: run db_bench with different parameters and checked the results.
Differential Revision: D18053527
Pulled By: zhichao-cao
fbshipit-source-id: 171f8b3142bd76462f1967c58345ad7e4f84bab7
5 years ago
|
|
|
// starting the benchmark.
|
Generate mixed workload with Get, Put, Seek in db_bench (#4788)
Summary:
Based on the specific workload models (key access distribution, value size distribution, and iterator scan length distribution, the QPS variation), the MixGraph benchmark generate the synthetic workload according to these distributions which can reflect the real-world workload characteristics.
After user enable the tracing function, they will get the trace file. By analyzing the trace file with the trace_analyzer tool, user can generate a set of statistic data files including. The *_accessed_key_stats.txt, *-accessed_value_size_distribution.txt, *-iterator_length_distribution.txt, and *-qps_stats.txt are mainly used to fit the Matlab model fitting. After that, user can get the parameters of the workload distributions (the modeling details are described: [here](https://github.com/facebook/rocksdb/wiki/RocksDB-Trace%2C-Replay%2C-and-Analyzer))
The key access distribution follows the The two-term power model. The probability density function is: `f(x) = ax^{b}+c`. The corresponding parameters are key_dist_a, key_dist_b, and key_dist_c in db_bench
For the value size distribution and iterator scan length distribution, they both follow the Generalized Pareto Distribution. The probability density function is `f(x) = (1/sigma)(1+k*(x-theta)/sigma))^{-1-1/k)`. The parameters are: value_k, value_theta, value_sigma and iter_k, iter_theta, iter_sigma. For more information about the Generalized Pareto Distribution, users can find the [wiki](https://en.wikipedia.org/wiki/Generalized_Pareto_distribution) and [Matalb page](https://www.mathworks.com/help/stats/generalized-pareto-distribution.html)
As for the QPS, it follows the diurnal pattern. So Sine is a good model to fit it. `F(x) = sine_a*sin(sine_b*x + sine_c) + sine_d`. The trace_will tell you the average QPS in the print out resutls, which is sine_d. After user fit the "*-qps_stats.txt" to the Matlab model, user can get the sine_a, sine_b, and sine_c. By using the 4 parameters, user can control the QPS variation including the period, average, changes.
To use the bench mark, user can indicate the following parameters as examples:
```
-benchmarks="mixgraph" -key_dist_a=0.002312 -key_dist_b=0.3467 -value_k=0.9233 -value_sigma=226.4092 -iter_k=2.517 -iter_sigma=14.236 -mix_get_ratio=0.7 -mix_put_ratio=0.25 -mix_seek_ratio=0.05 -sine_mix_rate_interval_milliseconds=500 -sine_a=15000 -sine_b=1 -sine_d=20000
```
Pull Request resolved: https://github.com/facebook/rocksdb/pull/4788
Differential Revision: D13573940
Pulled By: sagar0
fbshipit-source-id: e184c27e07b4f1bc0b436c2be36c5090c1fb0222
6 years ago
|
|
|
void MixGraph(ThreadState* thread) {
|
|
|
|
|
int64_t gets = 0;
|
|
|
|
|
int64_t puts = 0;
|
|
|
|
|
int64_t get_found = 0;
|
Generate mixed workload with Get, Put, Seek in db_bench (#4788)
Summary:
Based on the specific workload models (key access distribution, value size distribution, and iterator scan length distribution, the QPS variation), the MixGraph benchmark generate the synthetic workload according to these distributions which can reflect the real-world workload characteristics.
After user enable the tracing function, they will get the trace file. By analyzing the trace file with the trace_analyzer tool, user can generate a set of statistic data files including. The *_accessed_key_stats.txt, *-accessed_value_size_distribution.txt, *-iterator_length_distribution.txt, and *-qps_stats.txt are mainly used to fit the Matlab model fitting. After that, user can get the parameters of the workload distributions (the modeling details are described: [here](https://github.com/facebook/rocksdb/wiki/RocksDB-Trace%2C-Replay%2C-and-Analyzer))
The key access distribution follows the The two-term power model. The probability density function is: `f(x) = ax^{b}+c`. The corresponding parameters are key_dist_a, key_dist_b, and key_dist_c in db_bench
For the value size distribution and iterator scan length distribution, they both follow the Generalized Pareto Distribution. The probability density function is `f(x) = (1/sigma)(1+k*(x-theta)/sigma))^{-1-1/k)`. The parameters are: value_k, value_theta, value_sigma and iter_k, iter_theta, iter_sigma. For more information about the Generalized Pareto Distribution, users can find the [wiki](https://en.wikipedia.org/wiki/Generalized_Pareto_distribution) and [Matalb page](https://www.mathworks.com/help/stats/generalized-pareto-distribution.html)
As for the QPS, it follows the diurnal pattern. So Sine is a good model to fit it. `F(x) = sine_a*sin(sine_b*x + sine_c) + sine_d`. The trace_will tell you the average QPS in the print out resutls, which is sine_d. After user fit the "*-qps_stats.txt" to the Matlab model, user can get the sine_a, sine_b, and sine_c. By using the 4 parameters, user can control the QPS variation including the period, average, changes.
To use the bench mark, user can indicate the following parameters as examples:
```
-benchmarks="mixgraph" -key_dist_a=0.002312 -key_dist_b=0.3467 -value_k=0.9233 -value_sigma=226.4092 -iter_k=2.517 -iter_sigma=14.236 -mix_get_ratio=0.7 -mix_put_ratio=0.25 -mix_seek_ratio=0.05 -sine_mix_rate_interval_milliseconds=500 -sine_a=15000 -sine_b=1 -sine_d=20000
```
Pull Request resolved: https://github.com/facebook/rocksdb/pull/4788
Differential Revision: D13573940
Pulled By: sagar0
fbshipit-source-id: e184c27e07b4f1bc0b436c2be36c5090c1fb0222
6 years ago
|
|
|
int64_t seek = 0;
|
|
|
|
|
int64_t seek_found = 0;
|
|
|
|
|
int64_t bytes = 0;
|
|
|
|
|
double total_scan_length = 0;
|
|
|
|
|
double total_val_size = 0;
|
|
|
|
|
const int64_t default_value_max = 1 * 1024 * 1024;
|
|
|
|
|
int64_t value_max = default_value_max;
|
Generate mixed workload with Get, Put, Seek in db_bench (#4788)
Summary:
Based on the specific workload models (key access distribution, value size distribution, and iterator scan length distribution, the QPS variation), the MixGraph benchmark generate the synthetic workload according to these distributions which can reflect the real-world workload characteristics.
After user enable the tracing function, they will get the trace file. By analyzing the trace file with the trace_analyzer tool, user can generate a set of statistic data files including. The *_accessed_key_stats.txt, *-accessed_value_size_distribution.txt, *-iterator_length_distribution.txt, and *-qps_stats.txt are mainly used to fit the Matlab model fitting. After that, user can get the parameters of the workload distributions (the modeling details are described: [here](https://github.com/facebook/rocksdb/wiki/RocksDB-Trace%2C-Replay%2C-and-Analyzer))
The key access distribution follows the The two-term power model. The probability density function is: `f(x) = ax^{b}+c`. The corresponding parameters are key_dist_a, key_dist_b, and key_dist_c in db_bench
For the value size distribution and iterator scan length distribution, they both follow the Generalized Pareto Distribution. The probability density function is `f(x) = (1/sigma)(1+k*(x-theta)/sigma))^{-1-1/k)`. The parameters are: value_k, value_theta, value_sigma and iter_k, iter_theta, iter_sigma. For more information about the Generalized Pareto Distribution, users can find the [wiki](https://en.wikipedia.org/wiki/Generalized_Pareto_distribution) and [Matalb page](https://www.mathworks.com/help/stats/generalized-pareto-distribution.html)
As for the QPS, it follows the diurnal pattern. So Sine is a good model to fit it. `F(x) = sine_a*sin(sine_b*x + sine_c) + sine_d`. The trace_will tell you the average QPS in the print out resutls, which is sine_d. After user fit the "*-qps_stats.txt" to the Matlab model, user can get the sine_a, sine_b, and sine_c. By using the 4 parameters, user can control the QPS variation including the period, average, changes.
To use the bench mark, user can indicate the following parameters as examples:
```
-benchmarks="mixgraph" -key_dist_a=0.002312 -key_dist_b=0.3467 -value_k=0.9233 -value_sigma=226.4092 -iter_k=2.517 -iter_sigma=14.236 -mix_get_ratio=0.7 -mix_put_ratio=0.25 -mix_seek_ratio=0.05 -sine_mix_rate_interval_milliseconds=500 -sine_a=15000 -sine_b=1 -sine_d=20000
```
Pull Request resolved: https://github.com/facebook/rocksdb/pull/4788
Differential Revision: D13573940
Pulled By: sagar0
fbshipit-source-id: e184c27e07b4f1bc0b436c2be36c5090c1fb0222
6 years ago
|
|
|
int64_t scan_len_max = FLAGS_mix_max_scan_len;
|
|
|
|
|
double write_rate = 1000000.0;
|
|
|
|
|
double read_rate = 1000000.0;
|
Workload generator (Mixgraph) based on prefix hotness (#5953)
Summary:
In the previous PR https://github.com/facebook/rocksdb/issues/4788, user can use db_bench mix_graph option to generate the workload that is from the social graph. The key is generated based on the key access hotness. In this PR, user can further model the key-range hotness and fit those to two-term-exponential distribution. First, user cuts the whole key space into small key ranges (e.g., key-ranges are the same size and the key-range number is the number of SST files). Then, user calculates the average access count per key of each key-range as the key-range hotness. Next, user fits the key-range hotness to two-term-exponential distribution (f(x) = f(x) = a*exp(b*x) + c*exp(d*x)) and generate the value of a, b, c, and d. They are the parameters in db_bench: prefix_dist_a, prefix_dist_b, prefix_dist_c, and prefix_dist_d. Finally, user can run db_bench by specify the parameters.
For example:
`./db_bench --benchmarks="mixgraph" -use_direct_io_for_flush_and_compaction=true -use_direct_reads=true -cache_size=268435456 -key_dist_a=0.002312 -key_dist_b=0.3467 -keyrange_dist_a=14.18 -keyrange_dist_b=-2.917 -keyrange_dist_c=0.0164 -keyrange_dist_d=-0.08082 -keyrange_num=30 -value_k=0.2615 -value_sigma=25.45 -iter_k=2.517 -iter_sigma=14.236 -mix_get_ratio=0.85 -mix_put_ratio=0.14 -mix_seek_ratio=0.01 -sine_mix_rate_interval_milliseconds=5000 -sine_a=350 -sine_b=0.0105 -sine_d=50000 --perf_level=2 -reads=1000000 -num=5000000 -key_size=48`
Pull Request resolved: https://github.com/facebook/rocksdb/pull/5953
Test Plan: run db_bench with different parameters and checked the results.
Differential Revision: D18053527
Pulled By: zhichao-cao
fbshipit-source-id: 171f8b3142bd76462f1967c58345ad7e4f84bab7
5 years ago
|
|
|
bool use_prefix_modeling = false;
|
|
|
|
|
bool use_random_modeling = false;
|
Workload generator (Mixgraph) based on prefix hotness (#5953)
Summary:
In the previous PR https://github.com/facebook/rocksdb/issues/4788, user can use db_bench mix_graph option to generate the workload that is from the social graph. The key is generated based on the key access hotness. In this PR, user can further model the key-range hotness and fit those to two-term-exponential distribution. First, user cuts the whole key space into small key ranges (e.g., key-ranges are the same size and the key-range number is the number of SST files). Then, user calculates the average access count per key of each key-range as the key-range hotness. Next, user fits the key-range hotness to two-term-exponential distribution (f(x) = f(x) = a*exp(b*x) + c*exp(d*x)) and generate the value of a, b, c, and d. They are the parameters in db_bench: prefix_dist_a, prefix_dist_b, prefix_dist_c, and prefix_dist_d. Finally, user can run db_bench by specify the parameters.
For example:
`./db_bench --benchmarks="mixgraph" -use_direct_io_for_flush_and_compaction=true -use_direct_reads=true -cache_size=268435456 -key_dist_a=0.002312 -key_dist_b=0.3467 -keyrange_dist_a=14.18 -keyrange_dist_b=-2.917 -keyrange_dist_c=0.0164 -keyrange_dist_d=-0.08082 -keyrange_num=30 -value_k=0.2615 -value_sigma=25.45 -iter_k=2.517 -iter_sigma=14.236 -mix_get_ratio=0.85 -mix_put_ratio=0.14 -mix_seek_ratio=0.01 -sine_mix_rate_interval_milliseconds=5000 -sine_a=350 -sine_b=0.0105 -sine_d=50000 --perf_level=2 -reads=1000000 -num=5000000 -key_size=48`
Pull Request resolved: https://github.com/facebook/rocksdb/pull/5953
Test Plan: run db_bench with different parameters and checked the results.
Differential Revision: D18053527
Pulled By: zhichao-cao
fbshipit-source-id: 171f8b3142bd76462f1967c58345ad7e4f84bab7
5 years ago
|
|
|
GenerateTwoTermExpKeys gen_exp;
|
|
|
|
|
std::vector<double> ratio{FLAGS_mix_get_ratio, FLAGS_mix_put_ratio,
|
|
|
|
|
FLAGS_mix_seek_ratio};
|
|
|
|
|
char value_buffer[default_value_max];
|
Generate mixed workload with Get, Put, Seek in db_bench (#4788)
Summary:
Based on the specific workload models (key access distribution, value size distribution, and iterator scan length distribution, the QPS variation), the MixGraph benchmark generate the synthetic workload according to these distributions which can reflect the real-world workload characteristics.
After user enable the tracing function, they will get the trace file. By analyzing the trace file with the trace_analyzer tool, user can generate a set of statistic data files including. The *_accessed_key_stats.txt, *-accessed_value_size_distribution.txt, *-iterator_length_distribution.txt, and *-qps_stats.txt are mainly used to fit the Matlab model fitting. After that, user can get the parameters of the workload distributions (the modeling details are described: [here](https://github.com/facebook/rocksdb/wiki/RocksDB-Trace%2C-Replay%2C-and-Analyzer))
The key access distribution follows the The two-term power model. The probability density function is: `f(x) = ax^{b}+c`. The corresponding parameters are key_dist_a, key_dist_b, and key_dist_c in db_bench
For the value size distribution and iterator scan length distribution, they both follow the Generalized Pareto Distribution. The probability density function is `f(x) = (1/sigma)(1+k*(x-theta)/sigma))^{-1-1/k)`. The parameters are: value_k, value_theta, value_sigma and iter_k, iter_theta, iter_sigma. For more information about the Generalized Pareto Distribution, users can find the [wiki](https://en.wikipedia.org/wiki/Generalized_Pareto_distribution) and [Matalb page](https://www.mathworks.com/help/stats/generalized-pareto-distribution.html)
As for the QPS, it follows the diurnal pattern. So Sine is a good model to fit it. `F(x) = sine_a*sin(sine_b*x + sine_c) + sine_d`. The trace_will tell you the average QPS in the print out resutls, which is sine_d. After user fit the "*-qps_stats.txt" to the Matlab model, user can get the sine_a, sine_b, and sine_c. By using the 4 parameters, user can control the QPS variation including the period, average, changes.
To use the bench mark, user can indicate the following parameters as examples:
```
-benchmarks="mixgraph" -key_dist_a=0.002312 -key_dist_b=0.3467 -value_k=0.9233 -value_sigma=226.4092 -iter_k=2.517 -iter_sigma=14.236 -mix_get_ratio=0.7 -mix_put_ratio=0.25 -mix_seek_ratio=0.05 -sine_mix_rate_interval_milliseconds=500 -sine_a=15000 -sine_b=1 -sine_d=20000
```
Pull Request resolved: https://github.com/facebook/rocksdb/pull/4788
Differential Revision: D13573940
Pulled By: sagar0
fbshipit-source-id: e184c27e07b4f1bc0b436c2be36c5090c1fb0222
6 years ago
|
|
|
QueryDecider query;
|
|
|
|
|
RandomGenerator gen;
|
|
|
|
|
Status s;
|
|
|
|
|
if (value_max > FLAGS_mix_max_value_size) {
|
|
|
|
|
value_max = FLAGS_mix_max_value_size;
|
|
|
|
|
}
|
Generate mixed workload with Get, Put, Seek in db_bench (#4788)
Summary:
Based on the specific workload models (key access distribution, value size distribution, and iterator scan length distribution, the QPS variation), the MixGraph benchmark generate the synthetic workload according to these distributions which can reflect the real-world workload characteristics.
After user enable the tracing function, they will get the trace file. By analyzing the trace file with the trace_analyzer tool, user can generate a set of statistic data files including. The *_accessed_key_stats.txt, *-accessed_value_size_distribution.txt, *-iterator_length_distribution.txt, and *-qps_stats.txt are mainly used to fit the Matlab model fitting. After that, user can get the parameters of the workload distributions (the modeling details are described: [here](https://github.com/facebook/rocksdb/wiki/RocksDB-Trace%2C-Replay%2C-and-Analyzer))
The key access distribution follows the The two-term power model. The probability density function is: `f(x) = ax^{b}+c`. The corresponding parameters are key_dist_a, key_dist_b, and key_dist_c in db_bench
For the value size distribution and iterator scan length distribution, they both follow the Generalized Pareto Distribution. The probability density function is `f(x) = (1/sigma)(1+k*(x-theta)/sigma))^{-1-1/k)`. The parameters are: value_k, value_theta, value_sigma and iter_k, iter_theta, iter_sigma. For more information about the Generalized Pareto Distribution, users can find the [wiki](https://en.wikipedia.org/wiki/Generalized_Pareto_distribution) and [Matalb page](https://www.mathworks.com/help/stats/generalized-pareto-distribution.html)
As for the QPS, it follows the diurnal pattern. So Sine is a good model to fit it. `F(x) = sine_a*sin(sine_b*x + sine_c) + sine_d`. The trace_will tell you the average QPS in the print out resutls, which is sine_d. After user fit the "*-qps_stats.txt" to the Matlab model, user can get the sine_a, sine_b, and sine_c. By using the 4 parameters, user can control the QPS variation including the period, average, changes.
To use the bench mark, user can indicate the following parameters as examples:
```
-benchmarks="mixgraph" -key_dist_a=0.002312 -key_dist_b=0.3467 -value_k=0.9233 -value_sigma=226.4092 -iter_k=2.517 -iter_sigma=14.236 -mix_get_ratio=0.7 -mix_put_ratio=0.25 -mix_seek_ratio=0.05 -sine_mix_rate_interval_milliseconds=500 -sine_a=15000 -sine_b=1 -sine_d=20000
```
Pull Request resolved: https://github.com/facebook/rocksdb/pull/4788
Differential Revision: D13573940
Pulled By: sagar0
fbshipit-source-id: e184c27e07b4f1bc0b436c2be36c5090c1fb0222
6 years ago
|
|
|
|
|
|
|
|
std::unique_ptr<const char[]> key_guard;
|
|
|
|
|
Slice key = AllocateKey(&key_guard);
|
|
|
|
|
PinnableSlice pinnable_val;
|
|
|
|
|
query.Initiate(ratio);
|
|
|
|
|
|
|
|
|
|
// the limit of qps initiation
|
|
|
|
|
if (FLAGS_sine_mix_rate) {
|
|
|
|
|
thread->shared->read_rate_limiter.reset(
|
|
|
|
|
NewGenericRateLimiter(static_cast<int64_t>(read_rate)));
|
Generate mixed workload with Get, Put, Seek in db_bench (#4788)
Summary:
Based on the specific workload models (key access distribution, value size distribution, and iterator scan length distribution, the QPS variation), the MixGraph benchmark generate the synthetic workload according to these distributions which can reflect the real-world workload characteristics.
After user enable the tracing function, they will get the trace file. By analyzing the trace file with the trace_analyzer tool, user can generate a set of statistic data files including. The *_accessed_key_stats.txt, *-accessed_value_size_distribution.txt, *-iterator_length_distribution.txt, and *-qps_stats.txt are mainly used to fit the Matlab model fitting. After that, user can get the parameters of the workload distributions (the modeling details are described: [here](https://github.com/facebook/rocksdb/wiki/RocksDB-Trace%2C-Replay%2C-and-Analyzer))
The key access distribution follows the The two-term power model. The probability density function is: `f(x) = ax^{b}+c`. The corresponding parameters are key_dist_a, key_dist_b, and key_dist_c in db_bench
For the value size distribution and iterator scan length distribution, they both follow the Generalized Pareto Distribution. The probability density function is `f(x) = (1/sigma)(1+k*(x-theta)/sigma))^{-1-1/k)`. The parameters are: value_k, value_theta, value_sigma and iter_k, iter_theta, iter_sigma. For more information about the Generalized Pareto Distribution, users can find the [wiki](https://en.wikipedia.org/wiki/Generalized_Pareto_distribution) and [Matalb page](https://www.mathworks.com/help/stats/generalized-pareto-distribution.html)
As for the QPS, it follows the diurnal pattern. So Sine is a good model to fit it. `F(x) = sine_a*sin(sine_b*x + sine_c) + sine_d`. The trace_will tell you the average QPS in the print out resutls, which is sine_d. After user fit the "*-qps_stats.txt" to the Matlab model, user can get the sine_a, sine_b, and sine_c. By using the 4 parameters, user can control the QPS variation including the period, average, changes.
To use the bench mark, user can indicate the following parameters as examples:
```
-benchmarks="mixgraph" -key_dist_a=0.002312 -key_dist_b=0.3467 -value_k=0.9233 -value_sigma=226.4092 -iter_k=2.517 -iter_sigma=14.236 -mix_get_ratio=0.7 -mix_put_ratio=0.25 -mix_seek_ratio=0.05 -sine_mix_rate_interval_milliseconds=500 -sine_a=15000 -sine_b=1 -sine_d=20000
```
Pull Request resolved: https://github.com/facebook/rocksdb/pull/4788
Differential Revision: D13573940
Pulled By: sagar0
fbshipit-source-id: e184c27e07b4f1bc0b436c2be36c5090c1fb0222
6 years ago
|
|
|
thread->shared->write_rate_limiter.reset(
|
|
|
|
|
NewGenericRateLimiter(static_cast<int64_t>(write_rate)));
|
Generate mixed workload with Get, Put, Seek in db_bench (#4788)
Summary:
Based on the specific workload models (key access distribution, value size distribution, and iterator scan length distribution, the QPS variation), the MixGraph benchmark generate the synthetic workload according to these distributions which can reflect the real-world workload characteristics.
After user enable the tracing function, they will get the trace file. By analyzing the trace file with the trace_analyzer tool, user can generate a set of statistic data files including. The *_accessed_key_stats.txt, *-accessed_value_size_distribution.txt, *-iterator_length_distribution.txt, and *-qps_stats.txt are mainly used to fit the Matlab model fitting. After that, user can get the parameters of the workload distributions (the modeling details are described: [here](https://github.com/facebook/rocksdb/wiki/RocksDB-Trace%2C-Replay%2C-and-Analyzer))
The key access distribution follows the The two-term power model. The probability density function is: `f(x) = ax^{b}+c`. The corresponding parameters are key_dist_a, key_dist_b, and key_dist_c in db_bench
For the value size distribution and iterator scan length distribution, they both follow the Generalized Pareto Distribution. The probability density function is `f(x) = (1/sigma)(1+k*(x-theta)/sigma))^{-1-1/k)`. The parameters are: value_k, value_theta, value_sigma and iter_k, iter_theta, iter_sigma. For more information about the Generalized Pareto Distribution, users can find the [wiki](https://en.wikipedia.org/wiki/Generalized_Pareto_distribution) and [Matalb page](https://www.mathworks.com/help/stats/generalized-pareto-distribution.html)
As for the QPS, it follows the diurnal pattern. So Sine is a good model to fit it. `F(x) = sine_a*sin(sine_b*x + sine_c) + sine_d`. The trace_will tell you the average QPS in the print out resutls, which is sine_d. After user fit the "*-qps_stats.txt" to the Matlab model, user can get the sine_a, sine_b, and sine_c. By using the 4 parameters, user can control the QPS variation including the period, average, changes.
To use the bench mark, user can indicate the following parameters as examples:
```
-benchmarks="mixgraph" -key_dist_a=0.002312 -key_dist_b=0.3467 -value_k=0.9233 -value_sigma=226.4092 -iter_k=2.517 -iter_sigma=14.236 -mix_get_ratio=0.7 -mix_put_ratio=0.25 -mix_seek_ratio=0.05 -sine_mix_rate_interval_milliseconds=500 -sine_a=15000 -sine_b=1 -sine_d=20000
```
Pull Request resolved: https://github.com/facebook/rocksdb/pull/4788
Differential Revision: D13573940
Pulled By: sagar0
fbshipit-source-id: e184c27e07b4f1bc0b436c2be36c5090c1fb0222
6 years ago
|
|
|
}
|
|
|
|
|
|
Workload generator (Mixgraph) based on prefix hotness (#5953)
Summary:
In the previous PR https://github.com/facebook/rocksdb/issues/4788, user can use db_bench mix_graph option to generate the workload that is from the social graph. The key is generated based on the key access hotness. In this PR, user can further model the key-range hotness and fit those to two-term-exponential distribution. First, user cuts the whole key space into small key ranges (e.g., key-ranges are the same size and the key-range number is the number of SST files). Then, user calculates the average access count per key of each key-range as the key-range hotness. Next, user fits the key-range hotness to two-term-exponential distribution (f(x) = f(x) = a*exp(b*x) + c*exp(d*x)) and generate the value of a, b, c, and d. They are the parameters in db_bench: prefix_dist_a, prefix_dist_b, prefix_dist_c, and prefix_dist_d. Finally, user can run db_bench by specify the parameters.
For example:
`./db_bench --benchmarks="mixgraph" -use_direct_io_for_flush_and_compaction=true -use_direct_reads=true -cache_size=268435456 -key_dist_a=0.002312 -key_dist_b=0.3467 -keyrange_dist_a=14.18 -keyrange_dist_b=-2.917 -keyrange_dist_c=0.0164 -keyrange_dist_d=-0.08082 -keyrange_num=30 -value_k=0.2615 -value_sigma=25.45 -iter_k=2.517 -iter_sigma=14.236 -mix_get_ratio=0.85 -mix_put_ratio=0.14 -mix_seek_ratio=0.01 -sine_mix_rate_interval_milliseconds=5000 -sine_a=350 -sine_b=0.0105 -sine_d=50000 --perf_level=2 -reads=1000000 -num=5000000 -key_size=48`
Pull Request resolved: https://github.com/facebook/rocksdb/pull/5953
Test Plan: run db_bench with different parameters and checked the results.
Differential Revision: D18053527
Pulled By: zhichao-cao
fbshipit-source-id: 171f8b3142bd76462f1967c58345ad7e4f84bab7
5 years ago
|
|
|
// Decide if user wants to use prefix based key generation
|
|
|
|
|
if (FLAGS_keyrange_dist_a != 0.0 || FLAGS_keyrange_dist_b != 0.0 ||
|
|
|
|
|
FLAGS_keyrange_dist_c != 0.0 || FLAGS_keyrange_dist_d != 0.0) {
|
|
|
|
|
use_prefix_modeling = true;
|
|
|
|
|
gen_exp.InitiateExpDistribution(
|
|
|
|
|
FLAGS_num, FLAGS_keyrange_dist_a, FLAGS_keyrange_dist_b,
|
|
|
|
|
FLAGS_keyrange_dist_c, FLAGS_keyrange_dist_d);
|
|
|
|
|
}
|
|
|
|
|
if (FLAGS_key_dist_a == 0 || FLAGS_key_dist_b == 0) {
|
|
|
|
|
use_random_modeling = true;
|
|
|
|
|
}
|
Workload generator (Mixgraph) based on prefix hotness (#5953)
Summary:
In the previous PR https://github.com/facebook/rocksdb/issues/4788, user can use db_bench mix_graph option to generate the workload that is from the social graph. The key is generated based on the key access hotness. In this PR, user can further model the key-range hotness and fit those to two-term-exponential distribution. First, user cuts the whole key space into small key ranges (e.g., key-ranges are the same size and the key-range number is the number of SST files). Then, user calculates the average access count per key of each key-range as the key-range hotness. Next, user fits the key-range hotness to two-term-exponential distribution (f(x) = f(x) = a*exp(b*x) + c*exp(d*x)) and generate the value of a, b, c, and d. They are the parameters in db_bench: prefix_dist_a, prefix_dist_b, prefix_dist_c, and prefix_dist_d. Finally, user can run db_bench by specify the parameters.
For example:
`./db_bench --benchmarks="mixgraph" -use_direct_io_for_flush_and_compaction=true -use_direct_reads=true -cache_size=268435456 -key_dist_a=0.002312 -key_dist_b=0.3467 -keyrange_dist_a=14.18 -keyrange_dist_b=-2.917 -keyrange_dist_c=0.0164 -keyrange_dist_d=-0.08082 -keyrange_num=30 -value_k=0.2615 -value_sigma=25.45 -iter_k=2.517 -iter_sigma=14.236 -mix_get_ratio=0.85 -mix_put_ratio=0.14 -mix_seek_ratio=0.01 -sine_mix_rate_interval_milliseconds=5000 -sine_a=350 -sine_b=0.0105 -sine_d=50000 --perf_level=2 -reads=1000000 -num=5000000 -key_size=48`
Pull Request resolved: https://github.com/facebook/rocksdb/pull/5953
Test Plan: run db_bench with different parameters and checked the results.
Differential Revision: D18053527
Pulled By: zhichao-cao
fbshipit-source-id: 171f8b3142bd76462f1967c58345ad7e4f84bab7
5 years ago
|
|
|
|
Generate mixed workload with Get, Put, Seek in db_bench (#4788)
Summary:
Based on the specific workload models (key access distribution, value size distribution, and iterator scan length distribution, the QPS variation), the MixGraph benchmark generate the synthetic workload according to these distributions which can reflect the real-world workload characteristics.
After user enable the tracing function, they will get the trace file. By analyzing the trace file with the trace_analyzer tool, user can generate a set of statistic data files including. The *_accessed_key_stats.txt, *-accessed_value_size_distribution.txt, *-iterator_length_distribution.txt, and *-qps_stats.txt are mainly used to fit the Matlab model fitting. After that, user can get the parameters of the workload distributions (the modeling details are described: [here](https://github.com/facebook/rocksdb/wiki/RocksDB-Trace%2C-Replay%2C-and-Analyzer))
The key access distribution follows the The two-term power model. The probability density function is: `f(x) = ax^{b}+c`. The corresponding parameters are key_dist_a, key_dist_b, and key_dist_c in db_bench
For the value size distribution and iterator scan length distribution, they both follow the Generalized Pareto Distribution. The probability density function is `f(x) = (1/sigma)(1+k*(x-theta)/sigma))^{-1-1/k)`. The parameters are: value_k, value_theta, value_sigma and iter_k, iter_theta, iter_sigma. For more information about the Generalized Pareto Distribution, users can find the [wiki](https://en.wikipedia.org/wiki/Generalized_Pareto_distribution) and [Matalb page](https://www.mathworks.com/help/stats/generalized-pareto-distribution.html)
As for the QPS, it follows the diurnal pattern. So Sine is a good model to fit it. `F(x) = sine_a*sin(sine_b*x + sine_c) + sine_d`. The trace_will tell you the average QPS in the print out resutls, which is sine_d. After user fit the "*-qps_stats.txt" to the Matlab model, user can get the sine_a, sine_b, and sine_c. By using the 4 parameters, user can control the QPS variation including the period, average, changes.
To use the bench mark, user can indicate the following parameters as examples:
```
-benchmarks="mixgraph" -key_dist_a=0.002312 -key_dist_b=0.3467 -value_k=0.9233 -value_sigma=226.4092 -iter_k=2.517 -iter_sigma=14.236 -mix_get_ratio=0.7 -mix_put_ratio=0.25 -mix_seek_ratio=0.05 -sine_mix_rate_interval_milliseconds=500 -sine_a=15000 -sine_b=1 -sine_d=20000
```
Pull Request resolved: https://github.com/facebook/rocksdb/pull/4788
Differential Revision: D13573940
Pulled By: sagar0
fbshipit-source-id: e184c27e07b4f1bc0b436c2be36c5090c1fb0222
6 years ago
|
|
|
Duration duration(FLAGS_duration, reads_);
|
|
|
|
|
while (!duration.Done(1)) {
|
|
|
|
|
DBWithColumnFamilies* db_with_cfh = SelectDBWithCfh(thread);
|
Workload generator (Mixgraph) based on prefix hotness (#5953)
Summary:
In the previous PR https://github.com/facebook/rocksdb/issues/4788, user can use db_bench mix_graph option to generate the workload that is from the social graph. The key is generated based on the key access hotness. In this PR, user can further model the key-range hotness and fit those to two-term-exponential distribution. First, user cuts the whole key space into small key ranges (e.g., key-ranges are the same size and the key-range number is the number of SST files). Then, user calculates the average access count per key of each key-range as the key-range hotness. Next, user fits the key-range hotness to two-term-exponential distribution (f(x) = f(x) = a*exp(b*x) + c*exp(d*x)) and generate the value of a, b, c, and d. They are the parameters in db_bench: prefix_dist_a, prefix_dist_b, prefix_dist_c, and prefix_dist_d. Finally, user can run db_bench by specify the parameters.
For example:
`./db_bench --benchmarks="mixgraph" -use_direct_io_for_flush_and_compaction=true -use_direct_reads=true -cache_size=268435456 -key_dist_a=0.002312 -key_dist_b=0.3467 -keyrange_dist_a=14.18 -keyrange_dist_b=-2.917 -keyrange_dist_c=0.0164 -keyrange_dist_d=-0.08082 -keyrange_num=30 -value_k=0.2615 -value_sigma=25.45 -iter_k=2.517 -iter_sigma=14.236 -mix_get_ratio=0.85 -mix_put_ratio=0.14 -mix_seek_ratio=0.01 -sine_mix_rate_interval_milliseconds=5000 -sine_a=350 -sine_b=0.0105 -sine_d=50000 --perf_level=2 -reads=1000000 -num=5000000 -key_size=48`
Pull Request resolved: https://github.com/facebook/rocksdb/pull/5953
Test Plan: run db_bench with different parameters and checked the results.
Differential Revision: D18053527
Pulled By: zhichao-cao
fbshipit-source-id: 171f8b3142bd76462f1967c58345ad7e4f84bab7
5 years ago
|
|
|
int64_t ini_rand, rand_v, key_rand, key_seed;
|
|
|
|
|
ini_rand = GetRandomKey(&thread->rand);
|
|
|
|
|
rand_v = ini_rand % FLAGS_num;
|
Generate mixed workload with Get, Put, Seek in db_bench (#4788)
Summary:
Based on the specific workload models (key access distribution, value size distribution, and iterator scan length distribution, the QPS variation), the MixGraph benchmark generate the synthetic workload according to these distributions which can reflect the real-world workload characteristics.
After user enable the tracing function, they will get the trace file. By analyzing the trace file with the trace_analyzer tool, user can generate a set of statistic data files including. The *_accessed_key_stats.txt, *-accessed_value_size_distribution.txt, *-iterator_length_distribution.txt, and *-qps_stats.txt are mainly used to fit the Matlab model fitting. After that, user can get the parameters of the workload distributions (the modeling details are described: [here](https://github.com/facebook/rocksdb/wiki/RocksDB-Trace%2C-Replay%2C-and-Analyzer))
The key access distribution follows the The two-term power model. The probability density function is: `f(x) = ax^{b}+c`. The corresponding parameters are key_dist_a, key_dist_b, and key_dist_c in db_bench
For the value size distribution and iterator scan length distribution, they both follow the Generalized Pareto Distribution. The probability density function is `f(x) = (1/sigma)(1+k*(x-theta)/sigma))^{-1-1/k)`. The parameters are: value_k, value_theta, value_sigma and iter_k, iter_theta, iter_sigma. For more information about the Generalized Pareto Distribution, users can find the [wiki](https://en.wikipedia.org/wiki/Generalized_Pareto_distribution) and [Matalb page](https://www.mathworks.com/help/stats/generalized-pareto-distribution.html)
As for the QPS, it follows the diurnal pattern. So Sine is a good model to fit it. `F(x) = sine_a*sin(sine_b*x + sine_c) + sine_d`. The trace_will tell you the average QPS in the print out resutls, which is sine_d. After user fit the "*-qps_stats.txt" to the Matlab model, user can get the sine_a, sine_b, and sine_c. By using the 4 parameters, user can control the QPS variation including the period, average, changes.
To use the bench mark, user can indicate the following parameters as examples:
```
-benchmarks="mixgraph" -key_dist_a=0.002312 -key_dist_b=0.3467 -value_k=0.9233 -value_sigma=226.4092 -iter_k=2.517 -iter_sigma=14.236 -mix_get_ratio=0.7 -mix_put_ratio=0.25 -mix_seek_ratio=0.05 -sine_mix_rate_interval_milliseconds=500 -sine_a=15000 -sine_b=1 -sine_d=20000
```
Pull Request resolved: https://github.com/facebook/rocksdb/pull/4788
Differential Revision: D13573940
Pulled By: sagar0
fbshipit-source-id: e184c27e07b4f1bc0b436c2be36c5090c1fb0222
6 years ago
|
|
|
double u = static_cast<double>(rand_v) / FLAGS_num;
|
Workload generator (Mixgraph) based on prefix hotness (#5953)
Summary:
In the previous PR https://github.com/facebook/rocksdb/issues/4788, user can use db_bench mix_graph option to generate the workload that is from the social graph. The key is generated based on the key access hotness. In this PR, user can further model the key-range hotness and fit those to two-term-exponential distribution. First, user cuts the whole key space into small key ranges (e.g., key-ranges are the same size and the key-range number is the number of SST files). Then, user calculates the average access count per key of each key-range as the key-range hotness. Next, user fits the key-range hotness to two-term-exponential distribution (f(x) = f(x) = a*exp(b*x) + c*exp(d*x)) and generate the value of a, b, c, and d. They are the parameters in db_bench: prefix_dist_a, prefix_dist_b, prefix_dist_c, and prefix_dist_d. Finally, user can run db_bench by specify the parameters.
For example:
`./db_bench --benchmarks="mixgraph" -use_direct_io_for_flush_and_compaction=true -use_direct_reads=true -cache_size=268435456 -key_dist_a=0.002312 -key_dist_b=0.3467 -keyrange_dist_a=14.18 -keyrange_dist_b=-2.917 -keyrange_dist_c=0.0164 -keyrange_dist_d=-0.08082 -keyrange_num=30 -value_k=0.2615 -value_sigma=25.45 -iter_k=2.517 -iter_sigma=14.236 -mix_get_ratio=0.85 -mix_put_ratio=0.14 -mix_seek_ratio=0.01 -sine_mix_rate_interval_milliseconds=5000 -sine_a=350 -sine_b=0.0105 -sine_d=50000 --perf_level=2 -reads=1000000 -num=5000000 -key_size=48`
Pull Request resolved: https://github.com/facebook/rocksdb/pull/5953
Test Plan: run db_bench with different parameters and checked the results.
Differential Revision: D18053527
Pulled By: zhichao-cao
fbshipit-source-id: 171f8b3142bd76462f1967c58345ad7e4f84bab7
5 years ago
|
|
|
|
|
|
|
|
// Generate the keyID based on the key hotness and prefix hotness
|
|
|
|
|
if (use_random_modeling) {
|
|
|
|
|
key_rand = ini_rand;
|
|
|
|
|
} else if (use_prefix_modeling) {
|
Workload generator (Mixgraph) based on prefix hotness (#5953)
Summary:
In the previous PR https://github.com/facebook/rocksdb/issues/4788, user can use db_bench mix_graph option to generate the workload that is from the social graph. The key is generated based on the key access hotness. In this PR, user can further model the key-range hotness and fit those to two-term-exponential distribution. First, user cuts the whole key space into small key ranges (e.g., key-ranges are the same size and the key-range number is the number of SST files). Then, user calculates the average access count per key of each key-range as the key-range hotness. Next, user fits the key-range hotness to two-term-exponential distribution (f(x) = f(x) = a*exp(b*x) + c*exp(d*x)) and generate the value of a, b, c, and d. They are the parameters in db_bench: prefix_dist_a, prefix_dist_b, prefix_dist_c, and prefix_dist_d. Finally, user can run db_bench by specify the parameters.
For example:
`./db_bench --benchmarks="mixgraph" -use_direct_io_for_flush_and_compaction=true -use_direct_reads=true -cache_size=268435456 -key_dist_a=0.002312 -key_dist_b=0.3467 -keyrange_dist_a=14.18 -keyrange_dist_b=-2.917 -keyrange_dist_c=0.0164 -keyrange_dist_d=-0.08082 -keyrange_num=30 -value_k=0.2615 -value_sigma=25.45 -iter_k=2.517 -iter_sigma=14.236 -mix_get_ratio=0.85 -mix_put_ratio=0.14 -mix_seek_ratio=0.01 -sine_mix_rate_interval_milliseconds=5000 -sine_a=350 -sine_b=0.0105 -sine_d=50000 --perf_level=2 -reads=1000000 -num=5000000 -key_size=48`
Pull Request resolved: https://github.com/facebook/rocksdb/pull/5953
Test Plan: run db_bench with different parameters and checked the results.
Differential Revision: D18053527
Pulled By: zhichao-cao
fbshipit-source-id: 171f8b3142bd76462f1967c58345ad7e4f84bab7
5 years ago
|
|
|
key_rand =
|
|
|
|
|
gen_exp.DistGetKeyID(ini_rand, FLAGS_key_dist_a, FLAGS_key_dist_b);
|
|
|
|
|
} else {
|
|
|
|
|
key_seed = PowerCdfInversion(u, FLAGS_key_dist_a, FLAGS_key_dist_b);
|
|
|
|
|
Random64 rand(key_seed);
|
|
|
|
|
key_rand = static_cast<int64_t>(rand.Next()) % FLAGS_num;
|
|
|
|
|
}
|
Generate mixed workload with Get, Put, Seek in db_bench (#4788)
Summary:
Based on the specific workload models (key access distribution, value size distribution, and iterator scan length distribution, the QPS variation), the MixGraph benchmark generate the synthetic workload according to these distributions which can reflect the real-world workload characteristics.
After user enable the tracing function, they will get the trace file. By analyzing the trace file with the trace_analyzer tool, user can generate a set of statistic data files including. The *_accessed_key_stats.txt, *-accessed_value_size_distribution.txt, *-iterator_length_distribution.txt, and *-qps_stats.txt are mainly used to fit the Matlab model fitting. After that, user can get the parameters of the workload distributions (the modeling details are described: [here](https://github.com/facebook/rocksdb/wiki/RocksDB-Trace%2C-Replay%2C-and-Analyzer))
The key access distribution follows the The two-term power model. The probability density function is: `f(x) = ax^{b}+c`. The corresponding parameters are key_dist_a, key_dist_b, and key_dist_c in db_bench
For the value size distribution and iterator scan length distribution, they both follow the Generalized Pareto Distribution. The probability density function is `f(x) = (1/sigma)(1+k*(x-theta)/sigma))^{-1-1/k)`. The parameters are: value_k, value_theta, value_sigma and iter_k, iter_theta, iter_sigma. For more information about the Generalized Pareto Distribution, users can find the [wiki](https://en.wikipedia.org/wiki/Generalized_Pareto_distribution) and [Matalb page](https://www.mathworks.com/help/stats/generalized-pareto-distribution.html)
As for the QPS, it follows the diurnal pattern. So Sine is a good model to fit it. `F(x) = sine_a*sin(sine_b*x + sine_c) + sine_d`. The trace_will tell you the average QPS in the print out resutls, which is sine_d. After user fit the "*-qps_stats.txt" to the Matlab model, user can get the sine_a, sine_b, and sine_c. By using the 4 parameters, user can control the QPS variation including the period, average, changes.
To use the bench mark, user can indicate the following parameters as examples:
```
-benchmarks="mixgraph" -key_dist_a=0.002312 -key_dist_b=0.3467 -value_k=0.9233 -value_sigma=226.4092 -iter_k=2.517 -iter_sigma=14.236 -mix_get_ratio=0.7 -mix_put_ratio=0.25 -mix_seek_ratio=0.05 -sine_mix_rate_interval_milliseconds=500 -sine_a=15000 -sine_b=1 -sine_d=20000
```
Pull Request resolved: https://github.com/facebook/rocksdb/pull/4788
Differential Revision: D13573940
Pulled By: sagar0
fbshipit-source-id: e184c27e07b4f1bc0b436c2be36c5090c1fb0222
6 years ago
|
|
|
GenerateKeyFromInt(key_rand, FLAGS_num, &key);
|
|
|
|
|
int query_type = query.GetType(rand_v);
|
|
|
|
|
|
|
|
|
|
// change the qps
|
|
|
|
|
uint64_t now = FLAGS_env->NowMicros();
|
|
|
|
|
uint64_t usecs_since_last;
|
|
|
|
|
if (now > thread->stats.GetSineInterval()) {
|
|
|
|
|
usecs_since_last = now - thread->stats.GetSineInterval();
|
|
|
|
|
} else {
|
|
|
|
|
usecs_since_last = 0;
|
|
|
|
|
}
|
|
|
|
|
|
|
|
|
|
if (FLAGS_sine_mix_rate &&
|
|
|
|
|
usecs_since_last >
|
|
|
|
|
(FLAGS_sine_mix_rate_interval_milliseconds * uint64_t{1000})) {
|
Generate mixed workload with Get, Put, Seek in db_bench (#4788)
Summary:
Based on the specific workload models (key access distribution, value size distribution, and iterator scan length distribution, the QPS variation), the MixGraph benchmark generate the synthetic workload according to these distributions which can reflect the real-world workload characteristics.
After user enable the tracing function, they will get the trace file. By analyzing the trace file with the trace_analyzer tool, user can generate a set of statistic data files including. The *_accessed_key_stats.txt, *-accessed_value_size_distribution.txt, *-iterator_length_distribution.txt, and *-qps_stats.txt are mainly used to fit the Matlab model fitting. After that, user can get the parameters of the workload distributions (the modeling details are described: [here](https://github.com/facebook/rocksdb/wiki/RocksDB-Trace%2C-Replay%2C-and-Analyzer))
The key access distribution follows the The two-term power model. The probability density function is: `f(x) = ax^{b}+c`. The corresponding parameters are key_dist_a, key_dist_b, and key_dist_c in db_bench
For the value size distribution and iterator scan length distribution, they both follow the Generalized Pareto Distribution. The probability density function is `f(x) = (1/sigma)(1+k*(x-theta)/sigma))^{-1-1/k)`. The parameters are: value_k, value_theta, value_sigma and iter_k, iter_theta, iter_sigma. For more information about the Generalized Pareto Distribution, users can find the [wiki](https://en.wikipedia.org/wiki/Generalized_Pareto_distribution) and [Matalb page](https://www.mathworks.com/help/stats/generalized-pareto-distribution.html)
As for the QPS, it follows the diurnal pattern. So Sine is a good model to fit it. `F(x) = sine_a*sin(sine_b*x + sine_c) + sine_d`. The trace_will tell you the average QPS in the print out resutls, which is sine_d. After user fit the "*-qps_stats.txt" to the Matlab model, user can get the sine_a, sine_b, and sine_c. By using the 4 parameters, user can control the QPS variation including the period, average, changes.
To use the bench mark, user can indicate the following parameters as examples:
```
-benchmarks="mixgraph" -key_dist_a=0.002312 -key_dist_b=0.3467 -value_k=0.9233 -value_sigma=226.4092 -iter_k=2.517 -iter_sigma=14.236 -mix_get_ratio=0.7 -mix_put_ratio=0.25 -mix_seek_ratio=0.05 -sine_mix_rate_interval_milliseconds=500 -sine_a=15000 -sine_b=1 -sine_d=20000
```
Pull Request resolved: https://github.com/facebook/rocksdb/pull/4788
Differential Revision: D13573940
Pulled By: sagar0
fbshipit-source-id: e184c27e07b4f1bc0b436c2be36c5090c1fb0222
6 years ago
|
|
|
double usecs_since_start =
|
|
|
|
|
static_cast<double>(now - thread->stats.GetStart());
|
|
|
|
|
thread->stats.ResetSineInterval();
|
|
|
|
|
double mix_rate_with_noise = AddNoise(
|
|
|
|
|
SineRate(usecs_since_start / 1000000.0), FLAGS_sine_mix_rate_noise);
|
|
|
|
|
read_rate = mix_rate_with_noise * (query.ratio_[0] + query.ratio_[2]);
|
|
|
|
|
write_rate = mix_rate_with_noise * query.ratio_[1];
|
Generate mixed workload with Get, Put, Seek in db_bench (#4788)
Summary:
Based on the specific workload models (key access distribution, value size distribution, and iterator scan length distribution, the QPS variation), the MixGraph benchmark generate the synthetic workload according to these distributions which can reflect the real-world workload characteristics.
After user enable the tracing function, they will get the trace file. By analyzing the trace file with the trace_analyzer tool, user can generate a set of statistic data files including. The *_accessed_key_stats.txt, *-accessed_value_size_distribution.txt, *-iterator_length_distribution.txt, and *-qps_stats.txt are mainly used to fit the Matlab model fitting. After that, user can get the parameters of the workload distributions (the modeling details are described: [here](https://github.com/facebook/rocksdb/wiki/RocksDB-Trace%2C-Replay%2C-and-Analyzer))
The key access distribution follows the The two-term power model. The probability density function is: `f(x) = ax^{b}+c`. The corresponding parameters are key_dist_a, key_dist_b, and key_dist_c in db_bench
For the value size distribution and iterator scan length distribution, they both follow the Generalized Pareto Distribution. The probability density function is `f(x) = (1/sigma)(1+k*(x-theta)/sigma))^{-1-1/k)`. The parameters are: value_k, value_theta, value_sigma and iter_k, iter_theta, iter_sigma. For more information about the Generalized Pareto Distribution, users can find the [wiki](https://en.wikipedia.org/wiki/Generalized_Pareto_distribution) and [Matalb page](https://www.mathworks.com/help/stats/generalized-pareto-distribution.html)
As for the QPS, it follows the diurnal pattern. So Sine is a good model to fit it. `F(x) = sine_a*sin(sine_b*x + sine_c) + sine_d`. The trace_will tell you the average QPS in the print out resutls, which is sine_d. After user fit the "*-qps_stats.txt" to the Matlab model, user can get the sine_a, sine_b, and sine_c. By using the 4 parameters, user can control the QPS variation including the period, average, changes.
To use the bench mark, user can indicate the following parameters as examples:
```
-benchmarks="mixgraph" -key_dist_a=0.002312 -key_dist_b=0.3467 -value_k=0.9233 -value_sigma=226.4092 -iter_k=2.517 -iter_sigma=14.236 -mix_get_ratio=0.7 -mix_put_ratio=0.25 -mix_seek_ratio=0.05 -sine_mix_rate_interval_milliseconds=500 -sine_a=15000 -sine_b=1 -sine_d=20000
```
Pull Request resolved: https://github.com/facebook/rocksdb/pull/4788
Differential Revision: D13573940
Pulled By: sagar0
fbshipit-source-id: e184c27e07b4f1bc0b436c2be36c5090c1fb0222
6 years ago
|
|
|
|
|
|
|
|
if (read_rate > 0) {
|
|
|
|
|
thread->shared->read_rate_limiter->SetBytesPerSecond(
|
|
|
|
|
static_cast<int64_t>(read_rate));
|
|
|
|
|
}
|
|
|
|
|
if (write_rate > 0) {
|
|
|
|
|
thread->shared->write_rate_limiter->SetBytesPerSecond(
|
|
|
|
|
static_cast<int64_t>(write_rate));
|
|
|
|
|
}
|
Generate mixed workload with Get, Put, Seek in db_bench (#4788)
Summary:
Based on the specific workload models (key access distribution, value size distribution, and iterator scan length distribution, the QPS variation), the MixGraph benchmark generate the synthetic workload according to these distributions which can reflect the real-world workload characteristics.
After user enable the tracing function, they will get the trace file. By analyzing the trace file with the trace_analyzer tool, user can generate a set of statistic data files including. The *_accessed_key_stats.txt, *-accessed_value_size_distribution.txt, *-iterator_length_distribution.txt, and *-qps_stats.txt are mainly used to fit the Matlab model fitting. After that, user can get the parameters of the workload distributions (the modeling details are described: [here](https://github.com/facebook/rocksdb/wiki/RocksDB-Trace%2C-Replay%2C-and-Analyzer))
The key access distribution follows the The two-term power model. The probability density function is: `f(x) = ax^{b}+c`. The corresponding parameters are key_dist_a, key_dist_b, and key_dist_c in db_bench
For the value size distribution and iterator scan length distribution, they both follow the Generalized Pareto Distribution. The probability density function is `f(x) = (1/sigma)(1+k*(x-theta)/sigma))^{-1-1/k)`. The parameters are: value_k, value_theta, value_sigma and iter_k, iter_theta, iter_sigma. For more information about the Generalized Pareto Distribution, users can find the [wiki](https://en.wikipedia.org/wiki/Generalized_Pareto_distribution) and [Matalb page](https://www.mathworks.com/help/stats/generalized-pareto-distribution.html)
As for the QPS, it follows the diurnal pattern. So Sine is a good model to fit it. `F(x) = sine_a*sin(sine_b*x + sine_c) + sine_d`. The trace_will tell you the average QPS in the print out resutls, which is sine_d. After user fit the "*-qps_stats.txt" to the Matlab model, user can get the sine_a, sine_b, and sine_c. By using the 4 parameters, user can control the QPS variation including the period, average, changes.
To use the bench mark, user can indicate the following parameters as examples:
```
-benchmarks="mixgraph" -key_dist_a=0.002312 -key_dist_b=0.3467 -value_k=0.9233 -value_sigma=226.4092 -iter_k=2.517 -iter_sigma=14.236 -mix_get_ratio=0.7 -mix_put_ratio=0.25 -mix_seek_ratio=0.05 -sine_mix_rate_interval_milliseconds=500 -sine_a=15000 -sine_b=1 -sine_d=20000
```
Pull Request resolved: https://github.com/facebook/rocksdb/pull/4788
Differential Revision: D13573940
Pulled By: sagar0
fbshipit-source-id: e184c27e07b4f1bc0b436c2be36c5090c1fb0222
6 years ago
|
|
|
}
|
|
|
|
|
// Start the query
|
|
|
|
|
if (query_type == 0) {
|
|
|
|
|
// the Get query
|
|
|
|
|
gets++;
|
|
|
|
|
if (FLAGS_num_column_families > 1) {
|
|
|
|
|
s = db_with_cfh->db->Get(read_options_, db_with_cfh->GetCfh(key_rand),
|
|
|
|
|
key, &pinnable_val);
|
Generate mixed workload with Get, Put, Seek in db_bench (#4788)
Summary:
Based on the specific workload models (key access distribution, value size distribution, and iterator scan length distribution, the QPS variation), the MixGraph benchmark generate the synthetic workload according to these distributions which can reflect the real-world workload characteristics.
After user enable the tracing function, they will get the trace file. By analyzing the trace file with the trace_analyzer tool, user can generate a set of statistic data files including. The *_accessed_key_stats.txt, *-accessed_value_size_distribution.txt, *-iterator_length_distribution.txt, and *-qps_stats.txt are mainly used to fit the Matlab model fitting. After that, user can get the parameters of the workload distributions (the modeling details are described: [here](https://github.com/facebook/rocksdb/wiki/RocksDB-Trace%2C-Replay%2C-and-Analyzer))
The key access distribution follows the The two-term power model. The probability density function is: `f(x) = ax^{b}+c`. The corresponding parameters are key_dist_a, key_dist_b, and key_dist_c in db_bench
For the value size distribution and iterator scan length distribution, they both follow the Generalized Pareto Distribution. The probability density function is `f(x) = (1/sigma)(1+k*(x-theta)/sigma))^{-1-1/k)`. The parameters are: value_k, value_theta, value_sigma and iter_k, iter_theta, iter_sigma. For more information about the Generalized Pareto Distribution, users can find the [wiki](https://en.wikipedia.org/wiki/Generalized_Pareto_distribution) and [Matalb page](https://www.mathworks.com/help/stats/generalized-pareto-distribution.html)
As for the QPS, it follows the diurnal pattern. So Sine is a good model to fit it. `F(x) = sine_a*sin(sine_b*x + sine_c) + sine_d`. The trace_will tell you the average QPS in the print out resutls, which is sine_d. After user fit the "*-qps_stats.txt" to the Matlab model, user can get the sine_a, sine_b, and sine_c. By using the 4 parameters, user can control the QPS variation including the period, average, changes.
To use the bench mark, user can indicate the following parameters as examples:
```
-benchmarks="mixgraph" -key_dist_a=0.002312 -key_dist_b=0.3467 -value_k=0.9233 -value_sigma=226.4092 -iter_k=2.517 -iter_sigma=14.236 -mix_get_ratio=0.7 -mix_put_ratio=0.25 -mix_seek_ratio=0.05 -sine_mix_rate_interval_milliseconds=500 -sine_a=15000 -sine_b=1 -sine_d=20000
```
Pull Request resolved: https://github.com/facebook/rocksdb/pull/4788
Differential Revision: D13573940
Pulled By: sagar0
fbshipit-source-id: e184c27e07b4f1bc0b436c2be36c5090c1fb0222
6 years ago
|
|
|
} else {
|
|
|
|
|
pinnable_val.Reset();
|
|
|
|
|
s = db_with_cfh->db->Get(read_options_,
|
Generate mixed workload with Get, Put, Seek in db_bench (#4788)
Summary:
Based on the specific workload models (key access distribution, value size distribution, and iterator scan length distribution, the QPS variation), the MixGraph benchmark generate the synthetic workload according to these distributions which can reflect the real-world workload characteristics.
After user enable the tracing function, they will get the trace file. By analyzing the trace file with the trace_analyzer tool, user can generate a set of statistic data files including. The *_accessed_key_stats.txt, *-accessed_value_size_distribution.txt, *-iterator_length_distribution.txt, and *-qps_stats.txt are mainly used to fit the Matlab model fitting. After that, user can get the parameters of the workload distributions (the modeling details are described: [here](https://github.com/facebook/rocksdb/wiki/RocksDB-Trace%2C-Replay%2C-and-Analyzer))
The key access distribution follows the The two-term power model. The probability density function is: `f(x) = ax^{b}+c`. The corresponding parameters are key_dist_a, key_dist_b, and key_dist_c in db_bench
For the value size distribution and iterator scan length distribution, they both follow the Generalized Pareto Distribution. The probability density function is `f(x) = (1/sigma)(1+k*(x-theta)/sigma))^{-1-1/k)`. The parameters are: value_k, value_theta, value_sigma and iter_k, iter_theta, iter_sigma. For more information about the Generalized Pareto Distribution, users can find the [wiki](https://en.wikipedia.org/wiki/Generalized_Pareto_distribution) and [Matalb page](https://www.mathworks.com/help/stats/generalized-pareto-distribution.html)
As for the QPS, it follows the diurnal pattern. So Sine is a good model to fit it. `F(x) = sine_a*sin(sine_b*x + sine_c) + sine_d`. The trace_will tell you the average QPS in the print out resutls, which is sine_d. After user fit the "*-qps_stats.txt" to the Matlab model, user can get the sine_a, sine_b, and sine_c. By using the 4 parameters, user can control the QPS variation including the period, average, changes.
To use the bench mark, user can indicate the following parameters as examples:
```
-benchmarks="mixgraph" -key_dist_a=0.002312 -key_dist_b=0.3467 -value_k=0.9233 -value_sigma=226.4092 -iter_k=2.517 -iter_sigma=14.236 -mix_get_ratio=0.7 -mix_put_ratio=0.25 -mix_seek_ratio=0.05 -sine_mix_rate_interval_milliseconds=500 -sine_a=15000 -sine_b=1 -sine_d=20000
```
Pull Request resolved: https://github.com/facebook/rocksdb/pull/4788
Differential Revision: D13573940
Pulled By: sagar0
fbshipit-source-id: e184c27e07b4f1bc0b436c2be36c5090c1fb0222
6 years ago
|
|
|
db_with_cfh->db->DefaultColumnFamily(), key,
|
|
|
|
|
&pinnable_val);
|
|
|
|
|
}
|
|
|
|
|
|
|
|
|
|
if (s.ok()) {
|
|
|
|
|
get_found++;
|
Generate mixed workload with Get, Put, Seek in db_bench (#4788)
Summary:
Based on the specific workload models (key access distribution, value size distribution, and iterator scan length distribution, the QPS variation), the MixGraph benchmark generate the synthetic workload according to these distributions which can reflect the real-world workload characteristics.
After user enable the tracing function, they will get the trace file. By analyzing the trace file with the trace_analyzer tool, user can generate a set of statistic data files including. The *_accessed_key_stats.txt, *-accessed_value_size_distribution.txt, *-iterator_length_distribution.txt, and *-qps_stats.txt are mainly used to fit the Matlab model fitting. After that, user can get the parameters of the workload distributions (the modeling details are described: [here](https://github.com/facebook/rocksdb/wiki/RocksDB-Trace%2C-Replay%2C-and-Analyzer))
The key access distribution follows the The two-term power model. The probability density function is: `f(x) = ax^{b}+c`. The corresponding parameters are key_dist_a, key_dist_b, and key_dist_c in db_bench
For the value size distribution and iterator scan length distribution, they both follow the Generalized Pareto Distribution. The probability density function is `f(x) = (1/sigma)(1+k*(x-theta)/sigma))^{-1-1/k)`. The parameters are: value_k, value_theta, value_sigma and iter_k, iter_theta, iter_sigma. For more information about the Generalized Pareto Distribution, users can find the [wiki](https://en.wikipedia.org/wiki/Generalized_Pareto_distribution) and [Matalb page](https://www.mathworks.com/help/stats/generalized-pareto-distribution.html)
As for the QPS, it follows the diurnal pattern. So Sine is a good model to fit it. `F(x) = sine_a*sin(sine_b*x + sine_c) + sine_d`. The trace_will tell you the average QPS in the print out resutls, which is sine_d. After user fit the "*-qps_stats.txt" to the Matlab model, user can get the sine_a, sine_b, and sine_c. By using the 4 parameters, user can control the QPS variation including the period, average, changes.
To use the bench mark, user can indicate the following parameters as examples:
```
-benchmarks="mixgraph" -key_dist_a=0.002312 -key_dist_b=0.3467 -value_k=0.9233 -value_sigma=226.4092 -iter_k=2.517 -iter_sigma=14.236 -mix_get_ratio=0.7 -mix_put_ratio=0.25 -mix_seek_ratio=0.05 -sine_mix_rate_interval_milliseconds=500 -sine_a=15000 -sine_b=1 -sine_d=20000
```
Pull Request resolved: https://github.com/facebook/rocksdb/pull/4788
Differential Revision: D13573940
Pulled By: sagar0
fbshipit-source-id: e184c27e07b4f1bc0b436c2be36c5090c1fb0222
6 years ago
|
|
|
bytes += key.size() + pinnable_val.size();
|
|
|
|
|
} else if (!s.IsNotFound()) {
|
|
|
|
|
fprintf(stderr, "Get returned an error: %s\n", s.ToString().c_str());
|
|
|
|
|
abort();
|
|
|
|
|
}
|
|
|
|
|
|
|
|
|
|
if (thread->shared->read_rate_limiter && (gets + seek) % 100 == 0) {
|
|
|
|
|
thread->shared->read_rate_limiter->Request(100, Env::IO_HIGH,
|
|
|
|
|
nullptr /*stats*/);
|
Generate mixed workload with Get, Put, Seek in db_bench (#4788)
Summary:
Based on the specific workload models (key access distribution, value size distribution, and iterator scan length distribution, the QPS variation), the MixGraph benchmark generate the synthetic workload according to these distributions which can reflect the real-world workload characteristics.
After user enable the tracing function, they will get the trace file. By analyzing the trace file with the trace_analyzer tool, user can generate a set of statistic data files including. The *_accessed_key_stats.txt, *-accessed_value_size_distribution.txt, *-iterator_length_distribution.txt, and *-qps_stats.txt are mainly used to fit the Matlab model fitting. After that, user can get the parameters of the workload distributions (the modeling details are described: [here](https://github.com/facebook/rocksdb/wiki/RocksDB-Trace%2C-Replay%2C-and-Analyzer))
The key access distribution follows the The two-term power model. The probability density function is: `f(x) = ax^{b}+c`. The corresponding parameters are key_dist_a, key_dist_b, and key_dist_c in db_bench
For the value size distribution and iterator scan length distribution, they both follow the Generalized Pareto Distribution. The probability density function is `f(x) = (1/sigma)(1+k*(x-theta)/sigma))^{-1-1/k)`. The parameters are: value_k, value_theta, value_sigma and iter_k, iter_theta, iter_sigma. For more information about the Generalized Pareto Distribution, users can find the [wiki](https://en.wikipedia.org/wiki/Generalized_Pareto_distribution) and [Matalb page](https://www.mathworks.com/help/stats/generalized-pareto-distribution.html)
As for the QPS, it follows the diurnal pattern. So Sine is a good model to fit it. `F(x) = sine_a*sin(sine_b*x + sine_c) + sine_d`. The trace_will tell you the average QPS in the print out resutls, which is sine_d. After user fit the "*-qps_stats.txt" to the Matlab model, user can get the sine_a, sine_b, and sine_c. By using the 4 parameters, user can control the QPS variation including the period, average, changes.
To use the bench mark, user can indicate the following parameters as examples:
```
-benchmarks="mixgraph" -key_dist_a=0.002312 -key_dist_b=0.3467 -value_k=0.9233 -value_sigma=226.4092 -iter_k=2.517 -iter_sigma=14.236 -mix_get_ratio=0.7 -mix_put_ratio=0.25 -mix_seek_ratio=0.05 -sine_mix_rate_interval_milliseconds=500 -sine_a=15000 -sine_b=1 -sine_d=20000
```
Pull Request resolved: https://github.com/facebook/rocksdb/pull/4788
Differential Revision: D13573940
Pulled By: sagar0
fbshipit-source-id: e184c27e07b4f1bc0b436c2be36c5090c1fb0222
6 years ago
|
|
|
}
|
|
|
|
|
thread->stats.FinishedOps(db_with_cfh, db_with_cfh->db, 1, kRead);
|
Generate mixed workload with Get, Put, Seek in db_bench (#4788)
Summary:
Based on the specific workload models (key access distribution, value size distribution, and iterator scan length distribution, the QPS variation), the MixGraph benchmark generate the synthetic workload according to these distributions which can reflect the real-world workload characteristics.
After user enable the tracing function, they will get the trace file. By analyzing the trace file with the trace_analyzer tool, user can generate a set of statistic data files including. The *_accessed_key_stats.txt, *-accessed_value_size_distribution.txt, *-iterator_length_distribution.txt, and *-qps_stats.txt are mainly used to fit the Matlab model fitting. After that, user can get the parameters of the workload distributions (the modeling details are described: [here](https://github.com/facebook/rocksdb/wiki/RocksDB-Trace%2C-Replay%2C-and-Analyzer))
The key access distribution follows the The two-term power model. The probability density function is: `f(x) = ax^{b}+c`. The corresponding parameters are key_dist_a, key_dist_b, and key_dist_c in db_bench
For the value size distribution and iterator scan length distribution, they both follow the Generalized Pareto Distribution. The probability density function is `f(x) = (1/sigma)(1+k*(x-theta)/sigma))^{-1-1/k)`. The parameters are: value_k, value_theta, value_sigma and iter_k, iter_theta, iter_sigma. For more information about the Generalized Pareto Distribution, users can find the [wiki](https://en.wikipedia.org/wiki/Generalized_Pareto_distribution) and [Matalb page](https://www.mathworks.com/help/stats/generalized-pareto-distribution.html)
As for the QPS, it follows the diurnal pattern. So Sine is a good model to fit it. `F(x) = sine_a*sin(sine_b*x + sine_c) + sine_d`. The trace_will tell you the average QPS in the print out resutls, which is sine_d. After user fit the "*-qps_stats.txt" to the Matlab model, user can get the sine_a, sine_b, and sine_c. By using the 4 parameters, user can control the QPS variation including the period, average, changes.
To use the bench mark, user can indicate the following parameters as examples:
```
-benchmarks="mixgraph" -key_dist_a=0.002312 -key_dist_b=0.3467 -value_k=0.9233 -value_sigma=226.4092 -iter_k=2.517 -iter_sigma=14.236 -mix_get_ratio=0.7 -mix_put_ratio=0.25 -mix_seek_ratio=0.05 -sine_mix_rate_interval_milliseconds=500 -sine_a=15000 -sine_b=1 -sine_d=20000
```
Pull Request resolved: https://github.com/facebook/rocksdb/pull/4788
Differential Revision: D13573940
Pulled By: sagar0
fbshipit-source-id: e184c27e07b4f1bc0b436c2be36c5090c1fb0222
6 years ago
|
|
|
} else if (query_type == 1) {
|
|
|
|
|
// the Put query
|
|
|
|
|
puts++;
|
|
|
|
|
int64_t val_size = ParetoCdfInversion(
|
Generate mixed workload with Get, Put, Seek in db_bench (#4788)
Summary:
Based on the specific workload models (key access distribution, value size distribution, and iterator scan length distribution, the QPS variation), the MixGraph benchmark generate the synthetic workload according to these distributions which can reflect the real-world workload characteristics.
After user enable the tracing function, they will get the trace file. By analyzing the trace file with the trace_analyzer tool, user can generate a set of statistic data files including. The *_accessed_key_stats.txt, *-accessed_value_size_distribution.txt, *-iterator_length_distribution.txt, and *-qps_stats.txt are mainly used to fit the Matlab model fitting. After that, user can get the parameters of the workload distributions (the modeling details are described: [here](https://github.com/facebook/rocksdb/wiki/RocksDB-Trace%2C-Replay%2C-and-Analyzer))
The key access distribution follows the The two-term power model. The probability density function is: `f(x) = ax^{b}+c`. The corresponding parameters are key_dist_a, key_dist_b, and key_dist_c in db_bench
For the value size distribution and iterator scan length distribution, they both follow the Generalized Pareto Distribution. The probability density function is `f(x) = (1/sigma)(1+k*(x-theta)/sigma))^{-1-1/k)`. The parameters are: value_k, value_theta, value_sigma and iter_k, iter_theta, iter_sigma. For more information about the Generalized Pareto Distribution, users can find the [wiki](https://en.wikipedia.org/wiki/Generalized_Pareto_distribution) and [Matalb page](https://www.mathworks.com/help/stats/generalized-pareto-distribution.html)
As for the QPS, it follows the diurnal pattern. So Sine is a good model to fit it. `F(x) = sine_a*sin(sine_b*x + sine_c) + sine_d`. The trace_will tell you the average QPS in the print out resutls, which is sine_d. After user fit the "*-qps_stats.txt" to the Matlab model, user can get the sine_a, sine_b, and sine_c. By using the 4 parameters, user can control the QPS variation including the period, average, changes.
To use the bench mark, user can indicate the following parameters as examples:
```
-benchmarks="mixgraph" -key_dist_a=0.002312 -key_dist_b=0.3467 -value_k=0.9233 -value_sigma=226.4092 -iter_k=2.517 -iter_sigma=14.236 -mix_get_ratio=0.7 -mix_put_ratio=0.25 -mix_seek_ratio=0.05 -sine_mix_rate_interval_milliseconds=500 -sine_a=15000 -sine_b=1 -sine_d=20000
```
Pull Request resolved: https://github.com/facebook/rocksdb/pull/4788
Differential Revision: D13573940
Pulled By: sagar0
fbshipit-source-id: e184c27e07b4f1bc0b436c2be36c5090c1fb0222
6 years ago
|
|
|
u, FLAGS_value_theta, FLAGS_value_k, FLAGS_value_sigma);
|
|
|
|
|
if (val_size < 10) {
|
|
|
|
|
val_size = 10;
|
|
|
|
|
} else if (val_size > value_max) {
|
|
|
|
|
val_size = val_size % value_max;
|
Generate mixed workload with Get, Put, Seek in db_bench (#4788)
Summary:
Based on the specific workload models (key access distribution, value size distribution, and iterator scan length distribution, the QPS variation), the MixGraph benchmark generate the synthetic workload according to these distributions which can reflect the real-world workload characteristics.
After user enable the tracing function, they will get the trace file. By analyzing the trace file with the trace_analyzer tool, user can generate a set of statistic data files including. The *_accessed_key_stats.txt, *-accessed_value_size_distribution.txt, *-iterator_length_distribution.txt, and *-qps_stats.txt are mainly used to fit the Matlab model fitting. After that, user can get the parameters of the workload distributions (the modeling details are described: [here](https://github.com/facebook/rocksdb/wiki/RocksDB-Trace%2C-Replay%2C-and-Analyzer))
The key access distribution follows the The two-term power model. The probability density function is: `f(x) = ax^{b}+c`. The corresponding parameters are key_dist_a, key_dist_b, and key_dist_c in db_bench
For the value size distribution and iterator scan length distribution, they both follow the Generalized Pareto Distribution. The probability density function is `f(x) = (1/sigma)(1+k*(x-theta)/sigma))^{-1-1/k)`. The parameters are: value_k, value_theta, value_sigma and iter_k, iter_theta, iter_sigma. For more information about the Generalized Pareto Distribution, users can find the [wiki](https://en.wikipedia.org/wiki/Generalized_Pareto_distribution) and [Matalb page](https://www.mathworks.com/help/stats/generalized-pareto-distribution.html)
As for the QPS, it follows the diurnal pattern. So Sine is a good model to fit it. `F(x) = sine_a*sin(sine_b*x + sine_c) + sine_d`. The trace_will tell you the average QPS in the print out resutls, which is sine_d. After user fit the "*-qps_stats.txt" to the Matlab model, user can get the sine_a, sine_b, and sine_c. By using the 4 parameters, user can control the QPS variation including the period, average, changes.
To use the bench mark, user can indicate the following parameters as examples:
```
-benchmarks="mixgraph" -key_dist_a=0.002312 -key_dist_b=0.3467 -value_k=0.9233 -value_sigma=226.4092 -iter_k=2.517 -iter_sigma=14.236 -mix_get_ratio=0.7 -mix_put_ratio=0.25 -mix_seek_ratio=0.05 -sine_mix_rate_interval_milliseconds=500 -sine_a=15000 -sine_b=1 -sine_d=20000
```
Pull Request resolved: https://github.com/facebook/rocksdb/pull/4788
Differential Revision: D13573940
Pulled By: sagar0
fbshipit-source-id: e184c27e07b4f1bc0b436c2be36c5090c1fb0222
6 years ago
|
|
|
}
|
|
|
|
|
total_val_size += val_size;
|
|
|
|
|
|
|
|
|
|
s = db_with_cfh->db->Put(
|
|
|
|
|
write_options_, key,
|
|
|
|
|
gen.Generate(static_cast<unsigned int>(val_size)));
|
Generate mixed workload with Get, Put, Seek in db_bench (#4788)
Summary:
Based on the specific workload models (key access distribution, value size distribution, and iterator scan length distribution, the QPS variation), the MixGraph benchmark generate the synthetic workload according to these distributions which can reflect the real-world workload characteristics.
After user enable the tracing function, they will get the trace file. By analyzing the trace file with the trace_analyzer tool, user can generate a set of statistic data files including. The *_accessed_key_stats.txt, *-accessed_value_size_distribution.txt, *-iterator_length_distribution.txt, and *-qps_stats.txt are mainly used to fit the Matlab model fitting. After that, user can get the parameters of the workload distributions (the modeling details are described: [here](https://github.com/facebook/rocksdb/wiki/RocksDB-Trace%2C-Replay%2C-and-Analyzer))
The key access distribution follows the The two-term power model. The probability density function is: `f(x) = ax^{b}+c`. The corresponding parameters are key_dist_a, key_dist_b, and key_dist_c in db_bench
For the value size distribution and iterator scan length distribution, they both follow the Generalized Pareto Distribution. The probability density function is `f(x) = (1/sigma)(1+k*(x-theta)/sigma))^{-1-1/k)`. The parameters are: value_k, value_theta, value_sigma and iter_k, iter_theta, iter_sigma. For more information about the Generalized Pareto Distribution, users can find the [wiki](https://en.wikipedia.org/wiki/Generalized_Pareto_distribution) and [Matalb page](https://www.mathworks.com/help/stats/generalized-pareto-distribution.html)
As for the QPS, it follows the diurnal pattern. So Sine is a good model to fit it. `F(x) = sine_a*sin(sine_b*x + sine_c) + sine_d`. The trace_will tell you the average QPS in the print out resutls, which is sine_d. After user fit the "*-qps_stats.txt" to the Matlab model, user can get the sine_a, sine_b, and sine_c. By using the 4 parameters, user can control the QPS variation including the period, average, changes.
To use the bench mark, user can indicate the following parameters as examples:
```
-benchmarks="mixgraph" -key_dist_a=0.002312 -key_dist_b=0.3467 -value_k=0.9233 -value_sigma=226.4092 -iter_k=2.517 -iter_sigma=14.236 -mix_get_ratio=0.7 -mix_put_ratio=0.25 -mix_seek_ratio=0.05 -sine_mix_rate_interval_milliseconds=500 -sine_a=15000 -sine_b=1 -sine_d=20000
```
Pull Request resolved: https://github.com/facebook/rocksdb/pull/4788
Differential Revision: D13573940
Pulled By: sagar0
fbshipit-source-id: e184c27e07b4f1bc0b436c2be36c5090c1fb0222
6 years ago
|
|
|
if (!s.ok()) {
|
|
|
|
|
fprintf(stderr, "put error: %s\n", s.ToString().c_str());
|
|
|
|
|
ErrorExit();
|
Generate mixed workload with Get, Put, Seek in db_bench (#4788)
Summary:
Based on the specific workload models (key access distribution, value size distribution, and iterator scan length distribution, the QPS variation), the MixGraph benchmark generate the synthetic workload according to these distributions which can reflect the real-world workload characteristics.
After user enable the tracing function, they will get the trace file. By analyzing the trace file with the trace_analyzer tool, user can generate a set of statistic data files including. The *_accessed_key_stats.txt, *-accessed_value_size_distribution.txt, *-iterator_length_distribution.txt, and *-qps_stats.txt are mainly used to fit the Matlab model fitting. After that, user can get the parameters of the workload distributions (the modeling details are described: [here](https://github.com/facebook/rocksdb/wiki/RocksDB-Trace%2C-Replay%2C-and-Analyzer))
The key access distribution follows the The two-term power model. The probability density function is: `f(x) = ax^{b}+c`. The corresponding parameters are key_dist_a, key_dist_b, and key_dist_c in db_bench
For the value size distribution and iterator scan length distribution, they both follow the Generalized Pareto Distribution. The probability density function is `f(x) = (1/sigma)(1+k*(x-theta)/sigma))^{-1-1/k)`. The parameters are: value_k, value_theta, value_sigma and iter_k, iter_theta, iter_sigma. For more information about the Generalized Pareto Distribution, users can find the [wiki](https://en.wikipedia.org/wiki/Generalized_Pareto_distribution) and [Matalb page](https://www.mathworks.com/help/stats/generalized-pareto-distribution.html)
As for the QPS, it follows the diurnal pattern. So Sine is a good model to fit it. `F(x) = sine_a*sin(sine_b*x + sine_c) + sine_d`. The trace_will tell you the average QPS in the print out resutls, which is sine_d. After user fit the "*-qps_stats.txt" to the Matlab model, user can get the sine_a, sine_b, and sine_c. By using the 4 parameters, user can control the QPS variation including the period, average, changes.
To use the bench mark, user can indicate the following parameters as examples:
```
-benchmarks="mixgraph" -key_dist_a=0.002312 -key_dist_b=0.3467 -value_k=0.9233 -value_sigma=226.4092 -iter_k=2.517 -iter_sigma=14.236 -mix_get_ratio=0.7 -mix_put_ratio=0.25 -mix_seek_ratio=0.05 -sine_mix_rate_interval_milliseconds=500 -sine_a=15000 -sine_b=1 -sine_d=20000
```
Pull Request resolved: https://github.com/facebook/rocksdb/pull/4788
Differential Revision: D13573940
Pulled By: sagar0
fbshipit-source-id: e184c27e07b4f1bc0b436c2be36c5090c1fb0222
6 years ago
|
|
|
}
|
|
|
|
|
|
|
|
|
|
if (thread->shared->write_rate_limiter && puts % 100 == 0) {
|
|
|
|
|
thread->shared->write_rate_limiter->Request(100, Env::IO_HIGH,
|
|
|
|
|
nullptr /*stats*/);
|
Generate mixed workload with Get, Put, Seek in db_bench (#4788)
Summary:
Based on the specific workload models (key access distribution, value size distribution, and iterator scan length distribution, the QPS variation), the MixGraph benchmark generate the synthetic workload according to these distributions which can reflect the real-world workload characteristics.
After user enable the tracing function, they will get the trace file. By analyzing the trace file with the trace_analyzer tool, user can generate a set of statistic data files including. The *_accessed_key_stats.txt, *-accessed_value_size_distribution.txt, *-iterator_length_distribution.txt, and *-qps_stats.txt are mainly used to fit the Matlab model fitting. After that, user can get the parameters of the workload distributions (the modeling details are described: [here](https://github.com/facebook/rocksdb/wiki/RocksDB-Trace%2C-Replay%2C-and-Analyzer))
The key access distribution follows the The two-term power model. The probability density function is: `f(x) = ax^{b}+c`. The corresponding parameters are key_dist_a, key_dist_b, and key_dist_c in db_bench
For the value size distribution and iterator scan length distribution, they both follow the Generalized Pareto Distribution. The probability density function is `f(x) = (1/sigma)(1+k*(x-theta)/sigma))^{-1-1/k)`. The parameters are: value_k, value_theta, value_sigma and iter_k, iter_theta, iter_sigma. For more information about the Generalized Pareto Distribution, users can find the [wiki](https://en.wikipedia.org/wiki/Generalized_Pareto_distribution) and [Matalb page](https://www.mathworks.com/help/stats/generalized-pareto-distribution.html)
As for the QPS, it follows the diurnal pattern. So Sine is a good model to fit it. `F(x) = sine_a*sin(sine_b*x + sine_c) + sine_d`. The trace_will tell you the average QPS in the print out resutls, which is sine_d. After user fit the "*-qps_stats.txt" to the Matlab model, user can get the sine_a, sine_b, and sine_c. By using the 4 parameters, user can control the QPS variation including the period, average, changes.
To use the bench mark, user can indicate the following parameters as examples:
```
-benchmarks="mixgraph" -key_dist_a=0.002312 -key_dist_b=0.3467 -value_k=0.9233 -value_sigma=226.4092 -iter_k=2.517 -iter_sigma=14.236 -mix_get_ratio=0.7 -mix_put_ratio=0.25 -mix_seek_ratio=0.05 -sine_mix_rate_interval_milliseconds=500 -sine_a=15000 -sine_b=1 -sine_d=20000
```
Pull Request resolved: https://github.com/facebook/rocksdb/pull/4788
Differential Revision: D13573940
Pulled By: sagar0
fbshipit-source-id: e184c27e07b4f1bc0b436c2be36c5090c1fb0222
6 years ago
|
|
|
}
|
|
|
|
|
thread->stats.FinishedOps(db_with_cfh, db_with_cfh->db, 1, kWrite);
|
Generate mixed workload with Get, Put, Seek in db_bench (#4788)
Summary:
Based on the specific workload models (key access distribution, value size distribution, and iterator scan length distribution, the QPS variation), the MixGraph benchmark generate the synthetic workload according to these distributions which can reflect the real-world workload characteristics.
After user enable the tracing function, they will get the trace file. By analyzing the trace file with the trace_analyzer tool, user can generate a set of statistic data files including. The *_accessed_key_stats.txt, *-accessed_value_size_distribution.txt, *-iterator_length_distribution.txt, and *-qps_stats.txt are mainly used to fit the Matlab model fitting. After that, user can get the parameters of the workload distributions (the modeling details are described: [here](https://github.com/facebook/rocksdb/wiki/RocksDB-Trace%2C-Replay%2C-and-Analyzer))
The key access distribution follows the The two-term power model. The probability density function is: `f(x) = ax^{b}+c`. The corresponding parameters are key_dist_a, key_dist_b, and key_dist_c in db_bench
For the value size distribution and iterator scan length distribution, they both follow the Generalized Pareto Distribution. The probability density function is `f(x) = (1/sigma)(1+k*(x-theta)/sigma))^{-1-1/k)`. The parameters are: value_k, value_theta, value_sigma and iter_k, iter_theta, iter_sigma. For more information about the Generalized Pareto Distribution, users can find the [wiki](https://en.wikipedia.org/wiki/Generalized_Pareto_distribution) and [Matalb page](https://www.mathworks.com/help/stats/generalized-pareto-distribution.html)
As for the QPS, it follows the diurnal pattern. So Sine is a good model to fit it. `F(x) = sine_a*sin(sine_b*x + sine_c) + sine_d`. The trace_will tell you the average QPS in the print out resutls, which is sine_d. After user fit the "*-qps_stats.txt" to the Matlab model, user can get the sine_a, sine_b, and sine_c. By using the 4 parameters, user can control the QPS variation including the period, average, changes.
To use the bench mark, user can indicate the following parameters as examples:
```
-benchmarks="mixgraph" -key_dist_a=0.002312 -key_dist_b=0.3467 -value_k=0.9233 -value_sigma=226.4092 -iter_k=2.517 -iter_sigma=14.236 -mix_get_ratio=0.7 -mix_put_ratio=0.25 -mix_seek_ratio=0.05 -sine_mix_rate_interval_milliseconds=500 -sine_a=15000 -sine_b=1 -sine_d=20000
```
Pull Request resolved: https://github.com/facebook/rocksdb/pull/4788
Differential Revision: D13573940
Pulled By: sagar0
fbshipit-source-id: e184c27e07b4f1bc0b436c2be36c5090c1fb0222
6 years ago
|
|
|
} else if (query_type == 2) {
|
|
|
|
|
// Seek query
|
|
|
|
|
if (db_with_cfh->db != nullptr) {
|
|
|
|
|
Iterator* single_iter = nullptr;
|
|
|
|
|
single_iter = db_with_cfh->db->NewIterator(read_options_);
|
Generate mixed workload with Get, Put, Seek in db_bench (#4788)
Summary:
Based on the specific workload models (key access distribution, value size distribution, and iterator scan length distribution, the QPS variation), the MixGraph benchmark generate the synthetic workload according to these distributions which can reflect the real-world workload characteristics.
After user enable the tracing function, they will get the trace file. By analyzing the trace file with the trace_analyzer tool, user can generate a set of statistic data files including. The *_accessed_key_stats.txt, *-accessed_value_size_distribution.txt, *-iterator_length_distribution.txt, and *-qps_stats.txt are mainly used to fit the Matlab model fitting. After that, user can get the parameters of the workload distributions (the modeling details are described: [here](https://github.com/facebook/rocksdb/wiki/RocksDB-Trace%2C-Replay%2C-and-Analyzer))
The key access distribution follows the The two-term power model. The probability density function is: `f(x) = ax^{b}+c`. The corresponding parameters are key_dist_a, key_dist_b, and key_dist_c in db_bench
For the value size distribution and iterator scan length distribution, they both follow the Generalized Pareto Distribution. The probability density function is `f(x) = (1/sigma)(1+k*(x-theta)/sigma))^{-1-1/k)`. The parameters are: value_k, value_theta, value_sigma and iter_k, iter_theta, iter_sigma. For more information about the Generalized Pareto Distribution, users can find the [wiki](https://en.wikipedia.org/wiki/Generalized_Pareto_distribution) and [Matalb page](https://www.mathworks.com/help/stats/generalized-pareto-distribution.html)
As for the QPS, it follows the diurnal pattern. So Sine is a good model to fit it. `F(x) = sine_a*sin(sine_b*x + sine_c) + sine_d`. The trace_will tell you the average QPS in the print out resutls, which is sine_d. After user fit the "*-qps_stats.txt" to the Matlab model, user can get the sine_a, sine_b, and sine_c. By using the 4 parameters, user can control the QPS variation including the period, average, changes.
To use the bench mark, user can indicate the following parameters as examples:
```
-benchmarks="mixgraph" -key_dist_a=0.002312 -key_dist_b=0.3467 -value_k=0.9233 -value_sigma=226.4092 -iter_k=2.517 -iter_sigma=14.236 -mix_get_ratio=0.7 -mix_put_ratio=0.25 -mix_seek_ratio=0.05 -sine_mix_rate_interval_milliseconds=500 -sine_a=15000 -sine_b=1 -sine_d=20000
```
Pull Request resolved: https://github.com/facebook/rocksdb/pull/4788
Differential Revision: D13573940
Pulled By: sagar0
fbshipit-source-id: e184c27e07b4f1bc0b436c2be36c5090c1fb0222
6 years ago
|
|
|
if (single_iter != nullptr) {
|
|
|
|
|
single_iter->Seek(key);
|
|
|
|
|
seek++;
|
|
|
|
|
if (single_iter->Valid() && single_iter->key().compare(key) == 0) {
|
|
|
|
|
seek_found++;
|
|
|
|
|
}
|
|
|
|
|
int64_t scan_length =
|
|
|
|
|
ParetoCdfInversion(u, FLAGS_iter_theta, FLAGS_iter_k,
|
|
|
|
|
FLAGS_iter_sigma) %
|
|
|
|
|
scan_len_max;
|
|
|
|
|
for (int64_t j = 0; j < scan_length && single_iter->Valid(); j++) {
|
|
|
|
|
Slice value = single_iter->value();
|
|
|
|
|
memcpy(value_buffer, value.data(),
|
|
|
|
|
std::min(value.size(), sizeof(value_buffer)));
|
|
|
|
|
bytes += single_iter->key().size() + single_iter->value().size();
|
|
|
|
|
single_iter->Next();
|
|
|
|
|
assert(single_iter->status().ok());
|
|
|
|
|
total_scan_length++;
|
Generate mixed workload with Get, Put, Seek in db_bench (#4788)
Summary:
Based on the specific workload models (key access distribution, value size distribution, and iterator scan length distribution, the QPS variation), the MixGraph benchmark generate the synthetic workload according to these distributions which can reflect the real-world workload characteristics.
After user enable the tracing function, they will get the trace file. By analyzing the trace file with the trace_analyzer tool, user can generate a set of statistic data files including. The *_accessed_key_stats.txt, *-accessed_value_size_distribution.txt, *-iterator_length_distribution.txt, and *-qps_stats.txt are mainly used to fit the Matlab model fitting. After that, user can get the parameters of the workload distributions (the modeling details are described: [here](https://github.com/facebook/rocksdb/wiki/RocksDB-Trace%2C-Replay%2C-and-Analyzer))
The key access distribution follows the The two-term power model. The probability density function is: `f(x) = ax^{b}+c`. The corresponding parameters are key_dist_a, key_dist_b, and key_dist_c in db_bench
For the value size distribution and iterator scan length distribution, they both follow the Generalized Pareto Distribution. The probability density function is `f(x) = (1/sigma)(1+k*(x-theta)/sigma))^{-1-1/k)`. The parameters are: value_k, value_theta, value_sigma and iter_k, iter_theta, iter_sigma. For more information about the Generalized Pareto Distribution, users can find the [wiki](https://en.wikipedia.org/wiki/Generalized_Pareto_distribution) and [Matalb page](https://www.mathworks.com/help/stats/generalized-pareto-distribution.html)
As for the QPS, it follows the diurnal pattern. So Sine is a good model to fit it. `F(x) = sine_a*sin(sine_b*x + sine_c) + sine_d`. The trace_will tell you the average QPS in the print out resutls, which is sine_d. After user fit the "*-qps_stats.txt" to the Matlab model, user can get the sine_a, sine_b, and sine_c. By using the 4 parameters, user can control the QPS variation including the period, average, changes.
To use the bench mark, user can indicate the following parameters as examples:
```
-benchmarks="mixgraph" -key_dist_a=0.002312 -key_dist_b=0.3467 -value_k=0.9233 -value_sigma=226.4092 -iter_k=2.517 -iter_sigma=14.236 -mix_get_ratio=0.7 -mix_put_ratio=0.25 -mix_seek_ratio=0.05 -sine_mix_rate_interval_milliseconds=500 -sine_a=15000 -sine_b=1 -sine_d=20000
```
Pull Request resolved: https://github.com/facebook/rocksdb/pull/4788
Differential Revision: D13573940
Pulled By: sagar0
fbshipit-source-id: e184c27e07b4f1bc0b436c2be36c5090c1fb0222
6 years ago
|
|
|
}
|
|
|
|
|
}
|
|
|
|
|
delete single_iter;
|
|
|
|
|
}
|
|
|
|
|
thread->stats.FinishedOps(db_with_cfh, db_with_cfh->db, 1, kSeek);
|
Generate mixed workload with Get, Put, Seek in db_bench (#4788)
Summary:
Based on the specific workload models (key access distribution, value size distribution, and iterator scan length distribution, the QPS variation), the MixGraph benchmark generate the synthetic workload according to these distributions which can reflect the real-world workload characteristics.
After user enable the tracing function, they will get the trace file. By analyzing the trace file with the trace_analyzer tool, user can generate a set of statistic data files including. The *_accessed_key_stats.txt, *-accessed_value_size_distribution.txt, *-iterator_length_distribution.txt, and *-qps_stats.txt are mainly used to fit the Matlab model fitting. After that, user can get the parameters of the workload distributions (the modeling details are described: [here](https://github.com/facebook/rocksdb/wiki/RocksDB-Trace%2C-Replay%2C-and-Analyzer))
The key access distribution follows the The two-term power model. The probability density function is: `f(x) = ax^{b}+c`. The corresponding parameters are key_dist_a, key_dist_b, and key_dist_c in db_bench
For the value size distribution and iterator scan length distribution, they both follow the Generalized Pareto Distribution. The probability density function is `f(x) = (1/sigma)(1+k*(x-theta)/sigma))^{-1-1/k)`. The parameters are: value_k, value_theta, value_sigma and iter_k, iter_theta, iter_sigma. For more information about the Generalized Pareto Distribution, users can find the [wiki](https://en.wikipedia.org/wiki/Generalized_Pareto_distribution) and [Matalb page](https://www.mathworks.com/help/stats/generalized-pareto-distribution.html)
As for the QPS, it follows the diurnal pattern. So Sine is a good model to fit it. `F(x) = sine_a*sin(sine_b*x + sine_c) + sine_d`. The trace_will tell you the average QPS in the print out resutls, which is sine_d. After user fit the "*-qps_stats.txt" to the Matlab model, user can get the sine_a, sine_b, and sine_c. By using the 4 parameters, user can control the QPS variation including the period, average, changes.
To use the bench mark, user can indicate the following parameters as examples:
```
-benchmarks="mixgraph" -key_dist_a=0.002312 -key_dist_b=0.3467 -value_k=0.9233 -value_sigma=226.4092 -iter_k=2.517 -iter_sigma=14.236 -mix_get_ratio=0.7 -mix_put_ratio=0.25 -mix_seek_ratio=0.05 -sine_mix_rate_interval_milliseconds=500 -sine_a=15000 -sine_b=1 -sine_d=20000
```
Pull Request resolved: https://github.com/facebook/rocksdb/pull/4788
Differential Revision: D13573940
Pulled By: sagar0
fbshipit-source-id: e184c27e07b4f1bc0b436c2be36c5090c1fb0222
6 years ago
|
|
|
}
|
|
|
|
|
}
|
|
|
|
|
char msg[256];
|
Generate mixed workload with Get, Put, Seek in db_bench (#4788)
Summary:
Based on the specific workload models (key access distribution, value size distribution, and iterator scan length distribution, the QPS variation), the MixGraph benchmark generate the synthetic workload according to these distributions which can reflect the real-world workload characteristics.
After user enable the tracing function, they will get the trace file. By analyzing the trace file with the trace_analyzer tool, user can generate a set of statistic data files including. The *_accessed_key_stats.txt, *-accessed_value_size_distribution.txt, *-iterator_length_distribution.txt, and *-qps_stats.txt are mainly used to fit the Matlab model fitting. After that, user can get the parameters of the workload distributions (the modeling details are described: [here](https://github.com/facebook/rocksdb/wiki/RocksDB-Trace%2C-Replay%2C-and-Analyzer))
The key access distribution follows the The two-term power model. The probability density function is: `f(x) = ax^{b}+c`. The corresponding parameters are key_dist_a, key_dist_b, and key_dist_c in db_bench
For the value size distribution and iterator scan length distribution, they both follow the Generalized Pareto Distribution. The probability density function is `f(x) = (1/sigma)(1+k*(x-theta)/sigma))^{-1-1/k)`. The parameters are: value_k, value_theta, value_sigma and iter_k, iter_theta, iter_sigma. For more information about the Generalized Pareto Distribution, users can find the [wiki](https://en.wikipedia.org/wiki/Generalized_Pareto_distribution) and [Matalb page](https://www.mathworks.com/help/stats/generalized-pareto-distribution.html)
As for the QPS, it follows the diurnal pattern. So Sine is a good model to fit it. `F(x) = sine_a*sin(sine_b*x + sine_c) + sine_d`. The trace_will tell you the average QPS in the print out resutls, which is sine_d. After user fit the "*-qps_stats.txt" to the Matlab model, user can get the sine_a, sine_b, and sine_c. By using the 4 parameters, user can control the QPS variation including the period, average, changes.
To use the bench mark, user can indicate the following parameters as examples:
```
-benchmarks="mixgraph" -key_dist_a=0.002312 -key_dist_b=0.3467 -value_k=0.9233 -value_sigma=226.4092 -iter_k=2.517 -iter_sigma=14.236 -mix_get_ratio=0.7 -mix_put_ratio=0.25 -mix_seek_ratio=0.05 -sine_mix_rate_interval_milliseconds=500 -sine_a=15000 -sine_b=1 -sine_d=20000
```
Pull Request resolved: https://github.com/facebook/rocksdb/pull/4788
Differential Revision: D13573940
Pulled By: sagar0
fbshipit-source-id: e184c27e07b4f1bc0b436c2be36c5090c1fb0222
6 years ago
|
|
|
snprintf(msg, sizeof(msg),
|
|
|
|
|
"( Gets:%" PRIu64 " Puts:%" PRIu64 " Seek:%" PRIu64
|
|
|
|
|
", reads %" PRIu64 " in %" PRIu64
|
|
|
|
|
" found, "
|
|
|
|
|
"avg size: %.1f value, %.1f scan)\n",
|
|
|
|
|
gets, puts, seek, get_found + seek_found, gets + seek,
|
|
|
|
|
total_val_size / puts, total_scan_length / seek);
|
Generate mixed workload with Get, Put, Seek in db_bench (#4788)
Summary:
Based on the specific workload models (key access distribution, value size distribution, and iterator scan length distribution, the QPS variation), the MixGraph benchmark generate the synthetic workload according to these distributions which can reflect the real-world workload characteristics.
After user enable the tracing function, they will get the trace file. By analyzing the trace file with the trace_analyzer tool, user can generate a set of statistic data files including. The *_accessed_key_stats.txt, *-accessed_value_size_distribution.txt, *-iterator_length_distribution.txt, and *-qps_stats.txt are mainly used to fit the Matlab model fitting. After that, user can get the parameters of the workload distributions (the modeling details are described: [here](https://github.com/facebook/rocksdb/wiki/RocksDB-Trace%2C-Replay%2C-and-Analyzer))
The key access distribution follows the The two-term power model. The probability density function is: `f(x) = ax^{b}+c`. The corresponding parameters are key_dist_a, key_dist_b, and key_dist_c in db_bench
For the value size distribution and iterator scan length distribution, they both follow the Generalized Pareto Distribution. The probability density function is `f(x) = (1/sigma)(1+k*(x-theta)/sigma))^{-1-1/k)`. The parameters are: value_k, value_theta, value_sigma and iter_k, iter_theta, iter_sigma. For more information about the Generalized Pareto Distribution, users can find the [wiki](https://en.wikipedia.org/wiki/Generalized_Pareto_distribution) and [Matalb page](https://www.mathworks.com/help/stats/generalized-pareto-distribution.html)
As for the QPS, it follows the diurnal pattern. So Sine is a good model to fit it. `F(x) = sine_a*sin(sine_b*x + sine_c) + sine_d`. The trace_will tell you the average QPS in the print out resutls, which is sine_d. After user fit the "*-qps_stats.txt" to the Matlab model, user can get the sine_a, sine_b, and sine_c. By using the 4 parameters, user can control the QPS variation including the period, average, changes.
To use the bench mark, user can indicate the following parameters as examples:
```
-benchmarks="mixgraph" -key_dist_a=0.002312 -key_dist_b=0.3467 -value_k=0.9233 -value_sigma=226.4092 -iter_k=2.517 -iter_sigma=14.236 -mix_get_ratio=0.7 -mix_put_ratio=0.25 -mix_seek_ratio=0.05 -sine_mix_rate_interval_milliseconds=500 -sine_a=15000 -sine_b=1 -sine_d=20000
```
Pull Request resolved: https://github.com/facebook/rocksdb/pull/4788
Differential Revision: D13573940
Pulled By: sagar0
fbshipit-source-id: e184c27e07b4f1bc0b436c2be36c5090c1fb0222
6 years ago
|
|
|
|
|
|
|
|
thread->stats.AddBytes(bytes);
|
|
|
|
|
thread->stats.AddMessage(msg);
|
|
|
|
|
|
|
|
|
|
if (FLAGS_perf_level > ROCKSDB_NAMESPACE::PerfLevel::kDisable) {
|
Generate mixed workload with Get, Put, Seek in db_bench (#4788)
Summary:
Based on the specific workload models (key access distribution, value size distribution, and iterator scan length distribution, the QPS variation), the MixGraph benchmark generate the synthetic workload according to these distributions which can reflect the real-world workload characteristics.
After user enable the tracing function, they will get the trace file. By analyzing the trace file with the trace_analyzer tool, user can generate a set of statistic data files including. The *_accessed_key_stats.txt, *-accessed_value_size_distribution.txt, *-iterator_length_distribution.txt, and *-qps_stats.txt are mainly used to fit the Matlab model fitting. After that, user can get the parameters of the workload distributions (the modeling details are described: [here](https://github.com/facebook/rocksdb/wiki/RocksDB-Trace%2C-Replay%2C-and-Analyzer))
The key access distribution follows the The two-term power model. The probability density function is: `f(x) = ax^{b}+c`. The corresponding parameters are key_dist_a, key_dist_b, and key_dist_c in db_bench
For the value size distribution and iterator scan length distribution, they both follow the Generalized Pareto Distribution. The probability density function is `f(x) = (1/sigma)(1+k*(x-theta)/sigma))^{-1-1/k)`. The parameters are: value_k, value_theta, value_sigma and iter_k, iter_theta, iter_sigma. For more information about the Generalized Pareto Distribution, users can find the [wiki](https://en.wikipedia.org/wiki/Generalized_Pareto_distribution) and [Matalb page](https://www.mathworks.com/help/stats/generalized-pareto-distribution.html)
As for the QPS, it follows the diurnal pattern. So Sine is a good model to fit it. `F(x) = sine_a*sin(sine_b*x + sine_c) + sine_d`. The trace_will tell you the average QPS in the print out resutls, which is sine_d. After user fit the "*-qps_stats.txt" to the Matlab model, user can get the sine_a, sine_b, and sine_c. By using the 4 parameters, user can control the QPS variation including the period, average, changes.
To use the bench mark, user can indicate the following parameters as examples:
```
-benchmarks="mixgraph" -key_dist_a=0.002312 -key_dist_b=0.3467 -value_k=0.9233 -value_sigma=226.4092 -iter_k=2.517 -iter_sigma=14.236 -mix_get_ratio=0.7 -mix_put_ratio=0.25 -mix_seek_ratio=0.05 -sine_mix_rate_interval_milliseconds=500 -sine_a=15000 -sine_b=1 -sine_d=20000
```
Pull Request resolved: https://github.com/facebook/rocksdb/pull/4788
Differential Revision: D13573940
Pulled By: sagar0
fbshipit-source-id: e184c27e07b4f1bc0b436c2be36c5090c1fb0222
6 years ago
|
|
|
thread->stats.AddMessage(std::string("PERF_CONTEXT:\n") +
|
|
|
|
|
get_perf_context()->ToString());
|
|
|
|
|
}
|
|
|
|
|
}
|
|
|
|
|
|
|
|
|
|
void IteratorCreation(ThreadState* thread) {
|
|
|
|
|
Duration duration(FLAGS_duration, reads_);
|
|
|
|
|
ReadOptions options = read_options_;
|
|
|
|
|
std::unique_ptr<char[]> ts_guard;
|
|
|
|
|
if (user_timestamp_size_ > 0) {
|
|
|
|
|
ts_guard.reset(new char[user_timestamp_size_]);
|
|
|
|
|
}
|
|
|
|
|
while (!duration.Done(1)) {
|
|
|
|
|
DB* db = SelectDB(thread);
|
|
|
|
|
Slice ts;
|
|
|
|
|
if (user_timestamp_size_ > 0) {
|
|
|
|
|
ts = mock_app_clock_->GetTimestampForRead(thread->rand, ts_guard.get());
|
|
|
|
|
options.timestamp = &ts;
|
|
|
|
|
}
|
|
|
|
|
Iterator* iter = db->NewIterator(options);
|
|
|
|
|
delete iter;
|
|
|
|
|
thread->stats.FinishedOps(nullptr, db, 1, kOthers);
|
|
|
|
|
}
|
|
|
|
|
}
|
|
|
|
|
|
|
|
|
|
void IteratorCreationWhileWriting(ThreadState* thread) {
|
|
|
|
|
if (thread->tid > 0) {
|
|
|
|
|
IteratorCreation(thread);
|
|
|
|
|
} else {
|
|
|
|
|
BGWriter(thread, kWrite);
|
|
|
|
|
}
|
|
|
|
|
}
|
|
|
|
|
|
|
|
|
|
void SeekRandom(ThreadState* thread) {
|
|
|
|
|
int64_t read = 0;
|
|
|
|
|
int64_t found = 0;
|
|
|
|
|
int64_t bytes = 0;
|
|
|
|
|
ReadOptions options = read_options_;
|
|
|
|
|
std::unique_ptr<char[]> ts_guard;
|
|
|
|
|
Slice ts;
|
|
|
|
|
if (user_timestamp_size_ > 0) {
|
|
|
|
|
ts_guard.reset(new char[user_timestamp_size_]);
|
|
|
|
|
ts = mock_app_clock_->GetTimestampForRead(thread->rand, ts_guard.get());
|
|
|
|
|
options.timestamp = &ts;
|
|
|
|
|
}
|
|
|
|
|
|
|
|
|
|
std::vector<Iterator*> tailing_iters;
|
|
|
|
|
if (FLAGS_use_tailing_iterator) {
|
|
|
|
|
if (db_.db != nullptr) {
|
|
|
|
|
tailing_iters.push_back(db_.db->NewIterator(options));
|
|
|
|
|
} else {
|
|
|
|
|
for (const auto& db_with_cfh : multi_dbs_) {
|
|
|
|
|
tailing_iters.push_back(db_with_cfh.db->NewIterator(options));
|
|
|
|
|
}
|
|
|
|
|
}
|
|
|
|
|
}
|
|
|
|
|
|
|
|
|
|
std::unique_ptr<const char[]> key_guard;
|
|
|
|
|
Slice key = AllocateKey(&key_guard);
|
|
|
|
|
|
|
|
|
|
std::unique_ptr<const char[]> upper_bound_key_guard;
|
|
|
|
|
Slice upper_bound = AllocateKey(&upper_bound_key_guard);
|
|
|
|
|
std::unique_ptr<const char[]> lower_bound_key_guard;
|
|
|
|
|
Slice lower_bound = AllocateKey(&lower_bound_key_guard);
|
|
|
|
|
|
|
|
|
|
Duration duration(FLAGS_duration, reads_);
|
|
|
|
|
char value_buffer[256];
|
|
|
|
|
while (!duration.Done(1)) {
|
|
|
|
|
int64_t seek_pos = thread->rand.Next() % FLAGS_num;
|
|
|
|
|
GenerateKeyFromIntForSeek(static_cast<uint64_t>(seek_pos), FLAGS_num,
|
|
|
|
|
&key);
|
|
|
|
|
if (FLAGS_max_scan_distance != 0) {
|
|
|
|
|
if (FLAGS_reverse_iterator) {
|
|
|
|
|
GenerateKeyFromInt(
|
|
|
|
|
static_cast<uint64_t>(std::max(
|
|
|
|
|
static_cast<int64_t>(0), seek_pos - FLAGS_max_scan_distance)),
|
|
|
|
|
FLAGS_num, &lower_bound);
|
|
|
|
|
options.iterate_lower_bound = &lower_bound;
|
|
|
|
|
} else {
|
|
|
|
|
auto min_num =
|
|
|
|
|
std::min(FLAGS_num, seek_pos + FLAGS_max_scan_distance);
|
|
|
|
|
GenerateKeyFromInt(static_cast<uint64_t>(min_num), FLAGS_num,
|
|
|
|
|
&upper_bound);
|
|
|
|
|
options.iterate_upper_bound = &upper_bound;
|
|
|
|
|
}
|
|
|
|
|
}
|
|
|
|
|
|
|
|
|
|
// Pick a Iterator to use
|
|
|
|
|
uint64_t db_idx_to_use =
|
|
|
|
|
(db_.db == nullptr)
|
|
|
|
|
? (uint64_t{thread->rand.Next()} % multi_dbs_.size())
|
|
|
|
|
: 0;
|
|
|
|
|
std::unique_ptr<Iterator> single_iter;
|
|
|
|
|
Iterator* iter_to_use;
|
|
|
|
|
if (FLAGS_use_tailing_iterator) {
|
|
|
|
|
iter_to_use = tailing_iters[db_idx_to_use];
|
|
|
|
|
} else {
|
|
|
|
|
if (db_.db != nullptr) {
|
|
|
|
|
single_iter.reset(db_.db->NewIterator(options));
|
|
|
|
|
} else {
|
|
|
|
|
single_iter.reset(multi_dbs_[db_idx_to_use].db->NewIterator(options));
|
|
|
|
|
}
|
|
|
|
|
iter_to_use = single_iter.get();
|
|
|
|
|
}
|
|
|
|
|
|
|
|
|
|
iter_to_use->Seek(key);
|
|
|
|
|
read++;
|
|
|
|
|
if (iter_to_use->Valid() && iter_to_use->key().compare(key) == 0) {
|
|
|
|
|
found++;
|
|
|
|
|
}
|
|
|
|
|
|
|
|
|
|
for (int j = 0; j < FLAGS_seek_nexts && iter_to_use->Valid(); ++j) {
|
|
|
|
|
// Copy out iterator's value to make sure we read them.
|
|
|
|
|
Slice value = iter_to_use->value();
|
|
|
|
|
memcpy(value_buffer, value.data(),
|
|
|
|
|
std::min(value.size(), sizeof(value_buffer)));
|
|
|
|
|
bytes += iter_to_use->key().size() + iter_to_use->value().size();
|
|
|
|
|
|
|
|
|
|
if (!FLAGS_reverse_iterator) {
|
|
|
|
|
iter_to_use->Next();
|
|
|
|
|
} else {
|
|
|
|
|
iter_to_use->Prev();
|
|
|
|
|
}
|
|
|
|
|
assert(iter_to_use->status().ok());
|
|
|
|
|
}
|
|
|
|
|
|
|
|
|
|
if (thread->shared->read_rate_limiter.get() != nullptr &&
|
|
|
|
|
read % 256 == 255) {
|
|
|
|
|
thread->shared->read_rate_limiter->Request(
|
|
|
|
|
256, Env::IO_HIGH, nullptr /* stats */, RateLimiter::OpType::kRead);
|
|
|
|
|
}
|
|
|
|
|
|
|
|
|
|
thread->stats.FinishedOps(&db_, db_.db, 1, kSeek);
|
|
|
|
|
}
|
|
|
|
|
for (auto iter : tailing_iters) {
|
|
|
|
|
delete iter;
|
|
|
|
|
}
|
|
|
|
|
|
|
|
|
|
char msg[100];
|
|
|
|
|
snprintf(msg, sizeof(msg), "(%" PRIu64 " of %" PRIu64 " found)\n",
|
|
|
|
|
found, read);
|
|
|
|
|
thread->stats.AddBytes(bytes);
|
|
|
|
|
thread->stats.AddMessage(msg);
|
|
|
|
|
if (FLAGS_perf_level > ROCKSDB_NAMESPACE::PerfLevel::kDisable) {
|
|
|
|
|
thread->stats.AddMessage(std::string("PERF_CONTEXT:\n") +
|
|
|
|
|
get_perf_context()->ToString());
|
|
|
|
|
}
|
|
|
|
|
}
|
|
|
|
|
|
|
|
|
|
void SeekRandomWhileWriting(ThreadState* thread) {
|
|
|
|
|
if (thread->tid > 0) {
|
|
|
|
|
SeekRandom(thread);
|
|
|
|
|
} else {
|
|
|
|
|
BGWriter(thread, kWrite);
|
|
|
|
|
}
|
|
|
|
|
}
|
|
|
|
|
|
|
|
|
|
void SeekRandomWhileMerging(ThreadState* thread) {
|
|
|
|
|
if (thread->tid > 0) {
|
|
|
|
|
SeekRandom(thread);
|
|
|
|
|
} else {
|
|
|
|
|
BGWriter(thread, kMerge);
|
|
|
|
|
}
|
|
|
|
|
}
|
|
|
|
|
|
|
|
|
|
void DoDelete(ThreadState* thread, bool seq) {
|
|
|
|
|
WriteBatch batch(/*reserved_bytes=*/0, /*max_bytes=*/0,
|
Revise APIs related to user-defined timestamp (#8946)
Summary:
ajkr reminded me that we have a rule of not including per-kv related data in `WriteOptions`.
Namely, `WriteOptions` should not include information about "what-to-write", but should just
include information about "how-to-write".
According to this rule, `WriteOptions::timestamp` (experimental) is clearly a violation. Therefore,
this PR removes `WriteOptions::timestamp` for compliance.
After the removal, we need to pass timestamp info via another set of APIs. This PR proposes a set
of overloaded functions `Put(write_opts, key, value, ts)`, `Delete(write_opts, key, ts)`, and
`SingleDelete(write_opts, key, ts)`. Planned to add `Write(write_opts, batch, ts)`, but its complexity
made me reconsider doing it in another PR (maybe).
For better checking and returning error early, we also add a new set of APIs to `WriteBatch` that take
extra `timestamp` information when writing to `WriteBatch`es.
These set of APIs in `WriteBatchWithIndex` are currently not supported, and are on our TODO list.
Removed `WriteBatch::AssignTimestamps()` and renamed `WriteBatch::AssignTimestamp()` to
`WriteBatch::UpdateTimestamps()` since this method require that all keys have space for timestamps
allocated already and multiple timestamps can be updated.
The constructor of `WriteBatch` now takes a fourth argument `default_cf_ts_sz` which is the timestamp
size of the default column family. This will be used to allocate space when calling APIs that do not
specify a column family handle.
Also, updated `DB::Get()`, `DB::MultiGet()`, `DB::NewIterator()`, `DB::NewIterators()` methods, replacing
some assertions about timestamp to returning Status code.
Pull Request resolved: https://github.com/facebook/rocksdb/pull/8946
Test Plan:
make check
./db_bench -benchmarks=fillseq,fillrandom,readrandom,readseq,deleterandom -user_timestamp_size=8
./db_stress --user_timestamp_size=8 -nooverwritepercent=0 -test_secondary=0 -secondary_catch_up_one_in=0 -continuous_verification_interval=0
Make sure there is no perf regression by running the following
```
./db_bench_opt -db=/dev/shm/rocksdb -use_existing_db=0 -level0_stop_writes_trigger=256 -level0_slowdown_writes_trigger=256 -level0_file_num_compaction_trigger=256 -disable_wal=1 -duration=10 -benchmarks=fillrandom
```
Before this PR
```
DB path: [/dev/shm/rocksdb]
fillrandom : 1.831 micros/op 546235 ops/sec; 60.4 MB/s
```
After this PR
```
DB path: [/dev/shm/rocksdb]
fillrandom : 1.820 micros/op 549404 ops/sec; 60.8 MB/s
```
Reviewed By: ltamasi
Differential Revision: D33721359
Pulled By: riversand963
fbshipit-source-id: c131561534272c120ffb80711d42748d21badf09
2 years ago
|
|
|
/*protection_bytes_per_key=*/0, user_timestamp_size_);
|
|
|
|
|
Duration duration(seq ? 0 : FLAGS_duration, deletes_);
|
|
|
|
|
int64_t i = 0;
|
|
|
|
|
std::unique_ptr<const char[]> key_guard;
|
|
|
|
|
Slice key = AllocateKey(&key_guard);
|
|
|
|
|
std::unique_ptr<char[]> ts_guard;
|
|
|
|
|
Slice ts;
|
|
|
|
|
if (user_timestamp_size_ > 0) {
|
|
|
|
|
ts_guard.reset(new char[user_timestamp_size_]);
|
|
|
|
|
}
|
|
|
|
|
|
|
|
|
|
while (!duration.Done(entries_per_batch_)) {
|
|
|
|
|
DB* db = SelectDB(thread);
|
|
|
|
|
batch.Clear();
|
|
|
|
|
for (int64_t j = 0; j < entries_per_batch_; ++j) {
|
|
|
|
|
const int64_t k = seq ? i + j : (thread->rand.Next() % FLAGS_num);
|
|
|
|
|
GenerateKeyFromInt(k, FLAGS_num, &key);
|
|
|
|
|
batch.Delete(key);
|
|
|
|
|
}
|
|
|
|
|
Status s;
|
|
|
|
|
if (user_timestamp_size_ > 0) {
|
|
|
|
|
ts = mock_app_clock_->Allocate(ts_guard.get());
|
Revise APIs related to user-defined timestamp (#8946)
Summary:
ajkr reminded me that we have a rule of not including per-kv related data in `WriteOptions`.
Namely, `WriteOptions` should not include information about "what-to-write", but should just
include information about "how-to-write".
According to this rule, `WriteOptions::timestamp` (experimental) is clearly a violation. Therefore,
this PR removes `WriteOptions::timestamp` for compliance.
After the removal, we need to pass timestamp info via another set of APIs. This PR proposes a set
of overloaded functions `Put(write_opts, key, value, ts)`, `Delete(write_opts, key, ts)`, and
`SingleDelete(write_opts, key, ts)`. Planned to add `Write(write_opts, batch, ts)`, but its complexity
made me reconsider doing it in another PR (maybe).
For better checking and returning error early, we also add a new set of APIs to `WriteBatch` that take
extra `timestamp` information when writing to `WriteBatch`es.
These set of APIs in `WriteBatchWithIndex` are currently not supported, and are on our TODO list.
Removed `WriteBatch::AssignTimestamps()` and renamed `WriteBatch::AssignTimestamp()` to
`WriteBatch::UpdateTimestamps()` since this method require that all keys have space for timestamps
allocated already and multiple timestamps can be updated.
The constructor of `WriteBatch` now takes a fourth argument `default_cf_ts_sz` which is the timestamp
size of the default column family. This will be used to allocate space when calling APIs that do not
specify a column family handle.
Also, updated `DB::Get()`, `DB::MultiGet()`, `DB::NewIterator()`, `DB::NewIterators()` methods, replacing
some assertions about timestamp to returning Status code.
Pull Request resolved: https://github.com/facebook/rocksdb/pull/8946
Test Plan:
make check
./db_bench -benchmarks=fillseq,fillrandom,readrandom,readseq,deleterandom -user_timestamp_size=8
./db_stress --user_timestamp_size=8 -nooverwritepercent=0 -test_secondary=0 -secondary_catch_up_one_in=0 -continuous_verification_interval=0
Make sure there is no perf regression by running the following
```
./db_bench_opt -db=/dev/shm/rocksdb -use_existing_db=0 -level0_stop_writes_trigger=256 -level0_slowdown_writes_trigger=256 -level0_file_num_compaction_trigger=256 -disable_wal=1 -duration=10 -benchmarks=fillrandom
```
Before this PR
```
DB path: [/dev/shm/rocksdb]
fillrandom : 1.831 micros/op 546235 ops/sec; 60.4 MB/s
```
After this PR
```
DB path: [/dev/shm/rocksdb]
fillrandom : 1.820 micros/op 549404 ops/sec; 60.8 MB/s
```
Reviewed By: ltamasi
Differential Revision: D33721359
Pulled By: riversand963
fbshipit-source-id: c131561534272c120ffb80711d42748d21badf09
2 years ago
|
|
|
s = batch.UpdateTimestamps(
|
|
|
|
|
ts, [this](uint32_t) { return user_timestamp_size_; });
|
|
|
|
|
if (!s.ok()) {
|
|
|
|
|
fprintf(stderr, "assign timestamp: %s\n", s.ToString().c_str());
|
|
|
|
|
ErrorExit();
|
|
|
|
|
}
|
|
|
|
|
}
|
|
|
|
|
s = db->Write(write_options_, &batch);
|
|
|
|
|
thread->stats.FinishedOps(nullptr, db, entries_per_batch_, kDelete);
|
|
|
|
|
if (!s.ok()) {
|
|
|
|
|
fprintf(stderr, "del error: %s\n", s.ToString().c_str());
|
|
|
|
|
exit(1);
|
|
|
|
|
}
|
|
|
|
|
i += entries_per_batch_;
|
|
|
|
|
}
|
|
|
|
|
}
|
|
|
|
|
|
|
|
|
|
void DeleteSeq(ThreadState* thread) {
|
|
|
|
|
DoDelete(thread, true);
|
|
|
|
|
}
|
|
|
|
|
|
|
|
|
|
void DeleteRandom(ThreadState* thread) {
|
|
|
|
|
DoDelete(thread, false);
|
|
|
|
|
}
|
|
|
|
|
|
|
|
|
|
void ReadWhileWriting(ThreadState* thread) {
|
|
|
|
|
if (thread->tid > 0) {
|
|
|
|
|
ReadRandom(thread);
|
|
|
|
|
} else {
|
|
|
|
|
BGWriter(thread, kWrite);
|
|
|
|
|
}
|
|
|
|
|
}
|
|
|
|
|
|
|
|
|
|
void ReadWhileMerging(ThreadState* thread) {
|
|
|
|
|
if (thread->tid > 0) {
|
|
|
|
|
ReadRandom(thread);
|
|
|
|
|
} else {
|
|
|
|
|
BGWriter(thread, kMerge);
|
|
|
|
|
}
|
|
|
|
|
}
|
|
|
|
|
|
|
|
|
|
void BGWriter(ThreadState* thread, enum OperationType write_merge) {
|
|
|
|
|
// Special thread that keeps writing until other threads are done.
|
|
|
|
|
RandomGenerator gen;
|
|
|
|
|
int64_t bytes = 0;
|
|
|
|
|
|
|
|
|
|
std::unique_ptr<RateLimiter> write_rate_limiter;
|
|
|
|
|
if (FLAGS_benchmark_write_rate_limit > 0) {
|
|
|
|
|
write_rate_limiter.reset(
|
|
|
|
|
NewGenericRateLimiter(FLAGS_benchmark_write_rate_limit));
|
|
|
|
|
}
|
|
|
|
|
|
|
|
|
|
// Don't merge stats from this thread with the readers.
|
|
|
|
|
thread->stats.SetExcludeFromMerge();
|
|
|
|
|
|
|
|
|
|
std::unique_ptr<const char[]> key_guard;
|
|
|
|
|
Slice key = AllocateKey(&key_guard);
|
|
|
|
|
std::unique_ptr<char[]> ts_guard;
|
|
|
|
|
if (user_timestamp_size_ > 0) {
|
|
|
|
|
ts_guard.reset(new char[user_timestamp_size_]);
|
|
|
|
|
}
|
|
|
|
|
uint32_t written = 0;
|
|
|
|
|
bool hint_printed = false;
|
|
|
|
|
|
|
|
|
|
while (true) {
|
|
|
|
|
DB* db = SelectDB(thread);
|
|
|
|
|
{
|
|
|
|
|
MutexLock l(&thread->shared->mu);
|
|
|
|
|
if (FLAGS_finish_after_writes && written == writes_) {
|
|
|
|
|
fprintf(stderr, "Exiting the writer after %u writes...\n", written);
|
|
|
|
|
break;
|
|
|
|
|
}
|
|
|
|
|
if (thread->shared->num_done + 1 >= thread->shared->num_initialized) {
|
|
|
|
|
// Other threads have finished
|
|
|
|
|
if (FLAGS_finish_after_writes) {
|
|
|
|
|
// Wait for the writes to be finished
|
|
|
|
|
if (!hint_printed) {
|
|
|
|
|
fprintf(stderr, "Reads are finished. Have %d more writes to do\n",
|
|
|
|
|
static_cast<int>(writes_) - written);
|
|
|
|
|
hint_printed = true;
|
|
|
|
|
}
|
|
|
|
|
} else {
|
|
|
|
|
// Finish the write immediately
|
|
|
|
|
break;
|
|
|
|
|
}
|
|
|
|
|
}
|
|
|
|
|
}
|
|
|
|
|
|
|
|
|
|
GenerateKeyFromInt(thread->rand.Next() % FLAGS_num, FLAGS_num, &key);
|
|
|
|
|
Status s;
|
|
|
|
|
|
|
|
|
|
Slice val = gen.Generate();
|
|
|
|
|
Slice ts;
|
|
|
|
|
if (user_timestamp_size_ > 0) {
|
|
|
|
|
ts = mock_app_clock_->Allocate(ts_guard.get());
|
|
|
|
|
}
|
|
|
|
|
if (write_merge == kWrite) {
|
Revise APIs related to user-defined timestamp (#8946)
Summary:
ajkr reminded me that we have a rule of not including per-kv related data in `WriteOptions`.
Namely, `WriteOptions` should not include information about "what-to-write", but should just
include information about "how-to-write".
According to this rule, `WriteOptions::timestamp` (experimental) is clearly a violation. Therefore,
this PR removes `WriteOptions::timestamp` for compliance.
After the removal, we need to pass timestamp info via another set of APIs. This PR proposes a set
of overloaded functions `Put(write_opts, key, value, ts)`, `Delete(write_opts, key, ts)`, and
`SingleDelete(write_opts, key, ts)`. Planned to add `Write(write_opts, batch, ts)`, but its complexity
made me reconsider doing it in another PR (maybe).
For better checking and returning error early, we also add a new set of APIs to `WriteBatch` that take
extra `timestamp` information when writing to `WriteBatch`es.
These set of APIs in `WriteBatchWithIndex` are currently not supported, and are on our TODO list.
Removed `WriteBatch::AssignTimestamps()` and renamed `WriteBatch::AssignTimestamp()` to
`WriteBatch::UpdateTimestamps()` since this method require that all keys have space for timestamps
allocated already and multiple timestamps can be updated.
The constructor of `WriteBatch` now takes a fourth argument `default_cf_ts_sz` which is the timestamp
size of the default column family. This will be used to allocate space when calling APIs that do not
specify a column family handle.
Also, updated `DB::Get()`, `DB::MultiGet()`, `DB::NewIterator()`, `DB::NewIterators()` methods, replacing
some assertions about timestamp to returning Status code.
Pull Request resolved: https://github.com/facebook/rocksdb/pull/8946
Test Plan:
make check
./db_bench -benchmarks=fillseq,fillrandom,readrandom,readseq,deleterandom -user_timestamp_size=8
./db_stress --user_timestamp_size=8 -nooverwritepercent=0 -test_secondary=0 -secondary_catch_up_one_in=0 -continuous_verification_interval=0
Make sure there is no perf regression by running the following
```
./db_bench_opt -db=/dev/shm/rocksdb -use_existing_db=0 -level0_stop_writes_trigger=256 -level0_slowdown_writes_trigger=256 -level0_file_num_compaction_trigger=256 -disable_wal=1 -duration=10 -benchmarks=fillrandom
```
Before this PR
```
DB path: [/dev/shm/rocksdb]
fillrandom : 1.831 micros/op 546235 ops/sec; 60.4 MB/s
```
After this PR
```
DB path: [/dev/shm/rocksdb]
fillrandom : 1.820 micros/op 549404 ops/sec; 60.8 MB/s
```
Reviewed By: ltamasi
Differential Revision: D33721359
Pulled By: riversand963
fbshipit-source-id: c131561534272c120ffb80711d42748d21badf09
2 years ago
|
|
|
if (user_timestamp_size_ == 0) {
|
|
|
|
|
s = db->Put(write_options_, key, val);
|
|
|
|
|
} else {
|
|
|
|
|
s = db->Put(write_options_, key, ts, val);
|
|
|
|
|
}
|
|
|
|
|
} else {
|
|
|
|
|
s = db->Merge(write_options_, key, val);
|
|
|
|
|
}
|
|
|
|
|
// Restore write_options_
|
|
|
|
|
written++;
|
|
|
|
|
|
|
|
|
|
if (!s.ok()) {
|
|
|
|
|
fprintf(stderr, "put or merge error: %s\n", s.ToString().c_str());
|
|
|
|
|
exit(1);
|
|
|
|
|
}
|
|
|
|
|
bytes += key.size() + val.size() + user_timestamp_size_;
|
|
|
|
|
thread->stats.FinishedOps(&db_, db_.db, 1, kWrite);
|
|
|
|
|
|
|
|
|
|
if (FLAGS_benchmark_write_rate_limit > 0) {
|
|
|
|
|
write_rate_limiter->Request(
|
|
|
|
|
key.size() + val.size(), Env::IO_HIGH,
|
|
|
|
|
nullptr /* stats */, RateLimiter::OpType::kWrite);
|
|
|
|
|
}
|
|
|
|
|
}
|
|
|
|
|
thread->stats.AddBytes(bytes);
|
|
|
|
|
}
|
|
|
|
|
|
|
|
|
|
void ReadWhileScanning(ThreadState* thread) {
|
|
|
|
|
if (thread->tid > 0) {
|
|
|
|
|
ReadRandom(thread);
|
|
|
|
|
} else {
|
|
|
|
|
BGScan(thread);
|
|
|
|
|
}
|
|
|
|
|
}
|
|
|
|
|
|
|
|
|
|
void BGScan(ThreadState* thread) {
|
|
|
|
|
if (FLAGS_num_multi_db > 0) {
|
|
|
|
|
fprintf(stderr, "Not supporting multiple DBs.\n");
|
|
|
|
|
abort();
|
|
|
|
|
}
|
|
|
|
|
assert(db_.db != nullptr);
|
|
|
|
|
ReadOptions read_options = read_options_;
|
|
|
|
|
std::unique_ptr<char[]> ts_guard;
|
|
|
|
|
Slice ts;
|
|
|
|
|
if (user_timestamp_size_ > 0) {
|
|
|
|
|
ts_guard.reset(new char[user_timestamp_size_]);
|
|
|
|
|
ts = mock_app_clock_->GetTimestampForRead(thread->rand, ts_guard.get());
|
|
|
|
|
read_options.timestamp = &ts;
|
|
|
|
|
}
|
|
|
|
|
Iterator* iter = db_.db->NewIterator(read_options);
|
|
|
|
|
|
|
|
|
|
fprintf(stderr, "num reads to do %" PRIu64 "\n", reads_);
|
|
|
|
|
Duration duration(FLAGS_duration, reads_);
|
|
|
|
|
uint64_t num_seek_to_first = 0;
|
|
|
|
|
uint64_t num_next = 0;
|
|
|
|
|
while (!duration.Done(1)) {
|
|
|
|
|
if (!iter->Valid()) {
|
|
|
|
|
iter->SeekToFirst();
|
|
|
|
|
num_seek_to_first++;
|
|
|
|
|
} else if (!iter->status().ok()) {
|
|
|
|
|
fprintf(stderr, "Iterator error: %s\n",
|
|
|
|
|
iter->status().ToString().c_str());
|
|
|
|
|
abort();
|
|
|
|
|
} else {
|
|
|
|
|
iter->Next();
|
|
|
|
|
num_next++;
|
|
|
|
|
}
|
|
|
|
|
|
|
|
|
|
thread->stats.FinishedOps(&db_, db_.db, 1, kSeek);
|
|
|
|
|
}
|
|
|
|
|
delete iter;
|
|
|
|
|
}
|
|
|
|
|
|
|
|
|
|
// Given a key K and value V, this puts (K+"0", V), (K+"1", V), (K+"2", V)
|
|
|
|
|
// in DB atomically i.e in a single batch. Also refer GetMany.
|
|
|
|
|
Status PutMany(DB* db, const WriteOptions& writeoptions, const Slice& key,
|
|
|
|
|
const Slice& value) {
|
|
|
|
|
std::string suffixes[3] = {"2", "1", "0"};
|
|
|
|
|
std::string keys[3];
|
|
|
|
|
|
|
|
|
|
WriteBatch batch(/*reserved_bytes=*/0, /*max_bytes=*/0,
|
Revise APIs related to user-defined timestamp (#8946)
Summary:
ajkr reminded me that we have a rule of not including per-kv related data in `WriteOptions`.
Namely, `WriteOptions` should not include information about "what-to-write", but should just
include information about "how-to-write".
According to this rule, `WriteOptions::timestamp` (experimental) is clearly a violation. Therefore,
this PR removes `WriteOptions::timestamp` for compliance.
After the removal, we need to pass timestamp info via another set of APIs. This PR proposes a set
of overloaded functions `Put(write_opts, key, value, ts)`, `Delete(write_opts, key, ts)`, and
`SingleDelete(write_opts, key, ts)`. Planned to add `Write(write_opts, batch, ts)`, but its complexity
made me reconsider doing it in another PR (maybe).
For better checking and returning error early, we also add a new set of APIs to `WriteBatch` that take
extra `timestamp` information when writing to `WriteBatch`es.
These set of APIs in `WriteBatchWithIndex` are currently not supported, and are on our TODO list.
Removed `WriteBatch::AssignTimestamps()` and renamed `WriteBatch::AssignTimestamp()` to
`WriteBatch::UpdateTimestamps()` since this method require that all keys have space for timestamps
allocated already and multiple timestamps can be updated.
The constructor of `WriteBatch` now takes a fourth argument `default_cf_ts_sz` which is the timestamp
size of the default column family. This will be used to allocate space when calling APIs that do not
specify a column family handle.
Also, updated `DB::Get()`, `DB::MultiGet()`, `DB::NewIterator()`, `DB::NewIterators()` methods, replacing
some assertions about timestamp to returning Status code.
Pull Request resolved: https://github.com/facebook/rocksdb/pull/8946
Test Plan:
make check
./db_bench -benchmarks=fillseq,fillrandom,readrandom,readseq,deleterandom -user_timestamp_size=8
./db_stress --user_timestamp_size=8 -nooverwritepercent=0 -test_secondary=0 -secondary_catch_up_one_in=0 -continuous_verification_interval=0
Make sure there is no perf regression by running the following
```
./db_bench_opt -db=/dev/shm/rocksdb -use_existing_db=0 -level0_stop_writes_trigger=256 -level0_slowdown_writes_trigger=256 -level0_file_num_compaction_trigger=256 -disable_wal=1 -duration=10 -benchmarks=fillrandom
```
Before this PR
```
DB path: [/dev/shm/rocksdb]
fillrandom : 1.831 micros/op 546235 ops/sec; 60.4 MB/s
```
After this PR
```
DB path: [/dev/shm/rocksdb]
fillrandom : 1.820 micros/op 549404 ops/sec; 60.8 MB/s
```
Reviewed By: ltamasi
Differential Revision: D33721359
Pulled By: riversand963
fbshipit-source-id: c131561534272c120ffb80711d42748d21badf09
2 years ago
|
|
|
/*protection_bytes_per_key=*/0, user_timestamp_size_);
|
|
|
|
|
Status s;
|
|
|
|
|
for (int i = 0; i < 3; i++) {
|
|
|
|
|
keys[i] = key.ToString() + suffixes[i];
|
|
|
|
|
batch.Put(keys[i], value);
|
|
|
|
|
}
|
|
|
|
|
|
|
|
|
|
std::unique_ptr<char[]> ts_guard;
|
|
|
|
|
if (user_timestamp_size_ > 0) {
|
|
|
|
|
ts_guard.reset(new char[user_timestamp_size_]);
|
|
|
|
|
Slice ts = mock_app_clock_->Allocate(ts_guard.get());
|
Revise APIs related to user-defined timestamp (#8946)
Summary:
ajkr reminded me that we have a rule of not including per-kv related data in `WriteOptions`.
Namely, `WriteOptions` should not include information about "what-to-write", but should just
include information about "how-to-write".
According to this rule, `WriteOptions::timestamp` (experimental) is clearly a violation. Therefore,
this PR removes `WriteOptions::timestamp` for compliance.
After the removal, we need to pass timestamp info via another set of APIs. This PR proposes a set
of overloaded functions `Put(write_opts, key, value, ts)`, `Delete(write_opts, key, ts)`, and
`SingleDelete(write_opts, key, ts)`. Planned to add `Write(write_opts, batch, ts)`, but its complexity
made me reconsider doing it in another PR (maybe).
For better checking and returning error early, we also add a new set of APIs to `WriteBatch` that take
extra `timestamp` information when writing to `WriteBatch`es.
These set of APIs in `WriteBatchWithIndex` are currently not supported, and are on our TODO list.
Removed `WriteBatch::AssignTimestamps()` and renamed `WriteBatch::AssignTimestamp()` to
`WriteBatch::UpdateTimestamps()` since this method require that all keys have space for timestamps
allocated already and multiple timestamps can be updated.
The constructor of `WriteBatch` now takes a fourth argument `default_cf_ts_sz` which is the timestamp
size of the default column family. This will be used to allocate space when calling APIs that do not
specify a column family handle.
Also, updated `DB::Get()`, `DB::MultiGet()`, `DB::NewIterator()`, `DB::NewIterators()` methods, replacing
some assertions about timestamp to returning Status code.
Pull Request resolved: https://github.com/facebook/rocksdb/pull/8946
Test Plan:
make check
./db_bench -benchmarks=fillseq,fillrandom,readrandom,readseq,deleterandom -user_timestamp_size=8
./db_stress --user_timestamp_size=8 -nooverwritepercent=0 -test_secondary=0 -secondary_catch_up_one_in=0 -continuous_verification_interval=0
Make sure there is no perf regression by running the following
```
./db_bench_opt -db=/dev/shm/rocksdb -use_existing_db=0 -level0_stop_writes_trigger=256 -level0_slowdown_writes_trigger=256 -level0_file_num_compaction_trigger=256 -disable_wal=1 -duration=10 -benchmarks=fillrandom
```
Before this PR
```
DB path: [/dev/shm/rocksdb]
fillrandom : 1.831 micros/op 546235 ops/sec; 60.4 MB/s
```
After this PR
```
DB path: [/dev/shm/rocksdb]
fillrandom : 1.820 micros/op 549404 ops/sec; 60.8 MB/s
```
Reviewed By: ltamasi
Differential Revision: D33721359
Pulled By: riversand963
fbshipit-source-id: c131561534272c120ffb80711d42748d21badf09
2 years ago
|
|
|
s = batch.UpdateTimestamps(
|
|
|
|
|
ts, [this](uint32_t) { return user_timestamp_size_; });
|
|
|
|
|
if (!s.ok()) {
|
|
|
|
|
fprintf(stderr, "assign timestamp to batch: %s\n",
|
|
|
|
|
s.ToString().c_str());
|
|
|
|
|
ErrorExit();
|
|
|
|
|
}
|
|
|
|
|
}
|
|
|
|
|
|
|
|
|
|
s = db->Write(writeoptions, &batch);
|
|
|
|
|
return s;
|
|
|
|
|
}
|
|
|
|
|
|
|
|
|
|
|
|
|
|
|
// Given a key K, this deletes (K+"0", V), (K+"1", V), (K+"2", V)
|
|
|
|
|
// in DB atomically i.e in a single batch. Also refer GetMany.
|
|
|
|
|
Status DeleteMany(DB* db, const WriteOptions& writeoptions,
|
|
|
|
|
const Slice& key) {
|
|
|
|
|
std::string suffixes[3] = {"1", "2", "0"};
|
|
|
|
|
std::string keys[3];
|
|
|
|
|
|
Revise APIs related to user-defined timestamp (#8946)
Summary:
ajkr reminded me that we have a rule of not including per-kv related data in `WriteOptions`.
Namely, `WriteOptions` should not include information about "what-to-write", but should just
include information about "how-to-write".
According to this rule, `WriteOptions::timestamp` (experimental) is clearly a violation. Therefore,
this PR removes `WriteOptions::timestamp` for compliance.
After the removal, we need to pass timestamp info via another set of APIs. This PR proposes a set
of overloaded functions `Put(write_opts, key, value, ts)`, `Delete(write_opts, key, ts)`, and
`SingleDelete(write_opts, key, ts)`. Planned to add `Write(write_opts, batch, ts)`, but its complexity
made me reconsider doing it in another PR (maybe).
For better checking and returning error early, we also add a new set of APIs to `WriteBatch` that take
extra `timestamp` information when writing to `WriteBatch`es.
These set of APIs in `WriteBatchWithIndex` are currently not supported, and are on our TODO list.
Removed `WriteBatch::AssignTimestamps()` and renamed `WriteBatch::AssignTimestamp()` to
`WriteBatch::UpdateTimestamps()` since this method require that all keys have space for timestamps
allocated already and multiple timestamps can be updated.
The constructor of `WriteBatch` now takes a fourth argument `default_cf_ts_sz` which is the timestamp
size of the default column family. This will be used to allocate space when calling APIs that do not
specify a column family handle.
Also, updated `DB::Get()`, `DB::MultiGet()`, `DB::NewIterator()`, `DB::NewIterators()` methods, replacing
some assertions about timestamp to returning Status code.
Pull Request resolved: https://github.com/facebook/rocksdb/pull/8946
Test Plan:
make check
./db_bench -benchmarks=fillseq,fillrandom,readrandom,readseq,deleterandom -user_timestamp_size=8
./db_stress --user_timestamp_size=8 -nooverwritepercent=0 -test_secondary=0 -secondary_catch_up_one_in=0 -continuous_verification_interval=0
Make sure there is no perf regression by running the following
```
./db_bench_opt -db=/dev/shm/rocksdb -use_existing_db=0 -level0_stop_writes_trigger=256 -level0_slowdown_writes_trigger=256 -level0_file_num_compaction_trigger=256 -disable_wal=1 -duration=10 -benchmarks=fillrandom
```
Before this PR
```
DB path: [/dev/shm/rocksdb]
fillrandom : 1.831 micros/op 546235 ops/sec; 60.4 MB/s
```
After this PR
```
DB path: [/dev/shm/rocksdb]
fillrandom : 1.820 micros/op 549404 ops/sec; 60.8 MB/s
```
Reviewed By: ltamasi
Differential Revision: D33721359
Pulled By: riversand963
fbshipit-source-id: c131561534272c120ffb80711d42748d21badf09
2 years ago
|
|
|
WriteBatch batch(0, 0, /*protection_bytes_per_key=*/0,
|
|
|
|
|
user_timestamp_size_);
|
|
|
|
|
Status s;
|
|
|
|
|
for (int i = 0; i < 3; i++) {
|
|
|
|
|
keys[i] = key.ToString() + suffixes[i];
|
|
|
|
|
batch.Delete(keys[i]);
|
|
|
|
|
}
|
|
|
|
|
|
|
|
|
|
std::unique_ptr<char[]> ts_guard;
|
|
|
|
|
if (user_timestamp_size_ > 0) {
|
|
|
|
|
ts_guard.reset(new char[user_timestamp_size_]);
|
|
|
|
|
Slice ts = mock_app_clock_->Allocate(ts_guard.get());
|
Revise APIs related to user-defined timestamp (#8946)
Summary:
ajkr reminded me that we have a rule of not including per-kv related data in `WriteOptions`.
Namely, `WriteOptions` should not include information about "what-to-write", but should just
include information about "how-to-write".
According to this rule, `WriteOptions::timestamp` (experimental) is clearly a violation. Therefore,
this PR removes `WriteOptions::timestamp` for compliance.
After the removal, we need to pass timestamp info via another set of APIs. This PR proposes a set
of overloaded functions `Put(write_opts, key, value, ts)`, `Delete(write_opts, key, ts)`, and
`SingleDelete(write_opts, key, ts)`. Planned to add `Write(write_opts, batch, ts)`, but its complexity
made me reconsider doing it in another PR (maybe).
For better checking and returning error early, we also add a new set of APIs to `WriteBatch` that take
extra `timestamp` information when writing to `WriteBatch`es.
These set of APIs in `WriteBatchWithIndex` are currently not supported, and are on our TODO list.
Removed `WriteBatch::AssignTimestamps()` and renamed `WriteBatch::AssignTimestamp()` to
`WriteBatch::UpdateTimestamps()` since this method require that all keys have space for timestamps
allocated already and multiple timestamps can be updated.
The constructor of `WriteBatch` now takes a fourth argument `default_cf_ts_sz` which is the timestamp
size of the default column family. This will be used to allocate space when calling APIs that do not
specify a column family handle.
Also, updated `DB::Get()`, `DB::MultiGet()`, `DB::NewIterator()`, `DB::NewIterators()` methods, replacing
some assertions about timestamp to returning Status code.
Pull Request resolved: https://github.com/facebook/rocksdb/pull/8946
Test Plan:
make check
./db_bench -benchmarks=fillseq,fillrandom,readrandom,readseq,deleterandom -user_timestamp_size=8
./db_stress --user_timestamp_size=8 -nooverwritepercent=0 -test_secondary=0 -secondary_catch_up_one_in=0 -continuous_verification_interval=0
Make sure there is no perf regression by running the following
```
./db_bench_opt -db=/dev/shm/rocksdb -use_existing_db=0 -level0_stop_writes_trigger=256 -level0_slowdown_writes_trigger=256 -level0_file_num_compaction_trigger=256 -disable_wal=1 -duration=10 -benchmarks=fillrandom
```
Before this PR
```
DB path: [/dev/shm/rocksdb]
fillrandom : 1.831 micros/op 546235 ops/sec; 60.4 MB/s
```
After this PR
```
DB path: [/dev/shm/rocksdb]
fillrandom : 1.820 micros/op 549404 ops/sec; 60.8 MB/s
```
Reviewed By: ltamasi
Differential Revision: D33721359
Pulled By: riversand963
fbshipit-source-id: c131561534272c120ffb80711d42748d21badf09
2 years ago
|
|
|
s = batch.UpdateTimestamps(
|
|
|
|
|
ts, [this](uint32_t) { return user_timestamp_size_; });
|
|
|
|
|
if (!s.ok()) {
|
|
|
|
|
fprintf(stderr, "assign timestamp to batch: %s\n",
|
|
|
|
|
s.ToString().c_str());
|
|
|
|
|
ErrorExit();
|
|
|
|
|
}
|
|
|
|
|
}
|
|
|
|
|
|
|
|
|
|
s = db->Write(writeoptions, &batch);
|
|
|
|
|
return s;
|
|
|
|
|
}
|
|
|
|
|
|
|
|
|
|
// Given a key K and value V, this gets values for K+"0", K+"1" and K+"2"
|
|
|
|
|
// in the same snapshot, and verifies that all the values are identical.
|
|
|
|
|
// ASSUMES that PutMany was used to put (K, V) into the DB.
|
|
|
|
|
Status GetMany(DB* db, const Slice& key, std::string* value) {
|
|
|
|
|
std::string suffixes[3] = {"0", "1", "2"};
|
|
|
|
|
std::string keys[3];
|
|
|
|
|
Slice key_slices[3];
|
|
|
|
|
std::string values[3];
|
|
|
|
|
ReadOptions readoptionscopy = read_options_;
|
|
|
|
|
|
|
|
|
|
std::unique_ptr<char[]> ts_guard;
|
|
|
|
|
Slice ts;
|
|
|
|
|
if (user_timestamp_size_ > 0) {
|
|
|
|
|
ts_guard.reset(new char[user_timestamp_size_]);
|
|
|
|
|
ts = mock_app_clock_->Allocate(ts_guard.get());
|
|
|
|
|
readoptionscopy.timestamp = &ts;
|
|
|
|
|
}
|
|
|
|
|
|
|
|
|
|
readoptionscopy.snapshot = db->GetSnapshot();
|
|
|
|
|
Status s;
|
|
|
|
|
for (int i = 0; i < 3; i++) {
|
|
|
|
|
keys[i] = key.ToString() + suffixes[i];
|
|
|
|
|
key_slices[i] = keys[i];
|
|
|
|
|
s = db->Get(readoptionscopy, key_slices[i], value);
|
|
|
|
|
if (!s.ok() && !s.IsNotFound()) {
|
|
|
|
|
fprintf(stderr, "get error: %s\n", s.ToString().c_str());
|
|
|
|
|
values[i] = "";
|
|
|
|
|
// we continue after error rather than exiting so that we can
|
|
|
|
|
// find more errors if any
|
|
|
|
|
} else if (s.IsNotFound()) {
|
|
|
|
|
values[i] = "";
|
|
|
|
|
} else {
|
|
|
|
|
values[i] = *value;
|
|
|
|
|
}
|
|
|
|
|
}
|
|
|
|
|
db->ReleaseSnapshot(readoptionscopy.snapshot);
|
|
|
|
|
|
|
|
|
|
if ((values[0] != values[1]) || (values[1] != values[2])) {
|
|
|
|
|
fprintf(stderr, "inconsistent values for key %s: %s, %s, %s\n",
|
|
|
|
|
key.ToString().c_str(), values[0].c_str(), values[1].c_str(),
|
|
|
|
|
values[2].c_str());
|
|
|
|
|
// we continue after error rather than exiting so that we can
|
|
|
|
|
// find more errors if any
|
|
|
|
|
}
|
|
|
|
|
|
|
|
|
|
return s;
|
|
|
|
|
}
|
|
|
|
|
|
|
|
|
|
// Differs from readrandomwriterandom in the following ways:
|
|
|
|
|
// (a) Uses GetMany/PutMany to read/write key values. Refer to those funcs.
|
|
|
|
|
// (b) Does deletes as well (per FLAGS_deletepercent)
|
|
|
|
|
// (c) In order to achieve high % of 'found' during lookups, and to do
|
|
|
|
|
// multiple writes (including puts and deletes) it uses upto
|
|
|
|
|
// FLAGS_numdistinct distinct keys instead of FLAGS_num distinct keys.
|
|
|
|
|
// (d) Does not have a MultiGet option.
|
|
|
|
|
void RandomWithVerify(ThreadState* thread) {
|
|
|
|
|
RandomGenerator gen;
|
|
|
|
|
std::string value;
|
|
|
|
|
int64_t found = 0;
|
|
|
|
|
int get_weight = 0;
|
|
|
|
|
int put_weight = 0;
|
|
|
|
|
int delete_weight = 0;
|
|
|
|
|
int64_t gets_done = 0;
|
|
|
|
|
int64_t puts_done = 0;
|
|
|
|
|
int64_t deletes_done = 0;
|
|
|
|
|
|
|
|
|
|
std::unique_ptr<const char[]> key_guard;
|
|
|
|
|
Slice key = AllocateKey(&key_guard);
|
|
|
|
|
|
|
|
|
|
// the number of iterations is the larger of read_ or write_
|
|
|
|
|
for (int64_t i = 0; i < readwrites_; i++) {
|
|
|
|
|
DB* db = SelectDB(thread);
|
|
|
|
|
if (get_weight == 0 && put_weight == 0 && delete_weight == 0) {
|
|
|
|
|
// one batch completed, reinitialize for next batch
|
|
|
|
|
get_weight = FLAGS_readwritepercent;
|
|
|
|
|
delete_weight = FLAGS_deletepercent;
|
|
|
|
|
put_weight = 100 - get_weight - delete_weight;
|
|
|
|
|
}
|
|
|
|
|
GenerateKeyFromInt(thread->rand.Next() % FLAGS_numdistinct,
|
|
|
|
|
FLAGS_numdistinct, &key);
|
|
|
|
|
if (get_weight > 0) {
|
|
|
|
|
// do all the gets first
|
|
|
|
|
Status s = GetMany(db, key, &value);
|
|
|
|
|
if (!s.ok() && !s.IsNotFound()) {
|
|
|
|
|
fprintf(stderr, "getmany error: %s\n", s.ToString().c_str());
|
|
|
|
|
// we continue after error rather than exiting so that we can
|
|
|
|
|
// find more errors if any
|
|
|
|
|
} else if (!s.IsNotFound()) {
|
|
|
|
|
found++;
|
|
|
|
|
}
|
|
|
|
|
get_weight--;
|
|
|
|
|
gets_done++;
|
|
|
|
|
thread->stats.FinishedOps(&db_, db_.db, 1, kRead);
|
|
|
|
|
} else if (put_weight > 0) {
|
|
|
|
|
// then do all the corresponding number of puts
|
|
|
|
|
// for all the gets we have done earlier
|
|
|
|
|
Status s = PutMany(db, write_options_, key, gen.Generate());
|
|
|
|
|
if (!s.ok()) {
|
|
|
|
|
fprintf(stderr, "putmany error: %s\n", s.ToString().c_str());
|
|
|
|
|
exit(1);
|
|
|
|
|
}
|
|
|
|
|
put_weight--;
|
|
|
|
|
puts_done++;
|
|
|
|
|
thread->stats.FinishedOps(&db_, db_.db, 1, kWrite);
|
|
|
|
|
} else if (delete_weight > 0) {
|
|
|
|
|
Status s = DeleteMany(db, write_options_, key);
|
|
|
|
|
if (!s.ok()) {
|
|
|
|
|
fprintf(stderr, "deletemany error: %s\n", s.ToString().c_str());
|
|
|
|
|
exit(1);
|
|
|
|
|
}
|
|
|
|
|
delete_weight--;
|
|
|
|
|
deletes_done++;
|
|
|
|
|
thread->stats.FinishedOps(&db_, db_.db, 1, kDelete);
|
|
|
|
|
}
|
|
|
|
|
}
|
|
|
|
|
char msg[128];
|
|
|
|
|
snprintf(msg, sizeof(msg),
|
|
|
|
|
"( get:%" PRIu64 " put:%" PRIu64 " del:%" PRIu64 " total:%" \
|
|
|
|
|
PRIu64 " found:%" PRIu64 ")",
|
|
|
|
|
gets_done, puts_done, deletes_done, readwrites_, found);
|
|
|
|
|
thread->stats.AddMessage(msg);
|
|
|
|
|
}
|
|
|
|
|
|
|
|
|
|
// This is different from ReadWhileWriting because it does not use
|
|
|
|
|
// an extra thread.
|
|
|
|
|
void ReadRandomWriteRandom(ThreadState* thread) {
|
|
|
|
|
ReadOptions options = read_options_;
|
|
|
|
|
RandomGenerator gen;
|
|
|
|
|
std::string value;
|
|
|
|
|
int64_t found = 0;
|
|
|
|
|
int get_weight = 0;
|
|
|
|
|
int put_weight = 0;
|
|
|
|
|
int64_t reads_done = 0;
|
|
|
|
|
int64_t writes_done = 0;
|
|
|
|
|
Duration duration(FLAGS_duration, readwrites_);
|
|
|
|
|
|
|
|
|
|
std::unique_ptr<const char[]> key_guard;
|
|
|
|
|
Slice key = AllocateKey(&key_guard);
|
|
|
|
|
|
|
|
|
|
std::unique_ptr<char[]> ts_guard;
|
|
|
|
|
if (user_timestamp_size_ > 0) {
|
|
|
|
|
ts_guard.reset(new char[user_timestamp_size_]);
|
|
|
|
|
}
|
|
|
|
|
|
|
|
|
|
// the number of iterations is the larger of read_ or write_
|
|
|
|
|
while (!duration.Done(1)) {
|
|
|
|
|
DB* db = SelectDB(thread);
|
|
|
|
|
GenerateKeyFromInt(thread->rand.Next() % FLAGS_num, FLAGS_num, &key);
|
|
|
|
|
if (get_weight == 0 && put_weight == 0) {
|
|
|
|
|
// one batch completed, reinitialize for next batch
|
|
|
|
|
get_weight = FLAGS_readwritepercent;
|
|
|
|
|
put_weight = 100 - get_weight;
|
|
|
|
|
}
|
|
|
|
|
if (get_weight > 0) {
|
|
|
|
|
// do all the gets first
|
|
|
|
|
Slice ts;
|
|
|
|
|
if (user_timestamp_size_ > 0) {
|
|
|
|
|
ts = mock_app_clock_->GetTimestampForRead(thread->rand,
|
|
|
|
|
ts_guard.get());
|
|
|
|
|
options.timestamp = &ts;
|
|
|
|
|
}
|
|
|
|
|
Status s = db->Get(options, key, &value);
|
|
|
|
|
if (!s.ok() && !s.IsNotFound()) {
|
|
|
|
|
fprintf(stderr, "get error: %s\n", s.ToString().c_str());
|
|
|
|
|
// we continue after error rather than exiting so that we can
|
|
|
|
|
// find more errors if any
|
|
|
|
|
} else if (!s.IsNotFound()) {
|
|
|
|
|
found++;
|
|
|
|
|
}
|
|
|
|
|
get_weight--;
|
|
|
|
|
reads_done++;
|
|
|
|
|
thread->stats.FinishedOps(nullptr, db, 1, kRead);
|
|
|
|
|
} else if (put_weight > 0) {
|
|
|
|
|
// then do all the corresponding number of puts
|
|
|
|
|
// for all the gets we have done earlier
|
Revise APIs related to user-defined timestamp (#8946)
Summary:
ajkr reminded me that we have a rule of not including per-kv related data in `WriteOptions`.
Namely, `WriteOptions` should not include information about "what-to-write", but should just
include information about "how-to-write".
According to this rule, `WriteOptions::timestamp` (experimental) is clearly a violation. Therefore,
this PR removes `WriteOptions::timestamp` for compliance.
After the removal, we need to pass timestamp info via another set of APIs. This PR proposes a set
of overloaded functions `Put(write_opts, key, value, ts)`, `Delete(write_opts, key, ts)`, and
`SingleDelete(write_opts, key, ts)`. Planned to add `Write(write_opts, batch, ts)`, but its complexity
made me reconsider doing it in another PR (maybe).
For better checking and returning error early, we also add a new set of APIs to `WriteBatch` that take
extra `timestamp` information when writing to `WriteBatch`es.
These set of APIs in `WriteBatchWithIndex` are currently not supported, and are on our TODO list.
Removed `WriteBatch::AssignTimestamps()` and renamed `WriteBatch::AssignTimestamp()` to
`WriteBatch::UpdateTimestamps()` since this method require that all keys have space for timestamps
allocated already and multiple timestamps can be updated.
The constructor of `WriteBatch` now takes a fourth argument `default_cf_ts_sz` which is the timestamp
size of the default column family. This will be used to allocate space when calling APIs that do not
specify a column family handle.
Also, updated `DB::Get()`, `DB::MultiGet()`, `DB::NewIterator()`, `DB::NewIterators()` methods, replacing
some assertions about timestamp to returning Status code.
Pull Request resolved: https://github.com/facebook/rocksdb/pull/8946
Test Plan:
make check
./db_bench -benchmarks=fillseq,fillrandom,readrandom,readseq,deleterandom -user_timestamp_size=8
./db_stress --user_timestamp_size=8 -nooverwritepercent=0 -test_secondary=0 -secondary_catch_up_one_in=0 -continuous_verification_interval=0
Make sure there is no perf regression by running the following
```
./db_bench_opt -db=/dev/shm/rocksdb -use_existing_db=0 -level0_stop_writes_trigger=256 -level0_slowdown_writes_trigger=256 -level0_file_num_compaction_trigger=256 -disable_wal=1 -duration=10 -benchmarks=fillrandom
```
Before this PR
```
DB path: [/dev/shm/rocksdb]
fillrandom : 1.831 micros/op 546235 ops/sec; 60.4 MB/s
```
After this PR
```
DB path: [/dev/shm/rocksdb]
fillrandom : 1.820 micros/op 549404 ops/sec; 60.8 MB/s
```
Reviewed By: ltamasi
Differential Revision: D33721359
Pulled By: riversand963
fbshipit-source-id: c131561534272c120ffb80711d42748d21badf09
2 years ago
|
|
|
Status s;
|
|
|
|
|
if (user_timestamp_size_ > 0) {
|
Revise APIs related to user-defined timestamp (#8946)
Summary:
ajkr reminded me that we have a rule of not including per-kv related data in `WriteOptions`.
Namely, `WriteOptions` should not include information about "what-to-write", but should just
include information about "how-to-write".
According to this rule, `WriteOptions::timestamp` (experimental) is clearly a violation. Therefore,
this PR removes `WriteOptions::timestamp` for compliance.
After the removal, we need to pass timestamp info via another set of APIs. This PR proposes a set
of overloaded functions `Put(write_opts, key, value, ts)`, `Delete(write_opts, key, ts)`, and
`SingleDelete(write_opts, key, ts)`. Planned to add `Write(write_opts, batch, ts)`, but its complexity
made me reconsider doing it in another PR (maybe).
For better checking and returning error early, we also add a new set of APIs to `WriteBatch` that take
extra `timestamp` information when writing to `WriteBatch`es.
These set of APIs in `WriteBatchWithIndex` are currently not supported, and are on our TODO list.
Removed `WriteBatch::AssignTimestamps()` and renamed `WriteBatch::AssignTimestamp()` to
`WriteBatch::UpdateTimestamps()` since this method require that all keys have space for timestamps
allocated already and multiple timestamps can be updated.
The constructor of `WriteBatch` now takes a fourth argument `default_cf_ts_sz` which is the timestamp
size of the default column family. This will be used to allocate space when calling APIs that do not
specify a column family handle.
Also, updated `DB::Get()`, `DB::MultiGet()`, `DB::NewIterator()`, `DB::NewIterators()` methods, replacing
some assertions about timestamp to returning Status code.
Pull Request resolved: https://github.com/facebook/rocksdb/pull/8946
Test Plan:
make check
./db_bench -benchmarks=fillseq,fillrandom,readrandom,readseq,deleterandom -user_timestamp_size=8
./db_stress --user_timestamp_size=8 -nooverwritepercent=0 -test_secondary=0 -secondary_catch_up_one_in=0 -continuous_verification_interval=0
Make sure there is no perf regression by running the following
```
./db_bench_opt -db=/dev/shm/rocksdb -use_existing_db=0 -level0_stop_writes_trigger=256 -level0_slowdown_writes_trigger=256 -level0_file_num_compaction_trigger=256 -disable_wal=1 -duration=10 -benchmarks=fillrandom
```
Before this PR
```
DB path: [/dev/shm/rocksdb]
fillrandom : 1.831 micros/op 546235 ops/sec; 60.4 MB/s
```
After this PR
```
DB path: [/dev/shm/rocksdb]
fillrandom : 1.820 micros/op 549404 ops/sec; 60.8 MB/s
```
Reviewed By: ltamasi
Differential Revision: D33721359
Pulled By: riversand963
fbshipit-source-id: c131561534272c120ffb80711d42748d21badf09
2 years ago
|
|
|
Slice ts = mock_app_clock_->Allocate(ts_guard.get());
|
|
|
|
|
s = db->Put(write_options_, key, ts, gen.Generate());
|
|
|
|
|
} else {
|
|
|
|
|
s = db->Put(write_options_, key, gen.Generate());
|
|
|
|
|
}
|
|
|
|
|
if (!s.ok()) {
|
|
|
|
|
fprintf(stderr, "put error: %s\n", s.ToString().c_str());
|
|
|
|
|
ErrorExit();
|
|
|
|
|
}
|
|
|
|
|
put_weight--;
|
|
|
|
|
writes_done++;
|
|
|
|
|
thread->stats.FinishedOps(nullptr, db, 1, kWrite);
|
|
|
|
|
}
|
|
|
|
|
}
|
|
|
|
|
char msg[100];
|
|
|
|
|
snprintf(msg, sizeof(msg), "( reads:%" PRIu64 " writes:%" PRIu64 \
|
|
|
|
|
" total:%" PRIu64 " found:%" PRIu64 ")",
|
|
|
|
|
reads_done, writes_done, readwrites_, found);
|
|
|
|
|
thread->stats.AddMessage(msg);
|
|
|
|
|
}
|
|
|
|
|
|
|
|
|
|
//
|
|
|
|
|
// Read-modify-write for random keys
|
|
|
|
|
void UpdateRandom(ThreadState* thread) {
|
|
|
|
|
ReadOptions options = read_options_;
|
|
|
|
|
RandomGenerator gen;
|
|
|
|
|
std::string value;
|
|
|
|
|
int64_t found = 0;
|
|
|
|
|
int64_t bytes = 0;
|
|
|
|
|
Duration duration(FLAGS_duration, readwrites_);
|
|
|
|
|
|
|
|
|
|
std::unique_ptr<const char[]> key_guard;
|
|
|
|
|
Slice key = AllocateKey(&key_guard);
|
|
|
|
|
std::unique_ptr<char[]> ts_guard;
|
|
|
|
|
if (user_timestamp_size_ > 0) {
|
|
|
|
|
ts_guard.reset(new char[user_timestamp_size_]);
|
|
|
|
|
}
|
|
|
|
|
// the number of iterations is the larger of read_ or write_
|
|
|
|
|
while (!duration.Done(1)) {
|
|
|
|
|
DB* db = SelectDB(thread);
|
|
|
|
|
GenerateKeyFromInt(thread->rand.Next() % FLAGS_num, FLAGS_num, &key);
|
|
|
|
|
Slice ts;
|
|
|
|
|
if (user_timestamp_size_ > 0) {
|
|
|
|
|
// Read with newest timestamp because we are doing rmw.
|
|
|
|
|
ts = mock_app_clock_->Allocate(ts_guard.get());
|
|
|
|
|
options.timestamp = &ts;
|
|
|
|
|
}
|
|
|
|
|
|
|
|
|
|
auto status = db->Get(options, key, &value);
|
|
|
|
|
if (status.ok()) {
|
|
|
|
|
++found;
|
|
|
|
|
bytes += key.size() + value.size() + user_timestamp_size_;
|
|
|
|
|
} else if (!status.IsNotFound()) {
|
|
|
|
|
fprintf(stderr, "Get returned an error: %s\n",
|
|
|
|
|
status.ToString().c_str());
|
|
|
|
|
abort();
|
|
|
|
|
}
|
|
|
|
|
|
|
|
|
|
if (thread->shared->write_rate_limiter) {
|
|
|
|
|
thread->shared->write_rate_limiter->Request(
|
|
|
|
|
key.size() + value.size(), Env::IO_HIGH, nullptr /*stats*/,
|
|
|
|
|
RateLimiter::OpType::kWrite);
|
|
|
|
|
}
|
|
|
|
|
|
|
|
|
|
Slice val = gen.Generate();
|
Revise APIs related to user-defined timestamp (#8946)
Summary:
ajkr reminded me that we have a rule of not including per-kv related data in `WriteOptions`.
Namely, `WriteOptions` should not include information about "what-to-write", but should just
include information about "how-to-write".
According to this rule, `WriteOptions::timestamp` (experimental) is clearly a violation. Therefore,
this PR removes `WriteOptions::timestamp` for compliance.
After the removal, we need to pass timestamp info via another set of APIs. This PR proposes a set
of overloaded functions `Put(write_opts, key, value, ts)`, `Delete(write_opts, key, ts)`, and
`SingleDelete(write_opts, key, ts)`. Planned to add `Write(write_opts, batch, ts)`, but its complexity
made me reconsider doing it in another PR (maybe).
For better checking and returning error early, we also add a new set of APIs to `WriteBatch` that take
extra `timestamp` information when writing to `WriteBatch`es.
These set of APIs in `WriteBatchWithIndex` are currently not supported, and are on our TODO list.
Removed `WriteBatch::AssignTimestamps()` and renamed `WriteBatch::AssignTimestamp()` to
`WriteBatch::UpdateTimestamps()` since this method require that all keys have space for timestamps
allocated already and multiple timestamps can be updated.
The constructor of `WriteBatch` now takes a fourth argument `default_cf_ts_sz` which is the timestamp
size of the default column family. This will be used to allocate space when calling APIs that do not
specify a column family handle.
Also, updated `DB::Get()`, `DB::MultiGet()`, `DB::NewIterator()`, `DB::NewIterators()` methods, replacing
some assertions about timestamp to returning Status code.
Pull Request resolved: https://github.com/facebook/rocksdb/pull/8946
Test Plan:
make check
./db_bench -benchmarks=fillseq,fillrandom,readrandom,readseq,deleterandom -user_timestamp_size=8
./db_stress --user_timestamp_size=8 -nooverwritepercent=0 -test_secondary=0 -secondary_catch_up_one_in=0 -continuous_verification_interval=0
Make sure there is no perf regression by running the following
```
./db_bench_opt -db=/dev/shm/rocksdb -use_existing_db=0 -level0_stop_writes_trigger=256 -level0_slowdown_writes_trigger=256 -level0_file_num_compaction_trigger=256 -disable_wal=1 -duration=10 -benchmarks=fillrandom
```
Before this PR
```
DB path: [/dev/shm/rocksdb]
fillrandom : 1.831 micros/op 546235 ops/sec; 60.4 MB/s
```
After this PR
```
DB path: [/dev/shm/rocksdb]
fillrandom : 1.820 micros/op 549404 ops/sec; 60.8 MB/s
```
Reviewed By: ltamasi
Differential Revision: D33721359
Pulled By: riversand963
fbshipit-source-id: c131561534272c120ffb80711d42748d21badf09
2 years ago
|
|
|
Status s;
|
|
|
|
|
if (user_timestamp_size_ > 0) {
|
|
|
|
|
ts = mock_app_clock_->Allocate(ts_guard.get());
|
Revise APIs related to user-defined timestamp (#8946)
Summary:
ajkr reminded me that we have a rule of not including per-kv related data in `WriteOptions`.
Namely, `WriteOptions` should not include information about "what-to-write", but should just
include information about "how-to-write".
According to this rule, `WriteOptions::timestamp` (experimental) is clearly a violation. Therefore,
this PR removes `WriteOptions::timestamp` for compliance.
After the removal, we need to pass timestamp info via another set of APIs. This PR proposes a set
of overloaded functions `Put(write_opts, key, value, ts)`, `Delete(write_opts, key, ts)`, and
`SingleDelete(write_opts, key, ts)`. Planned to add `Write(write_opts, batch, ts)`, but its complexity
made me reconsider doing it in another PR (maybe).
For better checking and returning error early, we also add a new set of APIs to `WriteBatch` that take
extra `timestamp` information when writing to `WriteBatch`es.
These set of APIs in `WriteBatchWithIndex` are currently not supported, and are on our TODO list.
Removed `WriteBatch::AssignTimestamps()` and renamed `WriteBatch::AssignTimestamp()` to
`WriteBatch::UpdateTimestamps()` since this method require that all keys have space for timestamps
allocated already and multiple timestamps can be updated.
The constructor of `WriteBatch` now takes a fourth argument `default_cf_ts_sz` which is the timestamp
size of the default column family. This will be used to allocate space when calling APIs that do not
specify a column family handle.
Also, updated `DB::Get()`, `DB::MultiGet()`, `DB::NewIterator()`, `DB::NewIterators()` methods, replacing
some assertions about timestamp to returning Status code.
Pull Request resolved: https://github.com/facebook/rocksdb/pull/8946
Test Plan:
make check
./db_bench -benchmarks=fillseq,fillrandom,readrandom,readseq,deleterandom -user_timestamp_size=8
./db_stress --user_timestamp_size=8 -nooverwritepercent=0 -test_secondary=0 -secondary_catch_up_one_in=0 -continuous_verification_interval=0
Make sure there is no perf regression by running the following
```
./db_bench_opt -db=/dev/shm/rocksdb -use_existing_db=0 -level0_stop_writes_trigger=256 -level0_slowdown_writes_trigger=256 -level0_file_num_compaction_trigger=256 -disable_wal=1 -duration=10 -benchmarks=fillrandom
```
Before this PR
```
DB path: [/dev/shm/rocksdb]
fillrandom : 1.831 micros/op 546235 ops/sec; 60.4 MB/s
```
After this PR
```
DB path: [/dev/shm/rocksdb]
fillrandom : 1.820 micros/op 549404 ops/sec; 60.8 MB/s
```
Reviewed By: ltamasi
Differential Revision: D33721359
Pulled By: riversand963
fbshipit-source-id: c131561534272c120ffb80711d42748d21badf09
2 years ago
|
|
|
s = db->Put(write_options_, key, ts, val);
|
|
|
|
|
} else {
|
|
|
|
|
s = db->Put(write_options_, key, val);
|
|
|
|
|
}
|
|
|
|
|
if (!s.ok()) {
|
|
|
|
|
fprintf(stderr, "put error: %s\n", s.ToString().c_str());
|
|
|
|
|
exit(1);
|
|
|
|
|
}
|
|
|
|
|
bytes += key.size() + val.size() + user_timestamp_size_;
|
|
|
|
|
thread->stats.FinishedOps(nullptr, db, 1, kUpdate);
|
|
|
|
|
}
|
|
|
|
|
char msg[100];
|
|
|
|
|
snprintf(msg, sizeof(msg),
|
|
|
|
|
"( updates:%" PRIu64 " found:%" PRIu64 ")", readwrites_, found);
|
|
|
|
|
thread->stats.AddBytes(bytes);
|
|
|
|
|
thread->stats.AddMessage(msg);
|
|
|
|
|
}
|
|
|
|
|
|
|
|
|
|
// Read-XOR-write for random keys. Xors the existing value with a randomly
|
|
|
|
|
// generated value, and stores the result. Assuming A in the array of bytes
|
|
|
|
|
// representing the existing value, we generate an array B of the same size,
|
|
|
|
|
// then compute C = A^B as C[i]=A[i]^B[i], and store C
|
|
|
|
|
void XORUpdateRandom(ThreadState* thread) {
|
|
|
|
|
ReadOptions options = read_options_;
|
|
|
|
|
RandomGenerator gen;
|
|
|
|
|
std::string existing_value;
|
|
|
|
|
int64_t found = 0;
|
|
|
|
|
Duration duration(FLAGS_duration, readwrites_);
|
|
|
|
|
|
|
|
|
|
BytesXOROperator xor_operator;
|
|
|
|
|
|
|
|
|
|
std::unique_ptr<const char[]> key_guard;
|
|
|
|
|
Slice key = AllocateKey(&key_guard);
|
|
|
|
|
std::unique_ptr<char[]> ts_guard;
|
|
|
|
|
if (user_timestamp_size_ > 0) {
|
|
|
|
|
ts_guard.reset(new char[user_timestamp_size_]);
|
|
|
|
|
}
|
|
|
|
|
// the number of iterations is the larger of read_ or write_
|
|
|
|
|
while (!duration.Done(1)) {
|
|
|
|
|
DB* db = SelectDB(thread);
|
|
|
|
|
GenerateKeyFromInt(thread->rand.Next() % FLAGS_num, FLAGS_num, &key);
|
|
|
|
|
Slice ts;
|
|
|
|
|
if (user_timestamp_size_ > 0) {
|
|
|
|
|
ts = mock_app_clock_->Allocate(ts_guard.get());
|
|
|
|
|
options.timestamp = &ts;
|
|
|
|
|
}
|
|
|
|
|
|
|
|
|
|
auto status = db->Get(options, key, &existing_value);
|
|
|
|
|
if (status.ok()) {
|
|
|
|
|
++found;
|
|
|
|
|
} else if (!status.IsNotFound()) {
|
|
|
|
|
fprintf(stderr, "Get returned an error: %s\n",
|
|
|
|
|
status.ToString().c_str());
|
|
|
|
|
exit(1);
|
|
|
|
|
}
|
|
|
|
|
|
|
|
|
|
Slice value = gen.Generate(static_cast<unsigned int>(existing_value.size()));
|
|
|
|
|
std::string new_value;
|
|
|
|
|
|
|
|
|
|
if (status.ok()) {
|
|
|
|
|
Slice existing_value_slice = Slice(existing_value);
|
|
|
|
|
xor_operator.XOR(&existing_value_slice, value, &new_value);
|
|
|
|
|
} else {
|
|
|
|
|
xor_operator.XOR(nullptr, value, &new_value);
|
|
|
|
|
}
|
|
|
|
|
|
Revise APIs related to user-defined timestamp (#8946)
Summary:
ajkr reminded me that we have a rule of not including per-kv related data in `WriteOptions`.
Namely, `WriteOptions` should not include information about "what-to-write", but should just
include information about "how-to-write".
According to this rule, `WriteOptions::timestamp` (experimental) is clearly a violation. Therefore,
this PR removes `WriteOptions::timestamp` for compliance.
After the removal, we need to pass timestamp info via another set of APIs. This PR proposes a set
of overloaded functions `Put(write_opts, key, value, ts)`, `Delete(write_opts, key, ts)`, and
`SingleDelete(write_opts, key, ts)`. Planned to add `Write(write_opts, batch, ts)`, but its complexity
made me reconsider doing it in another PR (maybe).
For better checking and returning error early, we also add a new set of APIs to `WriteBatch` that take
extra `timestamp` information when writing to `WriteBatch`es.
These set of APIs in `WriteBatchWithIndex` are currently not supported, and are on our TODO list.
Removed `WriteBatch::AssignTimestamps()` and renamed `WriteBatch::AssignTimestamp()` to
`WriteBatch::UpdateTimestamps()` since this method require that all keys have space for timestamps
allocated already and multiple timestamps can be updated.
The constructor of `WriteBatch` now takes a fourth argument `default_cf_ts_sz` which is the timestamp
size of the default column family. This will be used to allocate space when calling APIs that do not
specify a column family handle.
Also, updated `DB::Get()`, `DB::MultiGet()`, `DB::NewIterator()`, `DB::NewIterators()` methods, replacing
some assertions about timestamp to returning Status code.
Pull Request resolved: https://github.com/facebook/rocksdb/pull/8946
Test Plan:
make check
./db_bench -benchmarks=fillseq,fillrandom,readrandom,readseq,deleterandom -user_timestamp_size=8
./db_stress --user_timestamp_size=8 -nooverwritepercent=0 -test_secondary=0 -secondary_catch_up_one_in=0 -continuous_verification_interval=0
Make sure there is no perf regression by running the following
```
./db_bench_opt -db=/dev/shm/rocksdb -use_existing_db=0 -level0_stop_writes_trigger=256 -level0_slowdown_writes_trigger=256 -level0_file_num_compaction_trigger=256 -disable_wal=1 -duration=10 -benchmarks=fillrandom
```
Before this PR
```
DB path: [/dev/shm/rocksdb]
fillrandom : 1.831 micros/op 546235 ops/sec; 60.4 MB/s
```
After this PR
```
DB path: [/dev/shm/rocksdb]
fillrandom : 1.820 micros/op 549404 ops/sec; 60.8 MB/s
```
Reviewed By: ltamasi
Differential Revision: D33721359
Pulled By: riversand963
fbshipit-source-id: c131561534272c120ffb80711d42748d21badf09
2 years ago
|
|
|
Status s;
|
|
|
|
|
if (user_timestamp_size_ > 0) {
|
|
|
|
|
ts = mock_app_clock_->Allocate(ts_guard.get());
|
Revise APIs related to user-defined timestamp (#8946)
Summary:
ajkr reminded me that we have a rule of not including per-kv related data in `WriteOptions`.
Namely, `WriteOptions` should not include information about "what-to-write", but should just
include information about "how-to-write".
According to this rule, `WriteOptions::timestamp` (experimental) is clearly a violation. Therefore,
this PR removes `WriteOptions::timestamp` for compliance.
After the removal, we need to pass timestamp info via another set of APIs. This PR proposes a set
of overloaded functions `Put(write_opts, key, value, ts)`, `Delete(write_opts, key, ts)`, and
`SingleDelete(write_opts, key, ts)`. Planned to add `Write(write_opts, batch, ts)`, but its complexity
made me reconsider doing it in another PR (maybe).
For better checking and returning error early, we also add a new set of APIs to `WriteBatch` that take
extra `timestamp` information when writing to `WriteBatch`es.
These set of APIs in `WriteBatchWithIndex` are currently not supported, and are on our TODO list.
Removed `WriteBatch::AssignTimestamps()` and renamed `WriteBatch::AssignTimestamp()` to
`WriteBatch::UpdateTimestamps()` since this method require that all keys have space for timestamps
allocated already and multiple timestamps can be updated.
The constructor of `WriteBatch` now takes a fourth argument `default_cf_ts_sz` which is the timestamp
size of the default column family. This will be used to allocate space when calling APIs that do not
specify a column family handle.
Also, updated `DB::Get()`, `DB::MultiGet()`, `DB::NewIterator()`, `DB::NewIterators()` methods, replacing
some assertions about timestamp to returning Status code.
Pull Request resolved: https://github.com/facebook/rocksdb/pull/8946
Test Plan:
make check
./db_bench -benchmarks=fillseq,fillrandom,readrandom,readseq,deleterandom -user_timestamp_size=8
./db_stress --user_timestamp_size=8 -nooverwritepercent=0 -test_secondary=0 -secondary_catch_up_one_in=0 -continuous_verification_interval=0
Make sure there is no perf regression by running the following
```
./db_bench_opt -db=/dev/shm/rocksdb -use_existing_db=0 -level0_stop_writes_trigger=256 -level0_slowdown_writes_trigger=256 -level0_file_num_compaction_trigger=256 -disable_wal=1 -duration=10 -benchmarks=fillrandom
```
Before this PR
```
DB path: [/dev/shm/rocksdb]
fillrandom : 1.831 micros/op 546235 ops/sec; 60.4 MB/s
```
After this PR
```
DB path: [/dev/shm/rocksdb]
fillrandom : 1.820 micros/op 549404 ops/sec; 60.8 MB/s
```
Reviewed By: ltamasi
Differential Revision: D33721359
Pulled By: riversand963
fbshipit-source-id: c131561534272c120ffb80711d42748d21badf09
2 years ago
|
|
|
s = db->Put(write_options_, key, ts, Slice(new_value));
|
|
|
|
|
} else {
|
|
|
|
|
s = db->Put(write_options_, key, Slice(new_value));
|
|
|
|
|
}
|
|
|
|
|
if (!s.ok()) {
|
|
|
|
|
fprintf(stderr, "put error: %s\n", s.ToString().c_str());
|
|
|
|
|
ErrorExit();
|
|
|
|
|
}
|
|
|
|
|
thread->stats.FinishedOps(nullptr, db, 1);
|
|
|
|
|
}
|
|
|
|
|
char msg[100];
|
|
|
|
|
snprintf(msg, sizeof(msg),
|
|
|
|
|
"( updates:%" PRIu64 " found:%" PRIu64 ")", readwrites_, found);
|
|
|
|
|
thread->stats.AddMessage(msg);
|
|
|
|
|
}
|
|
|
|
|
|
Benchmarking for Merge Operator
Summary:
Updated db_bench and utilities/merge_operators.h to allow for dynamic benchmarking
of merge operators in db_bench. Added a new test (--benchmarks=mergerandom), which performs
a bunch of random Merge() operations over random keys. Also added a "--merge_operator=" flag
so that the tester can easily benchmark different merge operators. Currently supports
the PutOperator and UInt64Add operator. Support for stringappend or list append may come later.
Test Plan:
1. make db_bench
2. Test the PutOperator (simulating Put) as follows:
./db_bench --benchmarks=fillrandom,readrandom,updaterandom,readrandom,mergerandom,readrandom --merge_operator=put
--threads=2
3. Test the UInt64AddOperator (simulating numeric addition) similarly:
./db_bench --value_size=8 --benchmarks=fillrandom,readrandom,updaterandom,readrandom,mergerandom,readrandom
--merge_operator=uint64add --threads=2
Reviewers: haobo, dhruba, zshao, MarkCallaghan
Reviewed By: haobo
CC: leveldb
Differential Revision: https://reviews.facebook.net/D11535
11 years ago
|
|
|
// Read-modify-write for random keys.
|
|
|
|
|
// Each operation causes the key grow by value_size (simulating an append).
|
|
|
|
|
// Generally used for benchmarking against merges of similar type
|
|
|
|
|
void AppendRandom(ThreadState* thread) {
|
|
|
|
|
ReadOptions options = read_options_;
|
Benchmarking for Merge Operator
Summary:
Updated db_bench and utilities/merge_operators.h to allow for dynamic benchmarking
of merge operators in db_bench. Added a new test (--benchmarks=mergerandom), which performs
a bunch of random Merge() operations over random keys. Also added a "--merge_operator=" flag
so that the tester can easily benchmark different merge operators. Currently supports
the PutOperator and UInt64Add operator. Support for stringappend or list append may come later.
Test Plan:
1. make db_bench
2. Test the PutOperator (simulating Put) as follows:
./db_bench --benchmarks=fillrandom,readrandom,updaterandom,readrandom,mergerandom,readrandom --merge_operator=put
--threads=2
3. Test the UInt64AddOperator (simulating numeric addition) similarly:
./db_bench --value_size=8 --benchmarks=fillrandom,readrandom,updaterandom,readrandom,mergerandom,readrandom
--merge_operator=uint64add --threads=2
Reviewers: haobo, dhruba, zshao, MarkCallaghan
Reviewed By: haobo
CC: leveldb
Differential Revision: https://reviews.facebook.net/D11535
11 years ago
|
|
|
RandomGenerator gen;
|
|
|
|
|
std::string value;
|
|
|
|
|
int64_t found = 0;
|
|
|
|
|
int64_t bytes = 0;
|
Benchmarking for Merge Operator
Summary:
Updated db_bench and utilities/merge_operators.h to allow for dynamic benchmarking
of merge operators in db_bench. Added a new test (--benchmarks=mergerandom), which performs
a bunch of random Merge() operations over random keys. Also added a "--merge_operator=" flag
so that the tester can easily benchmark different merge operators. Currently supports
the PutOperator and UInt64Add operator. Support for stringappend or list append may come later.
Test Plan:
1. make db_bench
2. Test the PutOperator (simulating Put) as follows:
./db_bench --benchmarks=fillrandom,readrandom,updaterandom,readrandom,mergerandom,readrandom --merge_operator=put
--threads=2
3. Test the UInt64AddOperator (simulating numeric addition) similarly:
./db_bench --value_size=8 --benchmarks=fillrandom,readrandom,updaterandom,readrandom,mergerandom,readrandom
--merge_operator=uint64add --threads=2
Reviewers: haobo, dhruba, zshao, MarkCallaghan
Reviewed By: haobo
CC: leveldb
Differential Revision: https://reviews.facebook.net/D11535
11 years ago
|
|
|
|
|
|
|
|
std::unique_ptr<const char[]> key_guard;
|
|
|
|
|
Slice key = AllocateKey(&key_guard);
|
|
|
|
|
std::unique_ptr<char[]> ts_guard;
|
|
|
|
|
if (user_timestamp_size_ > 0) {
|
|
|
|
|
ts_guard.reset(new char[user_timestamp_size_]);
|
|
|
|
|
}
|
Benchmarking for Merge Operator
Summary:
Updated db_bench and utilities/merge_operators.h to allow for dynamic benchmarking
of merge operators in db_bench. Added a new test (--benchmarks=mergerandom), which performs
a bunch of random Merge() operations over random keys. Also added a "--merge_operator=" flag
so that the tester can easily benchmark different merge operators. Currently supports
the PutOperator and UInt64Add operator. Support for stringappend or list append may come later.
Test Plan:
1. make db_bench
2. Test the PutOperator (simulating Put) as follows:
./db_bench --benchmarks=fillrandom,readrandom,updaterandom,readrandom,mergerandom,readrandom --merge_operator=put
--threads=2
3. Test the UInt64AddOperator (simulating numeric addition) similarly:
./db_bench --value_size=8 --benchmarks=fillrandom,readrandom,updaterandom,readrandom,mergerandom,readrandom
--merge_operator=uint64add --threads=2
Reviewers: haobo, dhruba, zshao, MarkCallaghan
Reviewed By: haobo
CC: leveldb
Differential Revision: https://reviews.facebook.net/D11535
11 years ago
|
|
|
// The number of iterations is the larger of read_ or write_
|
|
|
|
|
Duration duration(FLAGS_duration, readwrites_);
|
|
|
|
|
while (!duration.Done(1)) {
|
|
|
|
|
DB* db = SelectDB(thread);
|
|
|
|
|
GenerateKeyFromInt(thread->rand.Next() % FLAGS_num, FLAGS_num, &key);
|
|
|
|
|
Slice ts;
|
|
|
|
|
if (user_timestamp_size_ > 0) {
|
|
|
|
|
ts = mock_app_clock_->Allocate(ts_guard.get());
|
|
|
|
|
options.timestamp = &ts;
|
|
|
|
|
}
|
Benchmarking for Merge Operator
Summary:
Updated db_bench and utilities/merge_operators.h to allow for dynamic benchmarking
of merge operators in db_bench. Added a new test (--benchmarks=mergerandom), which performs
a bunch of random Merge() operations over random keys. Also added a "--merge_operator=" flag
so that the tester can easily benchmark different merge operators. Currently supports
the PutOperator and UInt64Add operator. Support for stringappend or list append may come later.
Test Plan:
1. make db_bench
2. Test the PutOperator (simulating Put) as follows:
./db_bench --benchmarks=fillrandom,readrandom,updaterandom,readrandom,mergerandom,readrandom --merge_operator=put
--threads=2
3. Test the UInt64AddOperator (simulating numeric addition) similarly:
./db_bench --value_size=8 --benchmarks=fillrandom,readrandom,updaterandom,readrandom,mergerandom,readrandom
--merge_operator=uint64add --threads=2
Reviewers: haobo, dhruba, zshao, MarkCallaghan
Reviewed By: haobo
CC: leveldb
Differential Revision: https://reviews.facebook.net/D11535
11 years ago
|
|
|
|
|
|
|
|
auto status = db->Get(options, key, &value);
|
|
|
|
|
if (status.ok()) {
|
|
|
|
|
++found;
|
|
|
|
|
bytes += key.size() + value.size() + user_timestamp_size_;
|
|
|
|
|
} else if (!status.IsNotFound()) {
|
|
|
|
|
fprintf(stderr, "Get returned an error: %s\n",
|
|
|
|
|
status.ToString().c_str());
|
|
|
|
|
abort();
|
Benchmarking for Merge Operator
Summary:
Updated db_bench and utilities/merge_operators.h to allow for dynamic benchmarking
of merge operators in db_bench. Added a new test (--benchmarks=mergerandom), which performs
a bunch of random Merge() operations over random keys. Also added a "--merge_operator=" flag
so that the tester can easily benchmark different merge operators. Currently supports
the PutOperator and UInt64Add operator. Support for stringappend or list append may come later.
Test Plan:
1. make db_bench
2. Test the PutOperator (simulating Put) as follows:
./db_bench --benchmarks=fillrandom,readrandom,updaterandom,readrandom,mergerandom,readrandom --merge_operator=put
--threads=2
3. Test the UInt64AddOperator (simulating numeric addition) similarly:
./db_bench --value_size=8 --benchmarks=fillrandom,readrandom,updaterandom,readrandom,mergerandom,readrandom
--merge_operator=uint64add --threads=2
Reviewers: haobo, dhruba, zshao, MarkCallaghan
Reviewed By: haobo
CC: leveldb
Differential Revision: https://reviews.facebook.net/D11535
11 years ago
|
|
|
} else {
|
|
|
|
|
// If not existing, then just assume an empty string of data
|
|
|
|
|
value.clear();
|
|
|
|
|
}
|
|
|
|
|
|
|
|
|
|
// Update the value (by appending data)
|
|
|
|
|
Slice operand = gen.Generate();
|
Benchmarking for Merge Operator
Summary:
Updated db_bench and utilities/merge_operators.h to allow for dynamic benchmarking
of merge operators in db_bench. Added a new test (--benchmarks=mergerandom), which performs
a bunch of random Merge() operations over random keys. Also added a "--merge_operator=" flag
so that the tester can easily benchmark different merge operators. Currently supports
the PutOperator and UInt64Add operator. Support for stringappend or list append may come later.
Test Plan:
1. make db_bench
2. Test the PutOperator (simulating Put) as follows:
./db_bench --benchmarks=fillrandom,readrandom,updaterandom,readrandom,mergerandom,readrandom --merge_operator=put
--threads=2
3. Test the UInt64AddOperator (simulating numeric addition) similarly:
./db_bench --value_size=8 --benchmarks=fillrandom,readrandom,updaterandom,readrandom,mergerandom,readrandom
--merge_operator=uint64add --threads=2
Reviewers: haobo, dhruba, zshao, MarkCallaghan
Reviewed By: haobo
CC: leveldb
Differential Revision: https://reviews.facebook.net/D11535
11 years ago
|
|
|
if (value.size() > 0) {
|
|
|
|
|
// Use a delimiter to match the semantics for StringAppendOperator
|
Benchmarking for Merge Operator
Summary:
Updated db_bench and utilities/merge_operators.h to allow for dynamic benchmarking
of merge operators in db_bench. Added a new test (--benchmarks=mergerandom), which performs
a bunch of random Merge() operations over random keys. Also added a "--merge_operator=" flag
so that the tester can easily benchmark different merge operators. Currently supports
the PutOperator and UInt64Add operator. Support for stringappend or list append may come later.
Test Plan:
1. make db_bench
2. Test the PutOperator (simulating Put) as follows:
./db_bench --benchmarks=fillrandom,readrandom,updaterandom,readrandom,mergerandom,readrandom --merge_operator=put
--threads=2
3. Test the UInt64AddOperator (simulating numeric addition) similarly:
./db_bench --value_size=8 --benchmarks=fillrandom,readrandom,updaterandom,readrandom,mergerandom,readrandom
--merge_operator=uint64add --threads=2
Reviewers: haobo, dhruba, zshao, MarkCallaghan
Reviewed By: haobo
CC: leveldb
Differential Revision: https://reviews.facebook.net/D11535
11 years ago
|
|
|
value.append(1,',');
|
|
|
|
|
}
|
|
|
|
|
value.append(operand.data(), operand.size());
|
|
|
|
|
|
Revise APIs related to user-defined timestamp (#8946)
Summary:
ajkr reminded me that we have a rule of not including per-kv related data in `WriteOptions`.
Namely, `WriteOptions` should not include information about "what-to-write", but should just
include information about "how-to-write".
According to this rule, `WriteOptions::timestamp` (experimental) is clearly a violation. Therefore,
this PR removes `WriteOptions::timestamp` for compliance.
After the removal, we need to pass timestamp info via another set of APIs. This PR proposes a set
of overloaded functions `Put(write_opts, key, value, ts)`, `Delete(write_opts, key, ts)`, and
`SingleDelete(write_opts, key, ts)`. Planned to add `Write(write_opts, batch, ts)`, but its complexity
made me reconsider doing it in another PR (maybe).
For better checking and returning error early, we also add a new set of APIs to `WriteBatch` that take
extra `timestamp` information when writing to `WriteBatch`es.
These set of APIs in `WriteBatchWithIndex` are currently not supported, and are on our TODO list.
Removed `WriteBatch::AssignTimestamps()` and renamed `WriteBatch::AssignTimestamp()` to
`WriteBatch::UpdateTimestamps()` since this method require that all keys have space for timestamps
allocated already and multiple timestamps can be updated.
The constructor of `WriteBatch` now takes a fourth argument `default_cf_ts_sz` which is the timestamp
size of the default column family. This will be used to allocate space when calling APIs that do not
specify a column family handle.
Also, updated `DB::Get()`, `DB::MultiGet()`, `DB::NewIterator()`, `DB::NewIterators()` methods, replacing
some assertions about timestamp to returning Status code.
Pull Request resolved: https://github.com/facebook/rocksdb/pull/8946
Test Plan:
make check
./db_bench -benchmarks=fillseq,fillrandom,readrandom,readseq,deleterandom -user_timestamp_size=8
./db_stress --user_timestamp_size=8 -nooverwritepercent=0 -test_secondary=0 -secondary_catch_up_one_in=0 -continuous_verification_interval=0
Make sure there is no perf regression by running the following
```
./db_bench_opt -db=/dev/shm/rocksdb -use_existing_db=0 -level0_stop_writes_trigger=256 -level0_slowdown_writes_trigger=256 -level0_file_num_compaction_trigger=256 -disable_wal=1 -duration=10 -benchmarks=fillrandom
```
Before this PR
```
DB path: [/dev/shm/rocksdb]
fillrandom : 1.831 micros/op 546235 ops/sec; 60.4 MB/s
```
After this PR
```
DB path: [/dev/shm/rocksdb]
fillrandom : 1.820 micros/op 549404 ops/sec; 60.8 MB/s
```
Reviewed By: ltamasi
Differential Revision: D33721359
Pulled By: riversand963
fbshipit-source-id: c131561534272c120ffb80711d42748d21badf09
2 years ago
|
|
|
Status s;
|
|
|
|
|
if (user_timestamp_size_ > 0) {
|
|
|
|
|
ts = mock_app_clock_->Allocate(ts_guard.get());
|
Revise APIs related to user-defined timestamp (#8946)
Summary:
ajkr reminded me that we have a rule of not including per-kv related data in `WriteOptions`.
Namely, `WriteOptions` should not include information about "what-to-write", but should just
include information about "how-to-write".
According to this rule, `WriteOptions::timestamp` (experimental) is clearly a violation. Therefore,
this PR removes `WriteOptions::timestamp` for compliance.
After the removal, we need to pass timestamp info via another set of APIs. This PR proposes a set
of overloaded functions `Put(write_opts, key, value, ts)`, `Delete(write_opts, key, ts)`, and
`SingleDelete(write_opts, key, ts)`. Planned to add `Write(write_opts, batch, ts)`, but its complexity
made me reconsider doing it in another PR (maybe).
For better checking and returning error early, we also add a new set of APIs to `WriteBatch` that take
extra `timestamp` information when writing to `WriteBatch`es.
These set of APIs in `WriteBatchWithIndex` are currently not supported, and are on our TODO list.
Removed `WriteBatch::AssignTimestamps()` and renamed `WriteBatch::AssignTimestamp()` to
`WriteBatch::UpdateTimestamps()` since this method require that all keys have space for timestamps
allocated already and multiple timestamps can be updated.
The constructor of `WriteBatch` now takes a fourth argument `default_cf_ts_sz` which is the timestamp
size of the default column family. This will be used to allocate space when calling APIs that do not
specify a column family handle.
Also, updated `DB::Get()`, `DB::MultiGet()`, `DB::NewIterator()`, `DB::NewIterators()` methods, replacing
some assertions about timestamp to returning Status code.
Pull Request resolved: https://github.com/facebook/rocksdb/pull/8946
Test Plan:
make check
./db_bench -benchmarks=fillseq,fillrandom,readrandom,readseq,deleterandom -user_timestamp_size=8
./db_stress --user_timestamp_size=8 -nooverwritepercent=0 -test_secondary=0 -secondary_catch_up_one_in=0 -continuous_verification_interval=0
Make sure there is no perf regression by running the following
```
./db_bench_opt -db=/dev/shm/rocksdb -use_existing_db=0 -level0_stop_writes_trigger=256 -level0_slowdown_writes_trigger=256 -level0_file_num_compaction_trigger=256 -disable_wal=1 -duration=10 -benchmarks=fillrandom
```
Before this PR
```
DB path: [/dev/shm/rocksdb]
fillrandom : 1.831 micros/op 546235 ops/sec; 60.4 MB/s
```
After this PR
```
DB path: [/dev/shm/rocksdb]
fillrandom : 1.820 micros/op 549404 ops/sec; 60.8 MB/s
```
Reviewed By: ltamasi
Differential Revision: D33721359
Pulled By: riversand963
fbshipit-source-id: c131561534272c120ffb80711d42748d21badf09
2 years ago
|
|
|
s = db->Put(write_options_, key, ts, value);
|
|
|
|
|
} else {
|
|
|
|
|
// Write back to the database
|
|
|
|
|
s = db->Put(write_options_, key, value);
|
|
|
|
|
}
|
Benchmarking for Merge Operator
Summary:
Updated db_bench and utilities/merge_operators.h to allow for dynamic benchmarking
of merge operators in db_bench. Added a new test (--benchmarks=mergerandom), which performs
a bunch of random Merge() operations over random keys. Also added a "--merge_operator=" flag
so that the tester can easily benchmark different merge operators. Currently supports
the PutOperator and UInt64Add operator. Support for stringappend or list append may come later.
Test Plan:
1. make db_bench
2. Test the PutOperator (simulating Put) as follows:
./db_bench --benchmarks=fillrandom,readrandom,updaterandom,readrandom,mergerandom,readrandom --merge_operator=put
--threads=2
3. Test the UInt64AddOperator (simulating numeric addition) similarly:
./db_bench --value_size=8 --benchmarks=fillrandom,readrandom,updaterandom,readrandom,mergerandom,readrandom
--merge_operator=uint64add --threads=2
Reviewers: haobo, dhruba, zshao, MarkCallaghan
Reviewed By: haobo
CC: leveldb
Differential Revision: https://reviews.facebook.net/D11535
11 years ago
|
|
|
if (!s.ok()) {
|
|
|
|
|
fprintf(stderr, "put error: %s\n", s.ToString().c_str());
|
|
|
|
|
ErrorExit();
|
Benchmarking for Merge Operator
Summary:
Updated db_bench and utilities/merge_operators.h to allow for dynamic benchmarking
of merge operators in db_bench. Added a new test (--benchmarks=mergerandom), which performs
a bunch of random Merge() operations over random keys. Also added a "--merge_operator=" flag
so that the tester can easily benchmark different merge operators. Currently supports
the PutOperator and UInt64Add operator. Support for stringappend or list append may come later.
Test Plan:
1. make db_bench
2. Test the PutOperator (simulating Put) as follows:
./db_bench --benchmarks=fillrandom,readrandom,updaterandom,readrandom,mergerandom,readrandom --merge_operator=put
--threads=2
3. Test the UInt64AddOperator (simulating numeric addition) similarly:
./db_bench --value_size=8 --benchmarks=fillrandom,readrandom,updaterandom,readrandom,mergerandom,readrandom
--merge_operator=uint64add --threads=2
Reviewers: haobo, dhruba, zshao, MarkCallaghan
Reviewed By: haobo
CC: leveldb
Differential Revision: https://reviews.facebook.net/D11535
11 years ago
|
|
|
}
|
|
|
|
|
bytes += key.size() + value.size() + user_timestamp_size_;
|
|
|
|
|
thread->stats.FinishedOps(nullptr, db, 1, kUpdate);
|
Benchmarking for Merge Operator
Summary:
Updated db_bench and utilities/merge_operators.h to allow for dynamic benchmarking
of merge operators in db_bench. Added a new test (--benchmarks=mergerandom), which performs
a bunch of random Merge() operations over random keys. Also added a "--merge_operator=" flag
so that the tester can easily benchmark different merge operators. Currently supports
the PutOperator and UInt64Add operator. Support for stringappend or list append may come later.
Test Plan:
1. make db_bench
2. Test the PutOperator (simulating Put) as follows:
./db_bench --benchmarks=fillrandom,readrandom,updaterandom,readrandom,mergerandom,readrandom --merge_operator=put
--threads=2
3. Test the UInt64AddOperator (simulating numeric addition) similarly:
./db_bench --value_size=8 --benchmarks=fillrandom,readrandom,updaterandom,readrandom,mergerandom,readrandom
--merge_operator=uint64add --threads=2
Reviewers: haobo, dhruba, zshao, MarkCallaghan
Reviewed By: haobo
CC: leveldb
Differential Revision: https://reviews.facebook.net/D11535
11 years ago
|
|
|
}
|
|
|
|
|
|
Benchmarking for Merge Operator
Summary:
Updated db_bench and utilities/merge_operators.h to allow for dynamic benchmarking
of merge operators in db_bench. Added a new test (--benchmarks=mergerandom), which performs
a bunch of random Merge() operations over random keys. Also added a "--merge_operator=" flag
so that the tester can easily benchmark different merge operators. Currently supports
the PutOperator and UInt64Add operator. Support for stringappend or list append may come later.
Test Plan:
1. make db_bench
2. Test the PutOperator (simulating Put) as follows:
./db_bench --benchmarks=fillrandom,readrandom,updaterandom,readrandom,mergerandom,readrandom --merge_operator=put
--threads=2
3. Test the UInt64AddOperator (simulating numeric addition) similarly:
./db_bench --value_size=8 --benchmarks=fillrandom,readrandom,updaterandom,readrandom,mergerandom,readrandom
--merge_operator=uint64add --threads=2
Reviewers: haobo, dhruba, zshao, MarkCallaghan
Reviewed By: haobo
CC: leveldb
Differential Revision: https://reviews.facebook.net/D11535
11 years ago
|
|
|
char msg[100];
|
|
|
|
|
snprintf(msg, sizeof(msg), "( updates:%" PRIu64 " found:%" PRIu64 ")",
|
|
|
|
|
readwrites_, found);
|
|
|
|
|
thread->stats.AddBytes(bytes);
|
Benchmarking for Merge Operator
Summary:
Updated db_bench and utilities/merge_operators.h to allow for dynamic benchmarking
of merge operators in db_bench. Added a new test (--benchmarks=mergerandom), which performs
a bunch of random Merge() operations over random keys. Also added a "--merge_operator=" flag
so that the tester can easily benchmark different merge operators. Currently supports
the PutOperator and UInt64Add operator. Support for stringappend or list append may come later.
Test Plan:
1. make db_bench
2. Test the PutOperator (simulating Put) as follows:
./db_bench --benchmarks=fillrandom,readrandom,updaterandom,readrandom,mergerandom,readrandom --merge_operator=put
--threads=2
3. Test the UInt64AddOperator (simulating numeric addition) similarly:
./db_bench --value_size=8 --benchmarks=fillrandom,readrandom,updaterandom,readrandom,mergerandom,readrandom
--merge_operator=uint64add --threads=2
Reviewers: haobo, dhruba, zshao, MarkCallaghan
Reviewed By: haobo
CC: leveldb
Differential Revision: https://reviews.facebook.net/D11535
11 years ago
|
|
|
thread->stats.AddMessage(msg);
|
|
|
|
|
}
|
|
|
|
|
|
|
|
|
|
// Read-modify-write for random keys (using MergeOperator)
|
|
|
|
|
// The merge operator to use should be defined by FLAGS_merge_operator
|
|
|
|
|
// Adjust FLAGS_value_size so that the keys are reasonable for this operator
|
|
|
|
|
// Assumes that the merge operator is non-null (i.e.: is well-defined)
|
|
|
|
|
//
|
|
|
|
|
// For example, use FLAGS_merge_operator="uint64add" and FLAGS_value_size=8
|
|
|
|
|
// to simulate random additions over 64-bit integers using merge.
|
|
|
|
|
//
|
|
|
|
|
// The number of merges on the same key can be controlled by adjusting
|
|
|
|
|
// FLAGS_merge_keys.
|
Benchmarking for Merge Operator
Summary:
Updated db_bench and utilities/merge_operators.h to allow for dynamic benchmarking
of merge operators in db_bench. Added a new test (--benchmarks=mergerandom), which performs
a bunch of random Merge() operations over random keys. Also added a "--merge_operator=" flag
so that the tester can easily benchmark different merge operators. Currently supports
the PutOperator and UInt64Add operator. Support for stringappend or list append may come later.
Test Plan:
1. make db_bench
2. Test the PutOperator (simulating Put) as follows:
./db_bench --benchmarks=fillrandom,readrandom,updaterandom,readrandom,mergerandom,readrandom --merge_operator=put
--threads=2
3. Test the UInt64AddOperator (simulating numeric addition) similarly:
./db_bench --value_size=8 --benchmarks=fillrandom,readrandom,updaterandom,readrandom,mergerandom,readrandom
--merge_operator=uint64add --threads=2
Reviewers: haobo, dhruba, zshao, MarkCallaghan
Reviewed By: haobo
CC: leveldb
Differential Revision: https://reviews.facebook.net/D11535
11 years ago
|
|
|
void MergeRandom(ThreadState* thread) {
|
|
|
|
|
RandomGenerator gen;
|
|
|
|
|
int64_t bytes = 0;
|
|
|
|
|
std::unique_ptr<const char[]> key_guard;
|
|
|
|
|
Slice key = AllocateKey(&key_guard);
|
Benchmarking for Merge Operator
Summary:
Updated db_bench and utilities/merge_operators.h to allow for dynamic benchmarking
of merge operators in db_bench. Added a new test (--benchmarks=mergerandom), which performs
a bunch of random Merge() operations over random keys. Also added a "--merge_operator=" flag
so that the tester can easily benchmark different merge operators. Currently supports
the PutOperator and UInt64Add operator. Support for stringappend or list append may come later.
Test Plan:
1. make db_bench
2. Test the PutOperator (simulating Put) as follows:
./db_bench --benchmarks=fillrandom,readrandom,updaterandom,readrandom,mergerandom,readrandom --merge_operator=put
--threads=2
3. Test the UInt64AddOperator (simulating numeric addition) similarly:
./db_bench --value_size=8 --benchmarks=fillrandom,readrandom,updaterandom,readrandom,mergerandom,readrandom
--merge_operator=uint64add --threads=2
Reviewers: haobo, dhruba, zshao, MarkCallaghan
Reviewed By: haobo
CC: leveldb
Differential Revision: https://reviews.facebook.net/D11535
11 years ago
|
|
|
// The number of iterations is the larger of read_ or write_
|
|
|
|
|
Duration duration(FLAGS_duration, readwrites_);
|
|
|
|
|
while (!duration.Done(1)) {
|
|
|
|
|
DBWithColumnFamilies* db_with_cfh = SelectDBWithCfh(thread);
|
|
|
|
|
int64_t key_rand = thread->rand.Next() % merge_keys_;
|
|
|
|
|
GenerateKeyFromInt(key_rand, merge_keys_, &key);
|
Benchmarking for Merge Operator
Summary:
Updated db_bench and utilities/merge_operators.h to allow for dynamic benchmarking
of merge operators in db_bench. Added a new test (--benchmarks=mergerandom), which performs
a bunch of random Merge() operations over random keys. Also added a "--merge_operator=" flag
so that the tester can easily benchmark different merge operators. Currently supports
the PutOperator and UInt64Add operator. Support for stringappend or list append may come later.
Test Plan:
1. make db_bench
2. Test the PutOperator (simulating Put) as follows:
./db_bench --benchmarks=fillrandom,readrandom,updaterandom,readrandom,mergerandom,readrandom --merge_operator=put
--threads=2
3. Test the UInt64AddOperator (simulating numeric addition) similarly:
./db_bench --value_size=8 --benchmarks=fillrandom,readrandom,updaterandom,readrandom,mergerandom,readrandom
--merge_operator=uint64add --threads=2
Reviewers: haobo, dhruba, zshao, MarkCallaghan
Reviewed By: haobo
CC: leveldb
Differential Revision: https://reviews.facebook.net/D11535
11 years ago
|
|
|
|
|
|
|
|
Status s;
|
|
|
|
|
Slice val = gen.Generate();
|
|
|
|
|
if (FLAGS_num_column_families > 1) {
|
|
|
|
|
s = db_with_cfh->db->Merge(write_options_,
|
|
|
|
|
db_with_cfh->GetCfh(key_rand), key,
|
|
|
|
|
val);
|
|
|
|
|
} else {
|
|
|
|
|
s = db_with_cfh->db->Merge(write_options_,
|
|
|
|
|
db_with_cfh->db->DefaultColumnFamily(), key,
|
|
|
|
|
val);
|
|
|
|
|
}
|
Benchmarking for Merge Operator
Summary:
Updated db_bench and utilities/merge_operators.h to allow for dynamic benchmarking
of merge operators in db_bench. Added a new test (--benchmarks=mergerandom), which performs
a bunch of random Merge() operations over random keys. Also added a "--merge_operator=" flag
so that the tester can easily benchmark different merge operators. Currently supports
the PutOperator and UInt64Add operator. Support for stringappend or list append may come later.
Test Plan:
1. make db_bench
2. Test the PutOperator (simulating Put) as follows:
./db_bench --benchmarks=fillrandom,readrandom,updaterandom,readrandom,mergerandom,readrandom --merge_operator=put
--threads=2
3. Test the UInt64AddOperator (simulating numeric addition) similarly:
./db_bench --value_size=8 --benchmarks=fillrandom,readrandom,updaterandom,readrandom,mergerandom,readrandom
--merge_operator=uint64add --threads=2
Reviewers: haobo, dhruba, zshao, MarkCallaghan
Reviewed By: haobo
CC: leveldb
Differential Revision: https://reviews.facebook.net/D11535
11 years ago
|
|
|
|
|
|
|
|
if (!s.ok()) {
|
|
|
|
|
fprintf(stderr, "merge error: %s\n", s.ToString().c_str());
|
|
|
|
|
exit(1);
|
|
|
|
|
}
|
|
|
|
|
bytes += key.size() + val.size();
|
|
|
|
|
thread->stats.FinishedOps(nullptr, db_with_cfh->db, 1, kMerge);
|
Benchmarking for Merge Operator
Summary:
Updated db_bench and utilities/merge_operators.h to allow for dynamic benchmarking
of merge operators in db_bench. Added a new test (--benchmarks=mergerandom), which performs
a bunch of random Merge() operations over random keys. Also added a "--merge_operator=" flag
so that the tester can easily benchmark different merge operators. Currently supports
the PutOperator and UInt64Add operator. Support for stringappend or list append may come later.
Test Plan:
1. make db_bench
2. Test the PutOperator (simulating Put) as follows:
./db_bench --benchmarks=fillrandom,readrandom,updaterandom,readrandom,mergerandom,readrandom --merge_operator=put
--threads=2
3. Test the UInt64AddOperator (simulating numeric addition) similarly:
./db_bench --value_size=8 --benchmarks=fillrandom,readrandom,updaterandom,readrandom,mergerandom,readrandom
--merge_operator=uint64add --threads=2
Reviewers: haobo, dhruba, zshao, MarkCallaghan
Reviewed By: haobo
CC: leveldb
Differential Revision: https://reviews.facebook.net/D11535
11 years ago
|
|
|
}
|
|
|
|
|
|
|
|
|
|
// Print some statistics
|
|
|
|
|
char msg[100];
|
|
|
|
|
snprintf(msg, sizeof(msg), "( updates:%" PRIu64 ")", readwrites_);
|
|
|
|
|
thread->stats.AddBytes(bytes);
|
Benchmarking for Merge Operator
Summary:
Updated db_bench and utilities/merge_operators.h to allow for dynamic benchmarking
of merge operators in db_bench. Added a new test (--benchmarks=mergerandom), which performs
a bunch of random Merge() operations over random keys. Also added a "--merge_operator=" flag
so that the tester can easily benchmark different merge operators. Currently supports
the PutOperator and UInt64Add operator. Support for stringappend or list append may come later.
Test Plan:
1. make db_bench
2. Test the PutOperator (simulating Put) as follows:
./db_bench --benchmarks=fillrandom,readrandom,updaterandom,readrandom,mergerandom,readrandom --merge_operator=put
--threads=2
3. Test the UInt64AddOperator (simulating numeric addition) similarly:
./db_bench --value_size=8 --benchmarks=fillrandom,readrandom,updaterandom,readrandom,mergerandom,readrandom
--merge_operator=uint64add --threads=2
Reviewers: haobo, dhruba, zshao, MarkCallaghan
Reviewed By: haobo
CC: leveldb
Differential Revision: https://reviews.facebook.net/D11535
11 years ago
|
|
|
thread->stats.AddMessage(msg);
|
|
|
|
|
}
|
|
|
|
|
|
|
|
|
|
// Read and merge random keys. The amount of reads and merges are controlled
|
|
|
|
|
// by adjusting FLAGS_num and FLAGS_mergereadpercent. The number of distinct
|
|
|
|
|
// keys (and thus also the number of reads and merges on the same key) can be
|
|
|
|
|
// adjusted with FLAGS_merge_keys.
|
|
|
|
|
//
|
|
|
|
|
// As with MergeRandom, the merge operator to use should be defined by
|
|
|
|
|
// FLAGS_merge_operator.
|
|
|
|
|
void ReadRandomMergeRandom(ThreadState* thread) {
|
|
|
|
|
RandomGenerator gen;
|
|
|
|
|
std::string value;
|
|
|
|
|
int64_t num_hits = 0;
|
|
|
|
|
int64_t num_gets = 0;
|
|
|
|
|
int64_t num_merges = 0;
|
|
|
|
|
size_t max_length = 0;
|
|
|
|
|
|
|
|
|
|
std::unique_ptr<const char[]> key_guard;
|
|
|
|
|
Slice key = AllocateKey(&key_guard);
|
|
|
|
|
// the number of iterations is the larger of read_ or write_
|
|
|
|
|
Duration duration(FLAGS_duration, readwrites_);
|
|
|
|
|
while (!duration.Done(1)) {
|
|
|
|
|
DB* db = SelectDB(thread);
|
|
|
|
|
GenerateKeyFromInt(thread->rand.Next() % merge_keys_, merge_keys_, &key);
|
|
|
|
|
|
|
|
|
|
bool do_merge = int(thread->rand.Next() % 100) < FLAGS_mergereadpercent;
|
|
|
|
|
|
|
|
|
|
if (do_merge) {
|
|
|
|
|
Status s = db->Merge(write_options_, key, gen.Generate());
|
|
|
|
|
if (!s.ok()) {
|
|
|
|
|
fprintf(stderr, "merge error: %s\n", s.ToString().c_str());
|
|
|
|
|
exit(1);
|
|
|
|
|
}
|
|
|
|
|
num_merges++;
|
|
|
|
|
thread->stats.FinishedOps(nullptr, db, 1, kMerge);
|
|
|
|
|
} else {
|
|
|
|
|
Status s = db->Get(read_options_, key, &value);
|
|
|
|
|
if (value.length() > max_length)
|
|
|
|
|
max_length = value.length();
|
|
|
|
|
|
|
|
|
|
if (!s.ok() && !s.IsNotFound()) {
|
|
|
|
|
fprintf(stderr, "get error: %s\n", s.ToString().c_str());
|
|
|
|
|
// we continue after error rather than exiting so that we can
|
|
|
|
|
// find more errors if any
|
|
|
|
|
} else if (!s.IsNotFound()) {
|
|
|
|
|
num_hits++;
|
|
|
|
|
}
|
|
|
|
|
num_gets++;
|
|
|
|
|
thread->stats.FinishedOps(nullptr, db, 1, kRead);
|
|
|
|
|
}
|
|
|
|
|
}
|
|
|
|
|
|
|
|
|
|
char msg[100];
|
|
|
|
|
snprintf(msg, sizeof(msg),
|
|
|
|
|
"(reads:%" PRIu64 " merges:%" PRIu64 " total:%" PRIu64
|
|
|
|
|
" hits:%" PRIu64 " maxlength:%" ROCKSDB_PRIszt ")",
|
|
|
|
|
num_gets, num_merges, readwrites_, num_hits, max_length);
|
|
|
|
|
thread->stats.AddMessage(msg);
|
|
|
|
|
}
|
|
|
|
|
|
SkipListRep::LookaheadIterator
Summary:
This diff introduces the `lookahead` argument to `SkipListFactory()`. This is an
optimization for the tailing use case which includes many seeks. E.g. consider
the following operations on a skip list iterator:
Seek(x), Next(), Next(), Seek(x+2), Next(), Seek(x+3), Next(), Next(), ...
If `lookahead` is positive, `SkipListRep` will return an iterator which also
keeps track of the previously visited node. Seek() then first does a linear
search starting from that node (up to `lookahead` steps). As in the tailing
example above, this may require fewer than ~log(n) comparisons as with regular
skip list search.
Test Plan:
Added a new benchmark (`fillseekseq`) which simulates the usage pattern. It
first writes N records (with consecutive keys), then measures how much time it
takes to read them by calling `Seek()` and `Next()`.
$ time ./db_bench -num 10000000 -benchmarks fillseekseq -prefix_size 1 \
-key_size 8 -write_buffer_size $[1024*1024*1024] -value_size 50 \
-seekseq_next 2 -skip_list_lookahead=0
[...]
DB path: [/dev/shm/rocksdbtest/dbbench]
fillseekseq : 0.389 micros/op 2569047 ops/sec;
real 0m21.806s
user 0m12.106s
sys 0m9.672s
$ time ./db_bench [...] -skip_list_lookahead=2
[...]
DB path: [/dev/shm/rocksdbtest/dbbench]
fillseekseq : 0.153 micros/op 6540684 ops/sec;
real 0m19.469s
user 0m10.192s
sys 0m9.252s
Reviewers: ljin, sdong, igor
Reviewed By: igor
Subscribers: dhruba, leveldb, march, lovro
Differential Revision: https://reviews.facebook.net/D23997
10 years ago
|
|
|
void WriteSeqSeekSeq(ThreadState* thread) {
|
|
|
|
|
writes_ = FLAGS_num;
|
|
|
|
|
DoWrite(thread, SEQUENTIAL);
|
|
|
|
|
// exclude writes from the ops/sec calculation
|
|
|
|
|
thread->stats.Start(thread->tid);
|
|
|
|
|
|
|
|
|
|
DB* db = SelectDB(thread);
|
|
|
|
|
ReadOptions read_opts = read_options_;
|
|
|
|
|
std::unique_ptr<char[]> ts_guard;
|
|
|
|
|
Slice ts;
|
|
|
|
|
if (user_timestamp_size_ > 0) {
|
|
|
|
|
ts_guard.reset(new char[user_timestamp_size_]);
|
|
|
|
|
ts = mock_app_clock_->GetTimestampForRead(thread->rand, ts_guard.get());
|
|
|
|
|
read_opts.timestamp = &ts;
|
|
|
|
|
}
|
|
|
|
|
std::unique_ptr<Iterator> iter(db->NewIterator(read_opts));
|
SkipListRep::LookaheadIterator
Summary:
This diff introduces the `lookahead` argument to `SkipListFactory()`. This is an
optimization for the tailing use case which includes many seeks. E.g. consider
the following operations on a skip list iterator:
Seek(x), Next(), Next(), Seek(x+2), Next(), Seek(x+3), Next(), Next(), ...
If `lookahead` is positive, `SkipListRep` will return an iterator which also
keeps track of the previously visited node. Seek() then first does a linear
search starting from that node (up to `lookahead` steps). As in the tailing
example above, this may require fewer than ~log(n) comparisons as with regular
skip list search.
Test Plan:
Added a new benchmark (`fillseekseq`) which simulates the usage pattern. It
first writes N records (with consecutive keys), then measures how much time it
takes to read them by calling `Seek()` and `Next()`.
$ time ./db_bench -num 10000000 -benchmarks fillseekseq -prefix_size 1 \
-key_size 8 -write_buffer_size $[1024*1024*1024] -value_size 50 \
-seekseq_next 2 -skip_list_lookahead=0
[...]
DB path: [/dev/shm/rocksdbtest/dbbench]
fillseekseq : 0.389 micros/op 2569047 ops/sec;
real 0m21.806s
user 0m12.106s
sys 0m9.672s
$ time ./db_bench [...] -skip_list_lookahead=2
[...]
DB path: [/dev/shm/rocksdbtest/dbbench]
fillseekseq : 0.153 micros/op 6540684 ops/sec;
real 0m19.469s
user 0m10.192s
sys 0m9.252s
Reviewers: ljin, sdong, igor
Reviewed By: igor
Subscribers: dhruba, leveldb, march, lovro
Differential Revision: https://reviews.facebook.net/D23997
10 years ago
|
|
|
|
|
|
|
|
std::unique_ptr<const char[]> key_guard;
|
|
|
|
|
Slice key = AllocateKey(&key_guard);
|
SkipListRep::LookaheadIterator
Summary:
This diff introduces the `lookahead` argument to `SkipListFactory()`. This is an
optimization for the tailing use case which includes many seeks. E.g. consider
the following operations on a skip list iterator:
Seek(x), Next(), Next(), Seek(x+2), Next(), Seek(x+3), Next(), Next(), ...
If `lookahead` is positive, `SkipListRep` will return an iterator which also
keeps track of the previously visited node. Seek() then first does a linear
search starting from that node (up to `lookahead` steps). As in the tailing
example above, this may require fewer than ~log(n) comparisons as with regular
skip list search.
Test Plan:
Added a new benchmark (`fillseekseq`) which simulates the usage pattern. It
first writes N records (with consecutive keys), then measures how much time it
takes to read them by calling `Seek()` and `Next()`.
$ time ./db_bench -num 10000000 -benchmarks fillseekseq -prefix_size 1 \
-key_size 8 -write_buffer_size $[1024*1024*1024] -value_size 50 \
-seekseq_next 2 -skip_list_lookahead=0
[...]
DB path: [/dev/shm/rocksdbtest/dbbench]
fillseekseq : 0.389 micros/op 2569047 ops/sec;
real 0m21.806s
user 0m12.106s
sys 0m9.672s
$ time ./db_bench [...] -skip_list_lookahead=2
[...]
DB path: [/dev/shm/rocksdbtest/dbbench]
fillseekseq : 0.153 micros/op 6540684 ops/sec;
real 0m19.469s
user 0m10.192s
sys 0m9.252s
Reviewers: ljin, sdong, igor
Reviewed By: igor
Subscribers: dhruba, leveldb, march, lovro
Differential Revision: https://reviews.facebook.net/D23997
10 years ago
|
|
|
for (int64_t i = 0; i < FLAGS_num; ++i) {
|
|
|
|
|
GenerateKeyFromInt(i, FLAGS_num, &key);
|
|
|
|
|
iter->Seek(key);
|
|
|
|
|
assert(iter->Valid() && iter->key() == key);
|
|
|
|
|
thread->stats.FinishedOps(nullptr, db, 1, kSeek);
|
SkipListRep::LookaheadIterator
Summary:
This diff introduces the `lookahead` argument to `SkipListFactory()`. This is an
optimization for the tailing use case which includes many seeks. E.g. consider
the following operations on a skip list iterator:
Seek(x), Next(), Next(), Seek(x+2), Next(), Seek(x+3), Next(), Next(), ...
If `lookahead` is positive, `SkipListRep` will return an iterator which also
keeps track of the previously visited node. Seek() then first does a linear
search starting from that node (up to `lookahead` steps). As in the tailing
example above, this may require fewer than ~log(n) comparisons as with regular
skip list search.
Test Plan:
Added a new benchmark (`fillseekseq`) which simulates the usage pattern. It
first writes N records (with consecutive keys), then measures how much time it
takes to read them by calling `Seek()` and `Next()`.
$ time ./db_bench -num 10000000 -benchmarks fillseekseq -prefix_size 1 \
-key_size 8 -write_buffer_size $[1024*1024*1024] -value_size 50 \
-seekseq_next 2 -skip_list_lookahead=0
[...]
DB path: [/dev/shm/rocksdbtest/dbbench]
fillseekseq : 0.389 micros/op 2569047 ops/sec;
real 0m21.806s
user 0m12.106s
sys 0m9.672s
$ time ./db_bench [...] -skip_list_lookahead=2
[...]
DB path: [/dev/shm/rocksdbtest/dbbench]
fillseekseq : 0.153 micros/op 6540684 ops/sec;
real 0m19.469s
user 0m10.192s
sys 0m9.252s
Reviewers: ljin, sdong, igor
Reviewed By: igor
Subscribers: dhruba, leveldb, march, lovro
Differential Revision: https://reviews.facebook.net/D23997
10 years ago
|
|
|
|
|
|
|
|
for (int j = 0; j < FLAGS_seek_nexts && i + 1 < FLAGS_num; ++j) {
|
|
|
|
|
if (!FLAGS_reverse_iterator) {
|
|
|
|
|
iter->Next();
|
|
|
|
|
} else {
|
|
|
|
|
iter->Prev();
|
|
|
|
|
}
|
SkipListRep::LookaheadIterator
Summary:
This diff introduces the `lookahead` argument to `SkipListFactory()`. This is an
optimization for the tailing use case which includes many seeks. E.g. consider
the following operations on a skip list iterator:
Seek(x), Next(), Next(), Seek(x+2), Next(), Seek(x+3), Next(), Next(), ...
If `lookahead` is positive, `SkipListRep` will return an iterator which also
keeps track of the previously visited node. Seek() then first does a linear
search starting from that node (up to `lookahead` steps). As in the tailing
example above, this may require fewer than ~log(n) comparisons as with regular
skip list search.
Test Plan:
Added a new benchmark (`fillseekseq`) which simulates the usage pattern. It
first writes N records (with consecutive keys), then measures how much time it
takes to read them by calling `Seek()` and `Next()`.
$ time ./db_bench -num 10000000 -benchmarks fillseekseq -prefix_size 1 \
-key_size 8 -write_buffer_size $[1024*1024*1024] -value_size 50 \
-seekseq_next 2 -skip_list_lookahead=0
[...]
DB path: [/dev/shm/rocksdbtest/dbbench]
fillseekseq : 0.389 micros/op 2569047 ops/sec;
real 0m21.806s
user 0m12.106s
sys 0m9.672s
$ time ./db_bench [...] -skip_list_lookahead=2
[...]
DB path: [/dev/shm/rocksdbtest/dbbench]
fillseekseq : 0.153 micros/op 6540684 ops/sec;
real 0m19.469s
user 0m10.192s
sys 0m9.252s
Reviewers: ljin, sdong, igor
Reviewed By: igor
Subscribers: dhruba, leveldb, march, lovro
Differential Revision: https://reviews.facebook.net/D23997
10 years ago
|
|
|
GenerateKeyFromInt(++i, FLAGS_num, &key);
|
|
|
|
|
assert(iter->Valid() && iter->key() == key);
|
|
|
|
|
thread->stats.FinishedOps(nullptr, db, 1, kSeek);
|
SkipListRep::LookaheadIterator
Summary:
This diff introduces the `lookahead` argument to `SkipListFactory()`. This is an
optimization for the tailing use case which includes many seeks. E.g. consider
the following operations on a skip list iterator:
Seek(x), Next(), Next(), Seek(x+2), Next(), Seek(x+3), Next(), Next(), ...
If `lookahead` is positive, `SkipListRep` will return an iterator which also
keeps track of the previously visited node. Seek() then first does a linear
search starting from that node (up to `lookahead` steps). As in the tailing
example above, this may require fewer than ~log(n) comparisons as with regular
skip list search.
Test Plan:
Added a new benchmark (`fillseekseq`) which simulates the usage pattern. It
first writes N records (with consecutive keys), then measures how much time it
takes to read them by calling `Seek()` and `Next()`.
$ time ./db_bench -num 10000000 -benchmarks fillseekseq -prefix_size 1 \
-key_size 8 -write_buffer_size $[1024*1024*1024] -value_size 50 \
-seekseq_next 2 -skip_list_lookahead=0
[...]
DB path: [/dev/shm/rocksdbtest/dbbench]
fillseekseq : 0.389 micros/op 2569047 ops/sec;
real 0m21.806s
user 0m12.106s
sys 0m9.672s
$ time ./db_bench [...] -skip_list_lookahead=2
[...]
DB path: [/dev/shm/rocksdbtest/dbbench]
fillseekseq : 0.153 micros/op 6540684 ops/sec;
real 0m19.469s
user 0m10.192s
sys 0m9.252s
Reviewers: ljin, sdong, igor
Reviewed By: igor
Subscribers: dhruba, leveldb, march, lovro
Differential Revision: https://reviews.facebook.net/D23997
10 years ago
|
|
|
}
|
|
|
|
|
|
|
|
|
|
iter->Seek(key);
|
|
|
|
|
assert(iter->Valid() && iter->key() == key);
|
|
|
|
|
thread->stats.FinishedOps(nullptr, db, 1, kSeek);
|
SkipListRep::LookaheadIterator
Summary:
This diff introduces the `lookahead` argument to `SkipListFactory()`. This is an
optimization for the tailing use case which includes many seeks. E.g. consider
the following operations on a skip list iterator:
Seek(x), Next(), Next(), Seek(x+2), Next(), Seek(x+3), Next(), Next(), ...
If `lookahead` is positive, `SkipListRep` will return an iterator which also
keeps track of the previously visited node. Seek() then first does a linear
search starting from that node (up to `lookahead` steps). As in the tailing
example above, this may require fewer than ~log(n) comparisons as with regular
skip list search.
Test Plan:
Added a new benchmark (`fillseekseq`) which simulates the usage pattern. It
first writes N records (with consecutive keys), then measures how much time it
takes to read them by calling `Seek()` and `Next()`.
$ time ./db_bench -num 10000000 -benchmarks fillseekseq -prefix_size 1 \
-key_size 8 -write_buffer_size $[1024*1024*1024] -value_size 50 \
-seekseq_next 2 -skip_list_lookahead=0
[...]
DB path: [/dev/shm/rocksdbtest/dbbench]
fillseekseq : 0.389 micros/op 2569047 ops/sec;
real 0m21.806s
user 0m12.106s
sys 0m9.672s
$ time ./db_bench [...] -skip_list_lookahead=2
[...]
DB path: [/dev/shm/rocksdbtest/dbbench]
fillseekseq : 0.153 micros/op 6540684 ops/sec;
real 0m19.469s
user 0m10.192s
sys 0m9.252s
Reviewers: ljin, sdong, igor
Reviewed By: igor
Subscribers: dhruba, leveldb, march, lovro
Differential Revision: https://reviews.facebook.net/D23997
10 years ago
|
|
|
}
|
|
|
|
|
}
|
|
|
|
|
|
New API to get all merge operands for a Key (#5604)
Summary:
This is a new API added to db.h to allow for fetching all merge operands associated with a Key. The main motivation for this API is to support use cases where doing a full online merge is not necessary as it is performance sensitive. Example use-cases:
1. Update subset of columns and read subset of columns -
Imagine a SQL Table, a row is encoded as a K/V pair (as it is done in MyRocks). If there are many columns and users only updated one of them, we can use merge operator to reduce write amplification. While users only read one or two columns in the read query, this feature can avoid a full merging of the whole row, and save some CPU.
2. Updating very few attributes in a value which is a JSON-like document -
Updating one attribute can be done efficiently using merge operator, while reading back one attribute can be done more efficiently if we don't need to do a full merge.
----------------------------------------------------------------------------------------------------
API :
Status GetMergeOperands(
const ReadOptions& options, ColumnFamilyHandle* column_family,
const Slice& key, PinnableSlice* merge_operands,
GetMergeOperandsOptions* get_merge_operands_options,
int* number_of_operands)
Example usage :
int size = 100;
int number_of_operands = 0;
std::vector<PinnableSlice> values(size);
GetMergeOperandsOptions merge_operands_info;
db_->GetMergeOperands(ReadOptions(), db_->DefaultColumnFamily(), "k1", values.data(), merge_operands_info, &number_of_operands);
Description :
Returns all the merge operands corresponding to the key. If the number of merge operands in DB is greater than merge_operands_options.expected_max_number_of_operands no merge operands are returned and status is Incomplete. Merge operands returned are in the order of insertion.
merge_operands-> Points to an array of at-least merge_operands_options.expected_max_number_of_operands and the caller is responsible for allocating it. If the status returned is Incomplete then number_of_operands will contain the total number of merge operands found in DB for key.
Pull Request resolved: https://github.com/facebook/rocksdb/pull/5604
Test Plan:
Added unit test and perf test in db_bench that can be run using the command:
./db_bench -benchmarks=getmergeoperands --merge_operator=sortlist
Differential Revision: D16657366
Pulled By: vjnadimpalli
fbshipit-source-id: 0faadd752351745224ee12d4ae9ef3cb529951bf
5 years ago
|
|
|
bool binary_search(std::vector<int>& data, int start, int end, int key) {
|
|
|
|
|
if (data.empty()) return false;
|
|
|
|
|
if (start > end) return false;
|
|
|
|
|
int mid = start + (end - start) / 2;
|
|
|
|
|
if (mid > static_cast<int>(data.size()) - 1) return false;
|
|
|
|
|
if (data[mid] == key) {
|
|
|
|
|
return true;
|
|
|
|
|
} else if (data[mid] > key) {
|
|
|
|
|
return binary_search(data, start, mid - 1, key);
|
|
|
|
|
} else {
|
|
|
|
|
return binary_search(data, mid + 1, end, key);
|
|
|
|
|
}
|
|
|
|
|
}
|
|
|
|
|
|
|
|
|
|
// Does a bunch of merge operations for a key(key1) where the merge operand
|
|
|
|
|
// is a sorted list. Next performance comparison is done between doing a Get
|
|
|
|
|
// for key1 followed by searching for another key(key2) in the large sorted
|
|
|
|
|
// list vs calling GetMergeOperands for key1 and then searching for the key2
|
|
|
|
|
// in all the sorted sub-lists. Later case is expected to be a lot faster.
|
|
|
|
|
void GetMergeOperands(ThreadState* thread) {
|
|
|
|
|
DB* db = SelectDB(thread);
|
|
|
|
|
const int kTotalValues = 100000;
|
|
|
|
|
const int kListSize = 100;
|
|
|
|
|
std::string key = "my_key";
|
|
|
|
|
std::string value;
|
|
|
|
|
|
|
|
|
|
for (int i = 1; i < kTotalValues; i++) {
|
|
|
|
|
if (i % kListSize == 0) {
|
|
|
|
|
// Remove trailing ','
|
|
|
|
|
value.pop_back();
|
|
|
|
|
db->Merge(WriteOptions(), key, value);
|
|
|
|
|
value.clear();
|
|
|
|
|
} else {
|
|
|
|
|
value.append(std::to_string(i)).append(",");
|
|
|
|
|
}
|
|
|
|
|
}
|
|
|
|
|
|
|
|
|
|
SortList s;
|
|
|
|
|
std::vector<int> data;
|
|
|
|
|
// This value can be experimented with and it will demonstrate the
|
|
|
|
|
// perf difference between doing a Get and searching for lookup_key in the
|
|
|
|
|
// resultant large sorted list vs doing GetMergeOperands and searching
|
|
|
|
|
// for lookup_key within this resultant sorted sub-lists.
|
|
|
|
|
int lookup_key = 1;
|
|
|
|
|
|
|
|
|
|
// Get API call
|
|
|
|
|
std::cout << "--- Get API call --- \n";
|
|
|
|
|
PinnableSlice p_slice;
|
|
|
|
|
uint64_t st = FLAGS_env->NowNanos();
|
|
|
|
|
db->Get(ReadOptions(), db->DefaultColumnFamily(), key, &p_slice);
|
|
|
|
|
s.MakeVector(data, p_slice);
|
|
|
|
|
bool found =
|
|
|
|
|
binary_search(data, 0, static_cast<int>(data.size() - 1), lookup_key);
|
|
|
|
|
std::cout << "Found key? " << std::to_string(found) << "\n";
|
|
|
|
|
uint64_t sp = FLAGS_env->NowNanos();
|
|
|
|
|
std::cout << "Get: " << (sp - st) / 1000000000.0 << " seconds\n";
|
|
|
|
|
std::string* dat_ = p_slice.GetSelf();
|
|
|
|
|
std::cout << "Sample data from Get API call: " << dat_->substr(0, 10)
|
|
|
|
|
<< "\n";
|
|
|
|
|
data.clear();
|
|
|
|
|
|
|
|
|
|
// GetMergeOperands API call
|
|
|
|
|
std::cout << "--- GetMergeOperands API --- \n";
|
|
|
|
|
std::vector<PinnableSlice> a_slice((kTotalValues / kListSize) + 1);
|
|
|
|
|
st = FLAGS_env->NowNanos();
|
|
|
|
|
int number_of_operands = 0;
|
|
|
|
|
GetMergeOperandsOptions get_merge_operands_options;
|
|
|
|
|
get_merge_operands_options.expected_max_number_of_operands =
|
|
|
|
|
(kTotalValues / 100) + 1;
|
|
|
|
|
db->GetMergeOperands(ReadOptions(), db->DefaultColumnFamily(), key,
|
|
|
|
|
a_slice.data(), &get_merge_operands_options,
|
|
|
|
|
&number_of_operands);
|
|
|
|
|
for (PinnableSlice& psl : a_slice) {
|
|
|
|
|
s.MakeVector(data, psl);
|
|
|
|
|
found =
|
|
|
|
|
binary_search(data, 0, static_cast<int>(data.size() - 1), lookup_key);
|
|
|
|
|
data.clear();
|
|
|
|
|
if (found) break;
|
|
|
|
|
}
|
|
|
|
|
std::cout << "Found key? " << std::to_string(found) << "\n";
|
|
|
|
|
sp = FLAGS_env->NowNanos();
|
|
|
|
|
std::cout << "Get Merge operands: " << (sp - st) / 1000000000.0
|
|
|
|
|
<< " seconds \n";
|
|
|
|
|
int to_print = 0;
|
|
|
|
|
std::cout << "Sample data from GetMergeOperands API call: ";
|
|
|
|
|
for (PinnableSlice& psl : a_slice) {
|
|
|
|
|
std::cout << "List: " << to_print << " : " << *psl.GetSelf() << "\n";
|
|
|
|
|
if (to_print++ > 2) break;
|
|
|
|
|
}
|
|
|
|
|
}
|
|
|
|
|
|
|
|
|
|
#ifndef ROCKSDB_LITE
|
|
|
|
|
void VerifyChecksum(ThreadState* thread) {
|
|
|
|
|
DB* db = SelectDB(thread);
|
|
|
|
|
ReadOptions ro;
|
|
|
|
|
ro.adaptive_readahead = FLAGS_adaptive_readahead;
|
|
|
|
|
ro.async_io = FLAGS_async_io;
|
|
|
|
|
ro.rate_limiter_priority =
|
|
|
|
|
FLAGS_rate_limit_user_ops ? Env::IO_USER : Env::IO_TOTAL;
|
|
|
|
|
ro.readahead_size = FLAGS_readahead_size;
|
|
|
|
|
Status s = db->VerifyChecksum(ro);
|
|
|
|
|
if (!s.ok()) {
|
|
|
|
|
fprintf(stderr, "VerifyChecksum() failed: %s\n", s.ToString().c_str());
|
|
|
|
|
exit(1);
|
|
|
|
|
}
|
|
|
|
|
}
|
|
|
|
|
|
|
|
|
|
void VerifyFileChecksums(ThreadState* thread) {
|
|
|
|
|
DB* db = SelectDB(thread);
|
|
|
|
|
ReadOptions ro;
|
|
|
|
|
ro.adaptive_readahead = FLAGS_adaptive_readahead;
|
|
|
|
|
ro.async_io = FLAGS_async_io;
|
|
|
|
|
ro.rate_limiter_priority =
|
|
|
|
|
FLAGS_rate_limit_user_ops ? Env::IO_USER : Env::IO_TOTAL;
|
|
|
|
|
ro.readahead_size = FLAGS_readahead_size;
|
|
|
|
|
Status s = db->VerifyFileChecksums(ro);
|
|
|
|
|
if (!s.ok()) {
|
|
|
|
|
fprintf(stderr, "VerifyFileChecksums() failed: %s\n",
|
|
|
|
|
s.ToString().c_str());
|
|
|
|
|
exit(1);
|
|
|
|
|
}
|
|
|
|
|
}
|
|
|
|
|
|
|
|
|
|
// This benchmark stress tests Transactions. For a given --duration (or
|
|
|
|
|
// total number of --writes, a Transaction will perform a read-modify-write
|
|
|
|
|
// to increment the value of a key in each of N(--transaction-sets) sets of
|
|
|
|
|
// keys (where each set has --num keys). If --threads is set, this will be
|
|
|
|
|
// done in parallel.
|
|
|
|
|
//
|
|
|
|
|
// To test transactions, use --transaction_db=true. Not setting this
|
|
|
|
|
// parameter
|
|
|
|
|
// will run the same benchmark without transactions.
|
|
|
|
|
//
|
|
|
|
|
// RandomTransactionVerify() will then validate the correctness of the results
|
|
|
|
|
// by checking if the sum of all keys in each set is the same.
|
|
|
|
|
void RandomTransaction(ThreadState* thread) {
|
|
|
|
|
Duration duration(FLAGS_duration, readwrites_);
|
|
|
|
|
uint16_t num_prefix_ranges = static_cast<uint16_t>(FLAGS_transaction_sets);
|
|
|
|
|
uint64_t transactions_done = 0;
|
|
|
|
|
|
|
|
|
|
if (num_prefix_ranges == 0 || num_prefix_ranges > 9999) {
|
|
|
|
|
fprintf(stderr, "invalid value for transaction_sets\n");
|
|
|
|
|
abort();
|
|
|
|
|
}
|
|
|
|
|
|
|
|
|
|
TransactionOptions txn_options;
|
|
|
|
|
txn_options.lock_timeout = FLAGS_transaction_lock_timeout;
|
|
|
|
|
txn_options.set_snapshot = FLAGS_transaction_set_snapshot;
|
|
|
|
|
|
|
|
|
|
RandomTransactionInserter inserter(&thread->rand, write_options_,
|
|
|
|
|
read_options_, FLAGS_num,
|
|
|
|
|
num_prefix_ranges);
|
|
|
|
|
|
|
|
|
|
if (FLAGS_num_multi_db > 1) {
|
|
|
|
|
fprintf(stderr,
|
|
|
|
|
"Cannot run RandomTransaction benchmark with "
|
|
|
|
|
"FLAGS_multi_db > 1.");
|
|
|
|
|
abort();
|
|
|
|
|
}
|
|
|
|
|
|
|
|
|
|
while (!duration.Done(1)) {
|
|
|
|
|
bool success;
|
|
|
|
|
|
|
|
|
|
// RandomTransactionInserter will attempt to insert a key for each
|
|
|
|
|
// # of FLAGS_transaction_sets
|
Pessimistic Transactions
Summary:
Initial implementation of Pessimistic Transactions. This diff contains the api changes discussed in D38913. This diff is pretty large, so let me know if people would prefer to meet up to discuss it.
MyRocks folks: please take a look at the API in include/rocksdb/utilities/transaction[_db].h and let me know if you have any issues.
Also, you'll notice a couple of TODOs in the implementation of RollbackToSavePoint(). After chatting with Siying, I'm going to send out a separate diff for an alternate implementation of this feature that implements the rollback inside of WriteBatch/WriteBatchWithIndex. We can then decide which route is preferable.
Next, I'm planning on doing some perf testing and then integrating this diff into MongoRocks for further testing.
Test Plan: Unit tests, db_bench parallel testing.
Reviewers: igor, rven, sdong, yhchiang, yoshinorim
Reviewed By: sdong
Subscribers: hermanlee4, maykov, spetrunia, leveldb, dhruba
Differential Revision: https://reviews.facebook.net/D40869
9 years ago
|
|
|
if (FLAGS_optimistic_transaction_db) {
|
|
|
|
|
success = inserter.OptimisticTransactionDBInsert(db_.opt_txn_db);
|
Pessimistic Transactions
Summary:
Initial implementation of Pessimistic Transactions. This diff contains the api changes discussed in D38913. This diff is pretty large, so let me know if people would prefer to meet up to discuss it.
MyRocks folks: please take a look at the API in include/rocksdb/utilities/transaction[_db].h and let me know if you have any issues.
Also, you'll notice a couple of TODOs in the implementation of RollbackToSavePoint(). After chatting with Siying, I'm going to send out a separate diff for an alternate implementation of this feature that implements the rollback inside of WriteBatch/WriteBatchWithIndex. We can then decide which route is preferable.
Next, I'm planning on doing some perf testing and then integrating this diff into MongoRocks for further testing.
Test Plan: Unit tests, db_bench parallel testing.
Reviewers: igor, rven, sdong, yhchiang, yoshinorim
Reviewed By: sdong
Subscribers: hermanlee4, maykov, spetrunia, leveldb, dhruba
Differential Revision: https://reviews.facebook.net/D40869
9 years ago
|
|
|
} else if (FLAGS_transaction_db) {
|
|
|
|
|
TransactionDB* txn_db = reinterpret_cast<TransactionDB*>(db_.db);
|
|
|
|
|
success = inserter.TransactionDBInsert(txn_db, txn_options);
|
|
|
|
|
} else {
|
|
|
|
|
success = inserter.DBInsert(db_.db);
|
|
|
|
|
}
|
|
|
|
|
|
|
|
|
|
if (!success) {
|
|
|
|
|
fprintf(stderr, "Unexpected error: %s\n",
|
|
|
|
|
inserter.GetLastStatus().ToString().c_str());
|
|
|
|
|
abort();
|
|
|
|
|
}
|
|
|
|
|
|
|
|
|
|
thread->stats.FinishedOps(nullptr, db_.db, 1, kOthers);
|
|
|
|
|
transactions_done++;
|
|
|
|
|
}
|
|
|
|
|
|
|
|
|
|
char msg[100];
|
Pessimistic Transactions
Summary:
Initial implementation of Pessimistic Transactions. This diff contains the api changes discussed in D38913. This diff is pretty large, so let me know if people would prefer to meet up to discuss it.
MyRocks folks: please take a look at the API in include/rocksdb/utilities/transaction[_db].h and let me know if you have any issues.
Also, you'll notice a couple of TODOs in the implementation of RollbackToSavePoint(). After chatting with Siying, I'm going to send out a separate diff for an alternate implementation of this feature that implements the rollback inside of WriteBatch/WriteBatchWithIndex. We can then decide which route is preferable.
Next, I'm planning on doing some perf testing and then integrating this diff into MongoRocks for further testing.
Test Plan: Unit tests, db_bench parallel testing.
Reviewers: igor, rven, sdong, yhchiang, yoshinorim
Reviewed By: sdong
Subscribers: hermanlee4, maykov, spetrunia, leveldb, dhruba
Differential Revision: https://reviews.facebook.net/D40869
9 years ago
|
|
|
if (FLAGS_optimistic_transaction_db || FLAGS_transaction_db) {
|
|
|
|
|
snprintf(msg, sizeof(msg),
|
|
|
|
|
"( transactions:%" PRIu64 " aborts:%" PRIu64 ")",
|
|
|
|
|
transactions_done, inserter.GetFailureCount());
|
|
|
|
|
} else {
|
|
|
|
|
snprintf(msg, sizeof(msg), "( batches:%" PRIu64 " )", transactions_done);
|
|
|
|
|
}
|
|
|
|
|
thread->stats.AddMessage(msg);
|
|
|
|
|
|
|
|
|
|
if (FLAGS_perf_level > ROCKSDB_NAMESPACE::PerfLevel::kDisable) {
|
|
|
|
|
thread->stats.AddMessage(std::string("PERF_CONTEXT:\n") +
|
|
|
|
|
get_perf_context()->ToString());
|
|
|
|
|
}
|
|
|
|
|
thread->stats.AddBytes(static_cast<int64_t>(inserter.GetBytesInserted()));
|
|
|
|
|
}
|
|
|
|
|
|
|
|
|
|
// Verifies consistency of data after RandomTransaction() has been run.
|
|
|
|
|
// Since each iteration of RandomTransaction() incremented a key in each set
|
|
|
|
|
// by the same value, the sum of the keys in each set should be the same.
|
|
|
|
|
void RandomTransactionVerify() {
|
Pessimistic Transactions
Summary:
Initial implementation of Pessimistic Transactions. This diff contains the api changes discussed in D38913. This diff is pretty large, so let me know if people would prefer to meet up to discuss it.
MyRocks folks: please take a look at the API in include/rocksdb/utilities/transaction[_db].h and let me know if you have any issues.
Also, you'll notice a couple of TODOs in the implementation of RollbackToSavePoint(). After chatting with Siying, I'm going to send out a separate diff for an alternate implementation of this feature that implements the rollback inside of WriteBatch/WriteBatchWithIndex. We can then decide which route is preferable.
Next, I'm planning on doing some perf testing and then integrating this diff into MongoRocks for further testing.
Test Plan: Unit tests, db_bench parallel testing.
Reviewers: igor, rven, sdong, yhchiang, yoshinorim
Reviewed By: sdong
Subscribers: hermanlee4, maykov, spetrunia, leveldb, dhruba
Differential Revision: https://reviews.facebook.net/D40869
9 years ago
|
|
|
if (!FLAGS_transaction_db && !FLAGS_optimistic_transaction_db) {
|
|
|
|
|
// transactions not used, nothing to verify.
|
|
|
|
|
return;
|
|
|
|
|
}
|
|
|
|
|
|
|
|
|
|
Status s =
|
|
|
|
|
RandomTransactionInserter::Verify(db_.db,
|
|
|
|
|
static_cast<uint16_t>(FLAGS_transaction_sets));
|
|
|
|
|
|
|
|
|
|
if (s.ok()) {
|
|
|
|
|
fprintf(stdout, "RandomTransactionVerify Success.\n");
|
|
|
|
|
} else {
|
|
|
|
|
fprintf(stdout, "RandomTransactionVerify FAILED!!\n");
|
|
|
|
|
}
|
|
|
|
|
}
|
|
|
|
|
#endif // ROCKSDB_LITE
|
|
|
|
|
|
Support for SingleDelete()
Summary:
This patch fixes #7460559. It introduces SingleDelete as a new database
operation. This operation can be used to delete keys that were never
overwritten (no put following another put of the same key). If an overwritten
key is single deleted the behavior is undefined. Single deletion of a
non-existent key has no effect but multiple consecutive single deletions are
not allowed (see limitations).
In contrast to the conventional Delete() operation, the deletion entry is
removed along with the value when the two are lined up in a compaction. Note:
The semantics are similar to @igor's prototype that allowed to have this
behavior on the granularity of a column family (
https://reviews.facebook.net/D42093 ). This new patch, however, is more
aggressive when it comes to removing tombstones: It removes the SingleDelete
together with the value whenever there is no snapshot between them while the
older patch only did this when the sequence number of the deletion was older
than the earliest snapshot.
Most of the complex additions are in the Compaction Iterator, all other changes
should be relatively straightforward. The patch also includes basic support for
single deletions in db_stress and db_bench.
Limitations:
- Not compatible with cuckoo hash tables
- Single deletions cannot be used in combination with merges and normal
deletions on the same key (other keys are not affected by this)
- Consecutive single deletions are currently not allowed (and older version of
this patch supported this so it could be resurrected if needed)
Test Plan: make all check
Reviewers: yhchiang, sdong, rven, anthony, yoshinorim, igor
Reviewed By: igor
Subscribers: maykov, dhruba, leveldb
Differential Revision: https://reviews.facebook.net/D43179
9 years ago
|
|
|
// Writes and deletes random keys without overwriting keys.
|
|
|
|
|
//
|
|
|
|
|
// This benchmark is intended to partially replicate the behavior of MyRocks
|
|
|
|
|
// secondary indices: All data is stored in keys and updates happen by
|
|
|
|
|
// deleting the old version of the key and inserting the new version.
|
|
|
|
|
void RandomReplaceKeys(ThreadState* thread) {
|
|
|
|
|
std::unique_ptr<const char[]> key_guard;
|
|
|
|
|
Slice key = AllocateKey(&key_guard);
|
|
|
|
|
std::unique_ptr<char[]> ts_guard;
|
|
|
|
|
if (user_timestamp_size_ > 0) {
|
|
|
|
|
ts_guard.reset(new char[user_timestamp_size_]);
|
|
|
|
|
}
|
Support for SingleDelete()
Summary:
This patch fixes #7460559. It introduces SingleDelete as a new database
operation. This operation can be used to delete keys that were never
overwritten (no put following another put of the same key). If an overwritten
key is single deleted the behavior is undefined. Single deletion of a
non-existent key has no effect but multiple consecutive single deletions are
not allowed (see limitations).
In contrast to the conventional Delete() operation, the deletion entry is
removed along with the value when the two are lined up in a compaction. Note:
The semantics are similar to @igor's prototype that allowed to have this
behavior on the granularity of a column family (
https://reviews.facebook.net/D42093 ). This new patch, however, is more
aggressive when it comes to removing tombstones: It removes the SingleDelete
together with the value whenever there is no snapshot between them while the
older patch only did this when the sequence number of the deletion was older
than the earliest snapshot.
Most of the complex additions are in the Compaction Iterator, all other changes
should be relatively straightforward. The patch also includes basic support for
single deletions in db_stress and db_bench.
Limitations:
- Not compatible with cuckoo hash tables
- Single deletions cannot be used in combination with merges and normal
deletions on the same key (other keys are not affected by this)
- Consecutive single deletions are currently not allowed (and older version of
this patch supported this so it could be resurrected if needed)
Test Plan: make all check
Reviewers: yhchiang, sdong, rven, anthony, yoshinorim, igor
Reviewed By: igor
Subscribers: maykov, dhruba, leveldb
Differential Revision: https://reviews.facebook.net/D43179
9 years ago
|
|
|
std::vector<uint32_t> counters(FLAGS_numdistinct, 0);
|
|
|
|
|
size_t max_counter = 50;
|
|
|
|
|
RandomGenerator gen;
|
|
|
|
|
|
|
|
|
|
Status s;
|
|
|
|
|
DB* db = SelectDB(thread);
|
|
|
|
|
for (int64_t i = 0; i < FLAGS_numdistinct; i++) {
|
|
|
|
|
GenerateKeyFromInt(i * max_counter, FLAGS_num, &key);
|
|
|
|
|
if (user_timestamp_size_ > 0) {
|
Revise APIs related to user-defined timestamp (#8946)
Summary:
ajkr reminded me that we have a rule of not including per-kv related data in `WriteOptions`.
Namely, `WriteOptions` should not include information about "what-to-write", but should just
include information about "how-to-write".
According to this rule, `WriteOptions::timestamp` (experimental) is clearly a violation. Therefore,
this PR removes `WriteOptions::timestamp` for compliance.
After the removal, we need to pass timestamp info via another set of APIs. This PR proposes a set
of overloaded functions `Put(write_opts, key, value, ts)`, `Delete(write_opts, key, ts)`, and
`SingleDelete(write_opts, key, ts)`. Planned to add `Write(write_opts, batch, ts)`, but its complexity
made me reconsider doing it in another PR (maybe).
For better checking and returning error early, we also add a new set of APIs to `WriteBatch` that take
extra `timestamp` information when writing to `WriteBatch`es.
These set of APIs in `WriteBatchWithIndex` are currently not supported, and are on our TODO list.
Removed `WriteBatch::AssignTimestamps()` and renamed `WriteBatch::AssignTimestamp()` to
`WriteBatch::UpdateTimestamps()` since this method require that all keys have space for timestamps
allocated already and multiple timestamps can be updated.
The constructor of `WriteBatch` now takes a fourth argument `default_cf_ts_sz` which is the timestamp
size of the default column family. This will be used to allocate space when calling APIs that do not
specify a column family handle.
Also, updated `DB::Get()`, `DB::MultiGet()`, `DB::NewIterator()`, `DB::NewIterators()` methods, replacing
some assertions about timestamp to returning Status code.
Pull Request resolved: https://github.com/facebook/rocksdb/pull/8946
Test Plan:
make check
./db_bench -benchmarks=fillseq,fillrandom,readrandom,readseq,deleterandom -user_timestamp_size=8
./db_stress --user_timestamp_size=8 -nooverwritepercent=0 -test_secondary=0 -secondary_catch_up_one_in=0 -continuous_verification_interval=0
Make sure there is no perf regression by running the following
```
./db_bench_opt -db=/dev/shm/rocksdb -use_existing_db=0 -level0_stop_writes_trigger=256 -level0_slowdown_writes_trigger=256 -level0_file_num_compaction_trigger=256 -disable_wal=1 -duration=10 -benchmarks=fillrandom
```
Before this PR
```
DB path: [/dev/shm/rocksdb]
fillrandom : 1.831 micros/op 546235 ops/sec; 60.4 MB/s
```
After this PR
```
DB path: [/dev/shm/rocksdb]
fillrandom : 1.820 micros/op 549404 ops/sec; 60.8 MB/s
```
Reviewed By: ltamasi
Differential Revision: D33721359
Pulled By: riversand963
fbshipit-source-id: c131561534272c120ffb80711d42748d21badf09
2 years ago
|
|
|
Slice ts = mock_app_clock_->Allocate(ts_guard.get());
|
|
|
|
|
s = db->Put(write_options_, key, ts, gen.Generate());
|
|
|
|
|
} else {
|
|
|
|
|
s = db->Put(write_options_, key, gen.Generate());
|
|
|
|
|
}
|
Support for SingleDelete()
Summary:
This patch fixes #7460559. It introduces SingleDelete as a new database
operation. This operation can be used to delete keys that were never
overwritten (no put following another put of the same key). If an overwritten
key is single deleted the behavior is undefined. Single deletion of a
non-existent key has no effect but multiple consecutive single deletions are
not allowed (see limitations).
In contrast to the conventional Delete() operation, the deletion entry is
removed along with the value when the two are lined up in a compaction. Note:
The semantics are similar to @igor's prototype that allowed to have this
behavior on the granularity of a column family (
https://reviews.facebook.net/D42093 ). This new patch, however, is more
aggressive when it comes to removing tombstones: It removes the SingleDelete
together with the value whenever there is no snapshot between them while the
older patch only did this when the sequence number of the deletion was older
than the earliest snapshot.
Most of the complex additions are in the Compaction Iterator, all other changes
should be relatively straightforward. The patch also includes basic support for
single deletions in db_stress and db_bench.
Limitations:
- Not compatible with cuckoo hash tables
- Single deletions cannot be used in combination with merges and normal
deletions on the same key (other keys are not affected by this)
- Consecutive single deletions are currently not allowed (and older version of
this patch supported this so it could be resurrected if needed)
Test Plan: make all check
Reviewers: yhchiang, sdong, rven, anthony, yoshinorim, igor
Reviewed By: igor
Subscribers: maykov, dhruba, leveldb
Differential Revision: https://reviews.facebook.net/D43179
9 years ago
|
|
|
if (!s.ok()) {
|
|
|
|
|
fprintf(stderr, "Operation failed: %s\n", s.ToString().c_str());
|
|
|
|
|
exit(1);
|
|
|
|
|
}
|
|
|
|
|
}
|
|
|
|
|
|
|
|
|
|
db->GetSnapshot();
|
|
|
|
|
|
|
|
|
|
std::default_random_engine generator;
|
|
|
|
|
std::normal_distribution<double> distribution(FLAGS_numdistinct / 2.0,
|
|
|
|
|
FLAGS_stddev);
|
|
|
|
|
Duration duration(FLAGS_duration, FLAGS_num);
|
|
|
|
|
while (!duration.Done(1)) {
|
|
|
|
|
int64_t rnd_id = static_cast<int64_t>(distribution(generator));
|
|
|
|
|
int64_t key_id = std::max(std::min(FLAGS_numdistinct - 1, rnd_id),
|
|
|
|
|
static_cast<int64_t>(0));
|
|
|
|
|
GenerateKeyFromInt(key_id * max_counter + counters[key_id], FLAGS_num,
|
|
|
|
|
&key);
|
|
|
|
|
if (user_timestamp_size_ > 0) {
|
Revise APIs related to user-defined timestamp (#8946)
Summary:
ajkr reminded me that we have a rule of not including per-kv related data in `WriteOptions`.
Namely, `WriteOptions` should not include information about "what-to-write", but should just
include information about "how-to-write".
According to this rule, `WriteOptions::timestamp` (experimental) is clearly a violation. Therefore,
this PR removes `WriteOptions::timestamp` for compliance.
After the removal, we need to pass timestamp info via another set of APIs. This PR proposes a set
of overloaded functions `Put(write_opts, key, value, ts)`, `Delete(write_opts, key, ts)`, and
`SingleDelete(write_opts, key, ts)`. Planned to add `Write(write_opts, batch, ts)`, but its complexity
made me reconsider doing it in another PR (maybe).
For better checking and returning error early, we also add a new set of APIs to `WriteBatch` that take
extra `timestamp` information when writing to `WriteBatch`es.
These set of APIs in `WriteBatchWithIndex` are currently not supported, and are on our TODO list.
Removed `WriteBatch::AssignTimestamps()` and renamed `WriteBatch::AssignTimestamp()` to
`WriteBatch::UpdateTimestamps()` since this method require that all keys have space for timestamps
allocated already and multiple timestamps can be updated.
The constructor of `WriteBatch` now takes a fourth argument `default_cf_ts_sz` which is the timestamp
size of the default column family. This will be used to allocate space when calling APIs that do not
specify a column family handle.
Also, updated `DB::Get()`, `DB::MultiGet()`, `DB::NewIterator()`, `DB::NewIterators()` methods, replacing
some assertions about timestamp to returning Status code.
Pull Request resolved: https://github.com/facebook/rocksdb/pull/8946
Test Plan:
make check
./db_bench -benchmarks=fillseq,fillrandom,readrandom,readseq,deleterandom -user_timestamp_size=8
./db_stress --user_timestamp_size=8 -nooverwritepercent=0 -test_secondary=0 -secondary_catch_up_one_in=0 -continuous_verification_interval=0
Make sure there is no perf regression by running the following
```
./db_bench_opt -db=/dev/shm/rocksdb -use_existing_db=0 -level0_stop_writes_trigger=256 -level0_slowdown_writes_trigger=256 -level0_file_num_compaction_trigger=256 -disable_wal=1 -duration=10 -benchmarks=fillrandom
```
Before this PR
```
DB path: [/dev/shm/rocksdb]
fillrandom : 1.831 micros/op 546235 ops/sec; 60.4 MB/s
```
After this PR
```
DB path: [/dev/shm/rocksdb]
fillrandom : 1.820 micros/op 549404 ops/sec; 60.8 MB/s
```
Reviewed By: ltamasi
Differential Revision: D33721359
Pulled By: riversand963
fbshipit-source-id: c131561534272c120ffb80711d42748d21badf09
2 years ago
|
|
|
Slice ts = mock_app_clock_->Allocate(ts_guard.get());
|
|
|
|
|
s = FLAGS_use_single_deletes ? db->SingleDelete(write_options_, key, ts)
|
|
|
|
|
: db->Delete(write_options_, key, ts);
|
|
|
|
|
} else {
|
|
|
|
|
s = FLAGS_use_single_deletes ? db->SingleDelete(write_options_, key)
|
|
|
|
|
: db->Delete(write_options_, key);
|
|
|
|
|
}
|
Support for SingleDelete()
Summary:
This patch fixes #7460559. It introduces SingleDelete as a new database
operation. This operation can be used to delete keys that were never
overwritten (no put following another put of the same key). If an overwritten
key is single deleted the behavior is undefined. Single deletion of a
non-existent key has no effect but multiple consecutive single deletions are
not allowed (see limitations).
In contrast to the conventional Delete() operation, the deletion entry is
removed along with the value when the two are lined up in a compaction. Note:
The semantics are similar to @igor's prototype that allowed to have this
behavior on the granularity of a column family (
https://reviews.facebook.net/D42093 ). This new patch, however, is more
aggressive when it comes to removing tombstones: It removes the SingleDelete
together with the value whenever there is no snapshot between them while the
older patch only did this when the sequence number of the deletion was older
than the earliest snapshot.
Most of the complex additions are in the Compaction Iterator, all other changes
should be relatively straightforward. The patch also includes basic support for
single deletions in db_stress and db_bench.
Limitations:
- Not compatible with cuckoo hash tables
- Single deletions cannot be used in combination with merges and normal
deletions on the same key (other keys are not affected by this)
- Consecutive single deletions are currently not allowed (and older version of
this patch supported this so it could be resurrected if needed)
Test Plan: make all check
Reviewers: yhchiang, sdong, rven, anthony, yoshinorim, igor
Reviewed By: igor
Subscribers: maykov, dhruba, leveldb
Differential Revision: https://reviews.facebook.net/D43179
9 years ago
|
|
|
if (s.ok()) {
|
|
|
|
|
counters[key_id] = (counters[key_id] + 1) % max_counter;
|
|
|
|
|
GenerateKeyFromInt(key_id * max_counter + counters[key_id], FLAGS_num,
|
|
|
|
|
&key);
|
|
|
|
|
if (user_timestamp_size_ > 0) {
|
Revise APIs related to user-defined timestamp (#8946)
Summary:
ajkr reminded me that we have a rule of not including per-kv related data in `WriteOptions`.
Namely, `WriteOptions` should not include information about "what-to-write", but should just
include information about "how-to-write".
According to this rule, `WriteOptions::timestamp` (experimental) is clearly a violation. Therefore,
this PR removes `WriteOptions::timestamp` for compliance.
After the removal, we need to pass timestamp info via another set of APIs. This PR proposes a set
of overloaded functions `Put(write_opts, key, value, ts)`, `Delete(write_opts, key, ts)`, and
`SingleDelete(write_opts, key, ts)`. Planned to add `Write(write_opts, batch, ts)`, but its complexity
made me reconsider doing it in another PR (maybe).
For better checking and returning error early, we also add a new set of APIs to `WriteBatch` that take
extra `timestamp` information when writing to `WriteBatch`es.
These set of APIs in `WriteBatchWithIndex` are currently not supported, and are on our TODO list.
Removed `WriteBatch::AssignTimestamps()` and renamed `WriteBatch::AssignTimestamp()` to
`WriteBatch::UpdateTimestamps()` since this method require that all keys have space for timestamps
allocated already and multiple timestamps can be updated.
The constructor of `WriteBatch` now takes a fourth argument `default_cf_ts_sz` which is the timestamp
size of the default column family. This will be used to allocate space when calling APIs that do not
specify a column family handle.
Also, updated `DB::Get()`, `DB::MultiGet()`, `DB::NewIterator()`, `DB::NewIterators()` methods, replacing
some assertions about timestamp to returning Status code.
Pull Request resolved: https://github.com/facebook/rocksdb/pull/8946
Test Plan:
make check
./db_bench -benchmarks=fillseq,fillrandom,readrandom,readseq,deleterandom -user_timestamp_size=8
./db_stress --user_timestamp_size=8 -nooverwritepercent=0 -test_secondary=0 -secondary_catch_up_one_in=0 -continuous_verification_interval=0
Make sure there is no perf regression by running the following
```
./db_bench_opt -db=/dev/shm/rocksdb -use_existing_db=0 -level0_stop_writes_trigger=256 -level0_slowdown_writes_trigger=256 -level0_file_num_compaction_trigger=256 -disable_wal=1 -duration=10 -benchmarks=fillrandom
```
Before this PR
```
DB path: [/dev/shm/rocksdb]
fillrandom : 1.831 micros/op 546235 ops/sec; 60.4 MB/s
```
After this PR
```
DB path: [/dev/shm/rocksdb]
fillrandom : 1.820 micros/op 549404 ops/sec; 60.8 MB/s
```
Reviewed By: ltamasi
Differential Revision: D33721359
Pulled By: riversand963
fbshipit-source-id: c131561534272c120ffb80711d42748d21badf09
2 years ago
|
|
|
Slice ts = mock_app_clock_->Allocate(ts_guard.get());
|
|
|
|
|
s = db->Put(write_options_, key, ts, Slice());
|
|
|
|
|
} else {
|
|
|
|
|
s = db->Put(write_options_, key, Slice());
|
|
|
|
|
}
|
Support for SingleDelete()
Summary:
This patch fixes #7460559. It introduces SingleDelete as a new database
operation. This operation can be used to delete keys that were never
overwritten (no put following another put of the same key). If an overwritten
key is single deleted the behavior is undefined. Single deletion of a
non-existent key has no effect but multiple consecutive single deletions are
not allowed (see limitations).
In contrast to the conventional Delete() operation, the deletion entry is
removed along with the value when the two are lined up in a compaction. Note:
The semantics are similar to @igor's prototype that allowed to have this
behavior on the granularity of a column family (
https://reviews.facebook.net/D42093 ). This new patch, however, is more
aggressive when it comes to removing tombstones: It removes the SingleDelete
together with the value whenever there is no snapshot between them while the
older patch only did this when the sequence number of the deletion was older
than the earliest snapshot.
Most of the complex additions are in the Compaction Iterator, all other changes
should be relatively straightforward. The patch also includes basic support for
single deletions in db_stress and db_bench.
Limitations:
- Not compatible with cuckoo hash tables
- Single deletions cannot be used in combination with merges and normal
deletions on the same key (other keys are not affected by this)
- Consecutive single deletions are currently not allowed (and older version of
this patch supported this so it could be resurrected if needed)
Test Plan: make all check
Reviewers: yhchiang, sdong, rven, anthony, yoshinorim, igor
Reviewed By: igor
Subscribers: maykov, dhruba, leveldb
Differential Revision: https://reviews.facebook.net/D43179
9 years ago
|
|
|
}
|
|
|
|
|
|
|
|
|
|
if (!s.ok()) {
|
|
|
|
|
fprintf(stderr, "Operation failed: %s\n", s.ToString().c_str());
|
|
|
|
|
exit(1);
|
|
|
|
|
}
|
|
|
|
|
|
|
|
|
|
thread->stats.FinishedOps(nullptr, db, 1, kOthers);
|
Support for SingleDelete()
Summary:
This patch fixes #7460559. It introduces SingleDelete as a new database
operation. This operation can be used to delete keys that were never
overwritten (no put following another put of the same key). If an overwritten
key is single deleted the behavior is undefined. Single deletion of a
non-existent key has no effect but multiple consecutive single deletions are
not allowed (see limitations).
In contrast to the conventional Delete() operation, the deletion entry is
removed along with the value when the two are lined up in a compaction. Note:
The semantics are similar to @igor's prototype that allowed to have this
behavior on the granularity of a column family (
https://reviews.facebook.net/D42093 ). This new patch, however, is more
aggressive when it comes to removing tombstones: It removes the SingleDelete
together with the value whenever there is no snapshot between them while the
older patch only did this when the sequence number of the deletion was older
than the earliest snapshot.
Most of the complex additions are in the Compaction Iterator, all other changes
should be relatively straightforward. The patch also includes basic support for
single deletions in db_stress and db_bench.
Limitations:
- Not compatible with cuckoo hash tables
- Single deletions cannot be used in combination with merges and normal
deletions on the same key (other keys are not affected by this)
- Consecutive single deletions are currently not allowed (and older version of
this patch supported this so it could be resurrected if needed)
Test Plan: make all check
Reviewers: yhchiang, sdong, rven, anthony, yoshinorim, igor
Reviewed By: igor
Subscribers: maykov, dhruba, leveldb
Differential Revision: https://reviews.facebook.net/D43179
9 years ago
|
|
|
}
|
|
|
|
|
|
|
|
|
|
char msg[200];
|
|
|
|
|
snprintf(msg, sizeof(msg),
|
|
|
|
|
"use single deletes: %d, "
|
|
|
|
|
"standard deviation: %lf\n",
|
|
|
|
|
FLAGS_use_single_deletes, FLAGS_stddev);
|
|
|
|
|
thread->stats.AddMessage(msg);
|
|
|
|
|
}
|
|
|
|
|
|
|
|
|
|
void TimeSeriesReadOrDelete(ThreadState* thread, bool do_deletion) {
|
|
|
|
|
int64_t read = 0;
|
|
|
|
|
int64_t found = 0;
|
|
|
|
|
int64_t bytes = 0;
|
|
|
|
|
|
|
|
|
|
Iterator* iter = nullptr;
|
|
|
|
|
// Only work on single database
|
|
|
|
|
assert(db_.db != nullptr);
|
|
|
|
|
iter = db_.db->NewIterator(read_options_);
|
|
|
|
|
|
|
|
|
|
std::unique_ptr<const char[]> key_guard;
|
|
|
|
|
Slice key = AllocateKey(&key_guard);
|
|
|
|
|
|
|
|
|
|
char value_buffer[256];
|
|
|
|
|
while (true) {
|
|
|
|
|
{
|
|
|
|
|
MutexLock l(&thread->shared->mu);
|
|
|
|
|
if (thread->shared->num_done >= 1) {
|
|
|
|
|
// Write thread have finished
|
|
|
|
|
break;
|
|
|
|
|
}
|
|
|
|
|
}
|
|
|
|
|
if (!FLAGS_use_tailing_iterator) {
|
|
|
|
|
delete iter;
|
|
|
|
|
iter = db_.db->NewIterator(read_options_);
|
|
|
|
|
}
|
|
|
|
|
// Pick a Iterator to use
|
|
|
|
|
|
|
|
|
|
int64_t key_id = thread->rand.Next() % FLAGS_key_id_range;
|
|
|
|
|
GenerateKeyFromInt(key_id, FLAGS_num, &key);
|
|
|
|
|
// Reset last 8 bytes to 0
|
|
|
|
|
char* start = const_cast<char*>(key.data());
|
|
|
|
|
start += key.size() - 8;
|
|
|
|
|
memset(start, 0, 8);
|
|
|
|
|
++read;
|
|
|
|
|
|
|
|
|
|
bool key_found = false;
|
|
|
|
|
// Seek the prefix
|
|
|
|
|
for (iter->Seek(key); iter->Valid() && iter->key().starts_with(key);
|
|
|
|
|
iter->Next()) {
|
|
|
|
|
key_found = true;
|
|
|
|
|
// Copy out iterator's value to make sure we read them.
|
|
|
|
|
if (do_deletion) {
|
|
|
|
|
bytes += iter->key().size();
|
|
|
|
|
if (KeyExpired(timestamp_emulator_.get(), iter->key())) {
|
|
|
|
|
thread->stats.FinishedOps(&db_, db_.db, 1, kDelete);
|
|
|
|
|
db_.db->Delete(write_options_, iter->key());
|
|
|
|
|
} else {
|
|
|
|
|
break;
|
|
|
|
|
}
|
|
|
|
|
} else {
|
|
|
|
|
bytes += iter->key().size() + iter->value().size();
|
|
|
|
|
thread->stats.FinishedOps(&db_, db_.db, 1, kRead);
|
|
|
|
|
Slice value = iter->value();
|
|
|
|
|
memcpy(value_buffer, value.data(),
|
|
|
|
|
std::min(value.size(), sizeof(value_buffer)));
|
|
|
|
|
|
|
|
|
|
assert(iter->status().ok());
|
|
|
|
|
}
|
|
|
|
|
}
|
|
|
|
|
found += key_found;
|
|
|
|
|
|
|
|
|
|
if (thread->shared->read_rate_limiter.get() != nullptr) {
|
|
|
|
|
thread->shared->read_rate_limiter->Request(
|
|
|
|
|
1, Env::IO_HIGH, nullptr /* stats */, RateLimiter::OpType::kRead);
|
|
|
|
|
}
|
|
|
|
|
}
|
|
|
|
|
delete iter;
|
|
|
|
|
|
|
|
|
|
char msg[100];
|
|
|
|
|
snprintf(msg, sizeof(msg), "(%" PRIu64 " of %" PRIu64 " found)", found,
|
|
|
|
|
read);
|
|
|
|
|
thread->stats.AddBytes(bytes);
|
|
|
|
|
thread->stats.AddMessage(msg);
|
|
|
|
|
if (FLAGS_perf_level > ROCKSDB_NAMESPACE::PerfLevel::kDisable) {
|
|
|
|
|
thread->stats.AddMessage(std::string("PERF_CONTEXT:\n") +
|
|
|
|
|
get_perf_context()->ToString());
|
|
|
|
|
}
|
|
|
|
|
}
|
|
|
|
|
|
|
|
|
|
void TimeSeriesWrite(ThreadState* thread) {
|
|
|
|
|
// Special thread that keeps writing until other threads are done.
|
|
|
|
|
RandomGenerator gen;
|
|
|
|
|
int64_t bytes = 0;
|
|
|
|
|
|
|
|
|
|
// Don't merge stats from this thread with the readers.
|
|
|
|
|
thread->stats.SetExcludeFromMerge();
|
|
|
|
|
|
|
|
|
|
std::unique_ptr<RateLimiter> write_rate_limiter;
|
|
|
|
|
if (FLAGS_benchmark_write_rate_limit > 0) {
|
|
|
|
|
write_rate_limiter.reset(
|
|
|
|
|
NewGenericRateLimiter(FLAGS_benchmark_write_rate_limit));
|
|
|
|
|
}
|
|
|
|
|
|
|
|
|
|
std::unique_ptr<const char[]> key_guard;
|
|
|
|
|
Slice key = AllocateKey(&key_guard);
|
|
|
|
|
|
|
|
|
|
Duration duration(FLAGS_duration, writes_);
|
|
|
|
|
while (!duration.Done(1)) {
|
|
|
|
|
DB* db = SelectDB(thread);
|
|
|
|
|
|
|
|
|
|
uint64_t key_id = thread->rand.Next() % FLAGS_key_id_range;
|
|
|
|
|
// Write key id
|
|
|
|
|
GenerateKeyFromInt(key_id, FLAGS_num, &key);
|
|
|
|
|
// Write timestamp
|
|
|
|
|
|
|
|
|
|
char* start = const_cast<char*>(key.data());
|
|
|
|
|
char* pos = start + 8;
|
|
|
|
|
int bytes_to_fill =
|
|
|
|
|
std::min(key_size_ - static_cast<int>(pos - start), 8);
|
|
|
|
|
uint64_t timestamp_value = timestamp_emulator_->Get();
|
|
|
|
|
if (port::kLittleEndian) {
|
|
|
|
|
for (int i = 0; i < bytes_to_fill; ++i) {
|
|
|
|
|
pos[i] = (timestamp_value >> ((bytes_to_fill - i - 1) << 3)) & 0xFF;
|
|
|
|
|
}
|
|
|
|
|
} else {
|
|
|
|
|
memcpy(pos, static_cast<void*>(×tamp_value), bytes_to_fill);
|
|
|
|
|
}
|
|
|
|
|
|
|
|
|
|
timestamp_emulator_->Inc();
|
|
|
|
|
|
|
|
|
|
Status s;
|
|
|
|
|
Slice val = gen.Generate();
|
|
|
|
|
s = db->Put(write_options_, key, val);
|
|
|
|
|
|
|
|
|
|
if (!s.ok()) {
|
|
|
|
|
fprintf(stderr, "put error: %s\n", s.ToString().c_str());
|
|
|
|
|
ErrorExit();
|
|
|
|
|
}
|
|
|
|
|
bytes = key.size() + val.size();
|
|
|
|
|
thread->stats.FinishedOps(&db_, db_.db, 1, kWrite);
|
|
|
|
|
thread->stats.AddBytes(bytes);
|
|
|
|
|
|
|
|
|
|
if (FLAGS_benchmark_write_rate_limit > 0) {
|
|
|
|
|
write_rate_limiter->Request(
|
|
|
|
|
key.size() + val.size(), Env::IO_HIGH,
|
|
|
|
|
nullptr /* stats */, RateLimiter::OpType::kWrite);
|
|
|
|
|
}
|
|
|
|
|
}
|
|
|
|
|
}
|
|
|
|
|
|
|
|
|
|
void TimeSeries(ThreadState* thread) {
|
|
|
|
|
if (thread->tid > 0) {
|
|
|
|
|
bool do_deletion = FLAGS_expire_style == "delete" &&
|
|
|
|
|
thread->tid <= FLAGS_num_deletion_threads;
|
|
|
|
|
TimeSeriesReadOrDelete(thread, do_deletion);
|
|
|
|
|
} else {
|
|
|
|
|
TimeSeriesWrite(thread);
|
|
|
|
|
thread->stats.Stop();
|
|
|
|
|
thread->stats.Report("timeseries write");
|
|
|
|
|
}
|
|
|
|
|
}
|
|
|
|
|
|
|
|
|
|
void Compact(ThreadState* thread) {
|
|
|
|
|
DB* db = SelectDB(thread);
|
|
|
|
|
CompactRangeOptions cro;
|
|
|
|
|
cro.bottommost_level_compaction =
|
|
|
|
|
BottommostLevelCompaction::kForceOptimized;
|
|
|
|
|
db->CompactRange(cro, nullptr, nullptr);
|
|
|
|
|
}
|
|
|
|
|
|
|
|
|
|
void CompactAll() {
|
|
|
|
|
if (db_.db != nullptr) {
|
|
|
|
|
db_.db->CompactRange(CompactRangeOptions(), nullptr, nullptr);
|
|
|
|
|
}
|
|
|
|
|
for (const auto& db_with_cfh : multi_dbs_) {
|
|
|
|
|
db_with_cfh.db->CompactRange(CompactRangeOptions(), nullptr, nullptr);
|
|
|
|
|
}
|
|
|
|
|
}
|
|
|
|
|
|
|
|
|
|
#ifndef ROCKSDB_LITE
|
|
|
|
|
void WaitForCompactionHelper(DBWithColumnFamilies& db) {
|
|
|
|
|
// This is an imperfect way of waiting for compaction. The loop and sleep
|
|
|
|
|
// is done because a thread that finishes a compaction job should get a
|
|
|
|
|
// chance to pickup a new compaction job.
|
|
|
|
|
|
|
|
|
|
std::vector<std::string> keys = {DB::Properties::kMemTableFlushPending,
|
|
|
|
|
DB::Properties::kNumRunningFlushes,
|
|
|
|
|
DB::Properties::kCompactionPending,
|
|
|
|
|
DB::Properties::kNumRunningCompactions};
|
|
|
|
|
|
|
|
|
|
fprintf(stdout, "waitforcompaction(%s): started\n",
|
|
|
|
|
db.db->GetName().c_str());
|
|
|
|
|
|
|
|
|
|
while (true) {
|
|
|
|
|
bool retry = false;
|
|
|
|
|
|
|
|
|
|
for (const auto& k : keys) {
|
|
|
|
|
uint64_t v;
|
|
|
|
|
if (!db.db->GetIntProperty(k, &v)) {
|
|
|
|
|
fprintf(stderr, "waitforcompaction(%s): GetIntProperty(%s) failed\n",
|
|
|
|
|
db.db->GetName().c_str(), k.c_str());
|
|
|
|
|
exit(1);
|
|
|
|
|
} else if (v > 0) {
|
|
|
|
|
fprintf(stdout,
|
|
|
|
|
"waitforcompaction(%s): active(%s). Sleep 10 seconds\n",
|
|
|
|
|
db.db->GetName().c_str(), k.c_str());
|
|
|
|
|
FLAGS_env->SleepForMicroseconds(10 * 1000000);
|
|
|
|
|
retry = true;
|
|
|
|
|
break;
|
|
|
|
|
}
|
|
|
|
|
}
|
|
|
|
|
|
|
|
|
|
if (!retry) {
|
|
|
|
|
fprintf(stdout, "waitforcompaction(%s): finished\n",
|
|
|
|
|
db.db->GetName().c_str());
|
|
|
|
|
return;
|
|
|
|
|
}
|
|
|
|
|
}
|
|
|
|
|
}
|
|
|
|
|
|
|
|
|
|
void WaitForCompaction() {
|
|
|
|
|
// Give background threads a chance to wake
|
|
|
|
|
FLAGS_env->SleepForMicroseconds(5 * 1000000);
|
|
|
|
|
|
|
|
|
|
// I am skeptical that this check race free. I hope that checking twice
|
|
|
|
|
// reduces the chance.
|
|
|
|
|
if (db_.db != nullptr) {
|
|
|
|
|
WaitForCompactionHelper(db_);
|
|
|
|
|
WaitForCompactionHelper(db_);
|
|
|
|
|
} else {
|
|
|
|
|
for (auto& db_with_cfh : multi_dbs_) {
|
|
|
|
|
WaitForCompactionHelper(db_with_cfh);
|
|
|
|
|
WaitForCompactionHelper(db_with_cfh);
|
|
|
|
|
}
|
|
|
|
|
}
|
|
|
|
|
}
|
|
|
|
|
|
|
|
|
|
bool CompactLevelHelper(DBWithColumnFamilies& db_with_cfh, int from_level) {
|
|
|
|
|
std::vector<LiveFileMetaData> files;
|
|
|
|
|
db_with_cfh.db->GetLiveFilesMetaData(&files);
|
|
|
|
|
|
|
|
|
|
assert(from_level == 0 || from_level == 1);
|
|
|
|
|
|
|
|
|
|
int real_from_level = from_level;
|
|
|
|
|
if (real_from_level > 0) {
|
|
|
|
|
// With dynamic leveled compaction the first level with data beyond L0
|
|
|
|
|
// might not be L1.
|
|
|
|
|
real_from_level = std::numeric_limits<int>::max();
|
|
|
|
|
|
|
|
|
|
for (auto& f : files) {
|
|
|
|
|
if (f.level > 0 && f.level < real_from_level) real_from_level = f.level;
|
|
|
|
|
}
|
|
|
|
|
|
|
|
|
|
if (real_from_level == std::numeric_limits<int>::max()) {
|
|
|
|
|
fprintf(stdout, "compact%d found 0 files to compact\n", from_level);
|
|
|
|
|
return true;
|
|
|
|
|
}
|
|
|
|
|
}
|
|
|
|
|
|
|
|
|
|
// The goal is to compact from from_level to the level that follows it,
|
|
|
|
|
// and with dynamic leveled compaction the next level might not be
|
|
|
|
|
// real_from_level+1
|
|
|
|
|
int next_level = std::numeric_limits<int>::max();
|
|
|
|
|
|
|
|
|
|
std::vector<std::string> files_to_compact;
|
|
|
|
|
for (auto& f : files) {
|
|
|
|
|
if (f.level == real_from_level)
|
|
|
|
|
files_to_compact.push_back(f.name);
|
|
|
|
|
else if (f.level > real_from_level && f.level < next_level)
|
|
|
|
|
next_level = f.level;
|
|
|
|
|
}
|
|
|
|
|
|
|
|
|
|
if (files_to_compact.empty()) {
|
|
|
|
|
fprintf(stdout, "compact%d found 0 files to compact\n", from_level);
|
|
|
|
|
return true;
|
|
|
|
|
} else if (next_level == std::numeric_limits<int>::max()) {
|
|
|
|
|
// There is no data beyond real_from_level. So we are done.
|
|
|
|
|
fprintf(stdout, "compact%d found no data beyond L%d\n", from_level,
|
|
|
|
|
real_from_level);
|
|
|
|
|
return true;
|
|
|
|
|
}
|
|
|
|
|
|
|
|
|
|
fprintf(stdout, "compact%d found %d files to compact from L%d to L%d\n",
|
|
|
|
|
from_level, static_cast<int>(files_to_compact.size()),
|
|
|
|
|
real_from_level, next_level);
|
|
|
|
|
|
|
|
|
|
ROCKSDB_NAMESPACE::CompactionOptions options;
|
|
|
|
|
// Lets RocksDB use the configured compression for this level
|
|
|
|
|
options.compression = ROCKSDB_NAMESPACE::kDisableCompressionOption;
|
|
|
|
|
|
|
|
|
|
ROCKSDB_NAMESPACE::ColumnFamilyDescriptor cfDesc;
|
|
|
|
|
db_with_cfh.db->DefaultColumnFamily()->GetDescriptor(&cfDesc);
|
|
|
|
|
options.output_file_size_limit = cfDesc.options.target_file_size_base;
|
|
|
|
|
|
|
|
|
|
Status status =
|
|
|
|
|
db_with_cfh.db->CompactFiles(options, files_to_compact, next_level);
|
|
|
|
|
if (!status.ok()) {
|
|
|
|
|
// This can fail for valid reasons including the operation was aborted
|
|
|
|
|
// or a filename is invalid because background compaction removed it.
|
|
|
|
|
// Having read the current cases for which an error is raised I prefer
|
|
|
|
|
// not to figure out whether an exception should be thrown here.
|
|
|
|
|
fprintf(stderr, "compact%d CompactFiles failed: %s\n", from_level,
|
|
|
|
|
status.ToString().c_str());
|
|
|
|
|
return false;
|
|
|
|
|
}
|
|
|
|
|
return true;
|
|
|
|
|
}
|
|
|
|
|
|
|
|
|
|
void CompactLevel(int from_level) {
|
|
|
|
|
if (db_.db != nullptr) {
|
|
|
|
|
while (!CompactLevelHelper(db_, from_level)) WaitForCompaction();
|
|
|
|
|
}
|
|
|
|
|
for (auto& db_with_cfh : multi_dbs_) {
|
|
|
|
|
while (!CompactLevelHelper(db_with_cfh, from_level)) WaitForCompaction();
|
|
|
|
|
}
|
|
|
|
|
}
|
|
|
|
|
#endif
|
|
|
|
|
|
|
|
|
|
void Flush() {
|
|
|
|
|
FlushOptions flush_opt;
|
|
|
|
|
flush_opt.wait = true;
|
|
|
|
|
|
|
|
|
|
if (db_.db != nullptr) {
|
|
|
|
|
Status s = db_.db->Flush(flush_opt, db_.cfh);
|
|
|
|
|
if (!s.ok()) {
|
|
|
|
|
fprintf(stderr, "Flush failed: %s\n", s.ToString().c_str());
|
|
|
|
|
exit(1);
|
|
|
|
|
}
|
|
|
|
|
} else {
|
|
|
|
|
for (const auto& db_with_cfh : multi_dbs_) {
|
|
|
|
|
Status s = db_with_cfh.db->Flush(flush_opt, db_with_cfh.cfh);
|
|
|
|
|
if (!s.ok()) {
|
|
|
|
|
fprintf(stderr, "Flush failed: %s\n", s.ToString().c_str());
|
|
|
|
|
exit(1);
|
|
|
|
|
}
|
|
|
|
|
}
|
|
|
|
|
}
|
|
|
|
|
fprintf(stdout, "flush memtable\n");
|
|
|
|
|
}
|
|
|
|
|
|
|
|
|
|
void ResetStats() {
|
|
|
|
|
if (db_.db != nullptr) {
|
|
|
|
|
db_.db->ResetStats();
|
|
|
|
|
}
|
|
|
|
|
for (const auto& db_with_cfh : multi_dbs_) {
|
|
|
|
|
db_with_cfh.db->ResetStats();
|
|
|
|
|
}
|
|
|
|
|
}
|
|
|
|
|
|
|
|
|
|
void PrintStatsHistory() {
|
|
|
|
|
if (db_.db != nullptr) {
|
|
|
|
|
PrintStatsHistoryImpl(db_.db, false);
|
|
|
|
|
}
|
|
|
|
|
for (const auto& db_with_cfh : multi_dbs_) {
|
|
|
|
|
PrintStatsHistoryImpl(db_with_cfh.db, true);
|
|
|
|
|
}
|
|
|
|
|
}
|
|
|
|
|
|
|
|
|
|
void PrintStatsHistoryImpl(DB* db, bool print_header) {
|
|
|
|
|
if (print_header) {
|
|
|
|
|
fprintf(stdout, "\n==== DB: %s ===\n", db->GetName().c_str());
|
|
|
|
|
}
|
|
|
|
|
|
|
|
|
|
std::unique_ptr<StatsHistoryIterator> shi;
|
|
|
|
|
Status s = db->GetStatsHistory(0, port::kMaxUint64, &shi);
|
|
|
|
|
if (!s.ok()) {
|
|
|
|
|
fprintf(stdout, "%s\n", s.ToString().c_str());
|
|
|
|
|
return;
|
|
|
|
|
}
|
|
|
|
|
assert(shi);
|
|
|
|
|
while (shi->Valid()) {
|
|
|
|
|
uint64_t stats_time = shi->GetStatsTime();
|
|
|
|
|
fprintf(stdout, "------ %s ------\n",
|
|
|
|
|
TimeToHumanString(static_cast<int>(stats_time)).c_str());
|
|
|
|
|
for (auto& entry : shi->GetStatsMap()) {
|
|
|
|
|
fprintf(stdout, " %" PRIu64 " %s %" PRIu64 "\n", stats_time,
|
|
|
|
|
entry.first.c_str(), entry.second);
|
|
|
|
|
}
|
|
|
|
|
shi->Next();
|
|
|
|
|
}
|
|
|
|
|
}
|
|
|
|
|
|
|
|
|
|
void PrintStats(const char* key) {
|
|
|
|
|
if (db_.db != nullptr) {
|
|
|
|
|
PrintStats(db_.db, key, false);
|
|
|
|
|
}
|
|
|
|
|
for (const auto& db_with_cfh : multi_dbs_) {
|
|
|
|
|
PrintStats(db_with_cfh.db, key, true);
|
|
|
|
|
}
|
|
|
|
|
}
|
|
|
|
|
|
|
|
|
|
void PrintStats(DB* db, const char* key, bool print_header = false) {
|
|
|
|
|
if (print_header) {
|
|
|
|
|
fprintf(stdout, "\n==== DB: %s ===\n", db->GetName().c_str());
|
|
|
|
|
}
|
|
|
|
|
std::string stats;
|
|
|
|
|
if (!db->GetProperty(key, &stats)) {
|
|
|
|
|
stats = "(failed)";
|
|
|
|
|
}
|
|
|
|
|
fprintf(stdout, "\n%s\n", stats.c_str());
|
|
|
|
|
}
|
|
|
|
|
|
|
|
|
|
void PrintStats(const std::vector<std::string>& keys) {
|
|
|
|
|
if (db_.db != nullptr) {
|
|
|
|
|
PrintStats(db_.db, keys);
|
|
|
|
|
}
|
|
|
|
|
for (const auto& db_with_cfh : multi_dbs_) {
|
|
|
|
|
PrintStats(db_with_cfh.db, keys, true);
|
|
|
|
|
}
|
|
|
|
|
}
|
|
|
|
|
|
|
|
|
|
void PrintStats(DB* db, const std::vector<std::string>& keys,
|
|
|
|
|
bool print_header = false) {
|
|
|
|
|
if (print_header) {
|
|
|
|
|
fprintf(stdout, "\n==== DB: %s ===\n", db->GetName().c_str());
|
|
|
|
|
}
|
|
|
|
|
|
|
|
|
|
for (const auto& key : keys) {
|
|
|
|
|
std::string stats;
|
|
|
|
|
if (!db->GetProperty(key, &stats)) {
|
|
|
|
|
stats = "(failed)";
|
|
|
|
|
}
|
|
|
|
|
fprintf(stdout, "%s: %s\n", key.c_str(), stats.c_str());
|
|
|
|
|
}
|
|
|
|
|
}
|
|
|
|
|
|
|
|
|
|
#ifndef ROCKSDB_LITE
|
|
|
|
|
|
|
|
|
|
void Replay(ThreadState* thread) {
|
|
|
|
|
if (db_.db != nullptr) {
|
|
|
|
|
Replay(thread, &db_);
|
|
|
|
|
}
|
|
|
|
|
}
|
|
|
|
|
|
|
|
|
|
void Replay(ThreadState* /*thread*/, DBWithColumnFamilies* db_with_cfh) {
|
|
|
|
|
Status s;
|
|
|
|
|
std::unique_ptr<TraceReader> trace_reader;
|
|
|
|
|
s = NewFileTraceReader(FLAGS_env, EnvOptions(), FLAGS_trace_file,
|
|
|
|
|
&trace_reader);
|
|
|
|
|
if (!s.ok()) {
|
|
|
|
|
fprintf(
|
|
|
|
|
stderr,
|
|
|
|
|
"Encountered an error creating a TraceReader from the trace file. "
|
|
|
|
|
"Error: %s\n",
|
|
|
|
|
s.ToString().c_str());
|
|
|
|
|
exit(1);
|
|
|
|
|
}
|
|
|
|
|
std::unique_ptr<Replayer> replayer;
|
|
|
|
|
s = db_with_cfh->db->NewDefaultReplayer(db_with_cfh->cfh,
|
|
|
|
|
std::move(trace_reader), &replayer);
|
|
|
|
|
if (!s.ok()) {
|
|
|
|
|
fprintf(stderr,
|
|
|
|
|
"Encountered an error creating a default Replayer. "
|
|
|
|
|
"Error: %s\n",
|
|
|
|
|
s.ToString().c_str());
|
|
|
|
|
exit(1);
|
|
|
|
|
}
|
|
|
|
|
s = replayer->Prepare();
|
|
|
|
|
if (!s.ok()) {
|
|
|
|
|
fprintf(stderr, "Prepare for replay failed. Error: %s\n",
|
|
|
|
|
s.ToString().c_str());
|
|
|
|
|
}
|
|
|
|
|
s = replayer->Replay(
|
|
|
|
|
ReplayOptions(static_cast<uint32_t>(FLAGS_trace_replay_threads),
|
|
|
|
|
FLAGS_trace_replay_fast_forward),
|
|
|
|
|
nullptr);
|
|
|
|
|
replayer.reset();
|
|
|
|
|
if (s.ok()) {
|
|
|
|
|
fprintf(stdout, "Replay completed from trace_file: %s\n",
|
|
|
|
|
FLAGS_trace_file.c_str());
|
|
|
|
|
} else {
|
|
|
|
|
fprintf(stderr, "Replay failed. Error: %s\n", s.ToString().c_str());
|
|
|
|
|
}
|
|
|
|
|
}
|
|
|
|
|
|
|
|
|
|
#endif // ROCKSDB_LITE
|
|
|
|
|
};
|
|
|
|
|
|
|
|
|
|
int db_bench_tool(int argc, char** argv) {
|
|
|
|
|
ROCKSDB_NAMESPACE::port::InstallStackTraceHandler();
|
|
|
|
|
ConfigOptions config_options;
|
|
|
|
|
static bool initialized = false;
|
|
|
|
|
if (!initialized) {
|
|
|
|
|
SetUsageMessage(std::string("\nUSAGE:\n") + std::string(argv[0]) +
|
|
|
|
|
" [OPTIONS]...");
|
|
|
|
|
initialized = true;
|
|
|
|
|
}
|
|
|
|
|
ParseCommandLineFlags(&argc, &argv, true);
|
|
|
|
|
FLAGS_compaction_style_e =
|
|
|
|
|
(ROCKSDB_NAMESPACE::CompactionStyle)FLAGS_compaction_style;
|
|
|
|
|
#ifndef ROCKSDB_LITE
|
|
|
|
|
if (FLAGS_statistics && !FLAGS_statistics_string.empty()) {
|
|
|
|
|
fprintf(stderr,
|
|
|
|
|
"Cannot provide both --statistics and --statistics_string.\n");
|
|
|
|
|
exit(1);
|
|
|
|
|
}
|
|
|
|
|
if (!FLAGS_statistics_string.empty()) {
|
|
|
|
|
Status s = Statistics::CreateFromString(config_options,
|
|
|
|
|
FLAGS_statistics_string, &dbstats);
|
|
|
|
|
if (dbstats == nullptr) {
|
|
|
|
|
fprintf(stderr,
|
|
|
|
|
"No Statistics registered matching string: %s status=%s\n",
|
|
|
|
|
FLAGS_statistics_string.c_str(), s.ToString().c_str());
|
|
|
|
|
exit(1);
|
|
|
|
|
}
|
|
|
|
|
}
|
|
|
|
|
#endif // ROCKSDB_LITE
|
|
|
|
|
if (FLAGS_statistics) {
|
|
|
|
|
dbstats = ROCKSDB_NAMESPACE::CreateDBStatistics();
|
|
|
|
|
}
|
|
|
|
|
if (dbstats) {
|
|
|
|
|
dbstats->set_stats_level(static_cast<StatsLevel>(FLAGS_stats_level));
|
|
|
|
|
}
|
|
|
|
|
FLAGS_compaction_pri_e =
|
|
|
|
|
(ROCKSDB_NAMESPACE::CompactionPri)FLAGS_compaction_pri;
|
|
|
|
|
|
|
|
|
|
std::vector<std::string> fanout = ROCKSDB_NAMESPACE::StringSplit(
|
|
|
|
|
FLAGS_max_bytes_for_level_multiplier_additional, ',');
|
|
|
|
|
for (size_t j = 0; j < fanout.size(); j++) {
|
|
|
|
|
FLAGS_max_bytes_for_level_multiplier_additional_v.push_back(
|
|
|
|
|
#ifndef CYGWIN
|
|
|
|
|
std::stoi(fanout[j]));
|
|
|
|
|
#else
|
|
|
|
|
stoi(fanout[j]));
|
|
|
|
|
#endif
|
|
|
|
|
}
|
|
|
|
|
|
|
|
|
|
FLAGS_compression_type_e =
|
|
|
|
|
StringToCompressionType(FLAGS_compression_type.c_str());
|
|
|
|
|
|
|
|
|
|
FLAGS_wal_compression_e =
|
|
|
|
|
StringToCompressionType(FLAGS_wal_compression.c_str());
|
|
|
|
|
|
|
|
|
|
FLAGS_compressed_secondary_cache_compression_type_e = StringToCompressionType(
|
|
|
|
|
FLAGS_compressed_secondary_cache_compression_type.c_str());
|
|
|
|
|
|
|
|
|
|
#ifndef ROCKSDB_LITE
|
|
|
|
|
// Stacked BlobDB
|
|
|
|
|
FLAGS_blob_db_compression_type_e =
|
|
|
|
|
StringToCompressionType(FLAGS_blob_db_compression_type.c_str());
|
|
|
|
|
|
|
|
|
|
int env_opts = !FLAGS_env_uri.empty() + !FLAGS_fs_uri.empty();
|
|
|
|
|
if (env_opts > 1) {
|
|
|
|
|
fprintf(stderr, "Error: --env_uri and --fs_uri are mutually exclusive\n");
|
|
|
|
|
exit(1);
|
|
|
|
|
}
|
|
|
|
|
|
|
|
|
|
if (env_opts == 1) {
|
|
|
|
|
Status s = Env::CreateFromUri(config_options, FLAGS_env_uri, FLAGS_fs_uri,
|
|
|
|
|
&FLAGS_env, &env_guard);
|
|
|
|
|
if (!s.ok()) {
|
|
|
|
|
fprintf(stderr, "Failed creating env: %s\n", s.ToString().c_str());
|
|
|
|
|
exit(1);
|
|
|
|
|
}
|
|
|
|
|
} else if (FLAGS_simulate_hdd || FLAGS_simulate_hybrid_fs_file != "") {
|
|
|
|
|
//**TODO: Make the simulate fs something that can be loaded
|
|
|
|
|
// from the ObjectRegistry...
|
|
|
|
|
static std::shared_ptr<ROCKSDB_NAMESPACE::Env> composite_env =
|
|
|
|
|
NewCompositeEnv(std::make_shared<SimulatedHybridFileSystem>(
|
|
|
|
|
FileSystem::Default(), FLAGS_simulate_hybrid_fs_file,
|
|
|
|
|
/*throughput_multiplier=*/
|
|
|
|
|
int{FLAGS_simulate_hybrid_hdd_multipliers},
|
|
|
|
|
/*is_full_fs_warm=*/FLAGS_simulate_hdd));
|
|
|
|
|
FLAGS_env = composite_env.get();
|
|
|
|
|
}
|
Hide deprecated, inefficient block-based filter from public API (#9535)
Summary:
This change removes the ability to configure the deprecated,
inefficient block-based filter in the public API. Options that would
have enabled it now use "full" (and optionally partitioned) filters.
Existing block-based filters can still be read and used, and a "back
door" way to build them still exists, for testing and in case of trouble.
About the only way this removal would cause an issue for users is if
temporary memory for filter construction greatly increases. In
HISTORY.md we suggest a few possible mitigations: partitioned filters,
smaller SST files, or setting reserve_table_builder_memory=true.
Or users who have customized a FilterPolicy using the
CreateFilter/KeyMayMatch mechanism removed in https://github.com/facebook/rocksdb/issues/9501 will have to upgrade
their code. (It's long past time for people to move to the new
builder/reader customization interface.)
This change also introduces some internal-use-only configuration strings
for testing specific filter implementations while bypassing some
compatibility / intelligence logic. This is intended to hint at a path
toward making FilterPolicy Customizable, but it also gives us a "back
door" way to configure block-based filter.
Aside: updated db_bench so that -readonly implies -use_existing_db
Pull Request resolved: https://github.com/facebook/rocksdb/pull/9535
Test Plan:
Unit tests updated. Specifically,
* BlockBasedTableTest.BlockReadCountTest is tweaked to validate the back
door configuration interface and ignoring of `use_block_based_builder`.
* BlockBasedTableTest.TracingGetTest is migrated from testing
block-based filter access pattern to full filter access patter, by
re-ordering some things.
* Options test (pretty self-explanatory)
Performance test - create with `./db_bench -db=/dev/shm/rocksdb1 -bloom_bits=10 -cache_index_and_filter_blocks=1 -benchmarks=fillrandom -num=10000000 -compaction_style=2 -fifo_compaction_max_table_files_size_mb=10000 -fifo_compaction_allow_compaction=0` with and without `-use_block_based_filter`, which creates a DB with 21 SST files in L0. Read with `./db_bench -db=/dev/shm/rocksdb1 -readonly -bloom_bits=10 -cache_index_and_filter_blocks=1 -benchmarks=readrandom -num=10000000 -compaction_style=2 -fifo_compaction_max_table_files_size_mb=10000 -fifo_compaction_allow_compaction=0 -duration=30`
Without -use_block_based_filter: readrandom 464 ops/sec, 689280 KB DB
With -use_block_based_filter: readrandom 169 ops/sec, 690996 KB DB
No consistent difference with fillrandom
Reviewed By: jay-zhuang
Differential Revision: D34153871
Pulled By: pdillinger
fbshipit-source-id: 31f4a933c542f8f09aca47fa64aec67832a69738
2 years ago
|
|
|
|
|
|
|
|
// Let -readonly imply -use_existing_db
|
|
|
|
|
FLAGS_use_existing_db |= FLAGS_readonly;
|
|
|
|
|
#endif // ROCKSDB_LITE
|
Hide deprecated, inefficient block-based filter from public API (#9535)
Summary:
This change removes the ability to configure the deprecated,
inefficient block-based filter in the public API. Options that would
have enabled it now use "full" (and optionally partitioned) filters.
Existing block-based filters can still be read and used, and a "back
door" way to build them still exists, for testing and in case of trouble.
About the only way this removal would cause an issue for users is if
temporary memory for filter construction greatly increases. In
HISTORY.md we suggest a few possible mitigations: partitioned filters,
smaller SST files, or setting reserve_table_builder_memory=true.
Or users who have customized a FilterPolicy using the
CreateFilter/KeyMayMatch mechanism removed in https://github.com/facebook/rocksdb/issues/9501 will have to upgrade
their code. (It's long past time for people to move to the new
builder/reader customization interface.)
This change also introduces some internal-use-only configuration strings
for testing specific filter implementations while bypassing some
compatibility / intelligence logic. This is intended to hint at a path
toward making FilterPolicy Customizable, but it also gives us a "back
door" way to configure block-based filter.
Aside: updated db_bench so that -readonly implies -use_existing_db
Pull Request resolved: https://github.com/facebook/rocksdb/pull/9535
Test Plan:
Unit tests updated. Specifically,
* BlockBasedTableTest.BlockReadCountTest is tweaked to validate the back
door configuration interface and ignoring of `use_block_based_builder`.
* BlockBasedTableTest.TracingGetTest is migrated from testing
block-based filter access pattern to full filter access patter, by
re-ordering some things.
* Options test (pretty self-explanatory)
Performance test - create with `./db_bench -db=/dev/shm/rocksdb1 -bloom_bits=10 -cache_index_and_filter_blocks=1 -benchmarks=fillrandom -num=10000000 -compaction_style=2 -fifo_compaction_max_table_files_size_mb=10000 -fifo_compaction_allow_compaction=0` with and without `-use_block_based_filter`, which creates a DB with 21 SST files in L0. Read with `./db_bench -db=/dev/shm/rocksdb1 -readonly -bloom_bits=10 -cache_index_and_filter_blocks=1 -benchmarks=readrandom -num=10000000 -compaction_style=2 -fifo_compaction_max_table_files_size_mb=10000 -fifo_compaction_allow_compaction=0 -duration=30`
Without -use_block_based_filter: readrandom 464 ops/sec, 689280 KB DB
With -use_block_based_filter: readrandom 169 ops/sec, 690996 KB DB
No consistent difference with fillrandom
Reviewed By: jay-zhuang
Differential Revision: D34153871
Pulled By: pdillinger
fbshipit-source-id: 31f4a933c542f8f09aca47fa64aec67832a69738
2 years ago
|
|
|
|
|
|
|
|
if (!FLAGS_seed) {
|
|
|
|
|
uint64_t now = FLAGS_env->GetSystemClock()->NowMicros();
|
|
|
|
|
seed_base = static_cast<int64_t>(now);
|
|
|
|
|
fprintf(stdout, "Set seed to %" PRIu64 " because --seed was 0\n",
|
|
|
|
|
seed_base);
|
|
|
|
|
} else {
|
|
|
|
|
seed_base = FLAGS_seed;
|
|
|
|
|
}
|
|
|
|
|
|
|
|
|
|
if (FLAGS_use_existing_keys && !FLAGS_use_existing_db) {
|
|
|
|
|
fprintf(stderr,
|
|
|
|
|
"`-use_existing_db` must be true for `-use_existing_keys` to be "
|
|
|
|
|
"settable\n");
|
|
|
|
|
exit(1);
|
|
|
|
|
}
|
|
|
|
|
|
|
|
|
|
if (!strcasecmp(FLAGS_compaction_fadvice.c_str(), "NONE"))
|
|
|
|
|
FLAGS_compaction_fadvice_e = ROCKSDB_NAMESPACE::Options::NONE;
|
|
|
|
|
else if (!strcasecmp(FLAGS_compaction_fadvice.c_str(), "NORMAL"))
|
|
|
|
|
FLAGS_compaction_fadvice_e = ROCKSDB_NAMESPACE::Options::NORMAL;
|
|
|
|
|
else if (!strcasecmp(FLAGS_compaction_fadvice.c_str(), "SEQUENTIAL"))
|
|
|
|
|
FLAGS_compaction_fadvice_e = ROCKSDB_NAMESPACE::Options::SEQUENTIAL;
|
|
|
|
|
else if (!strcasecmp(FLAGS_compaction_fadvice.c_str(), "WILLNEED"))
|
|
|
|
|
FLAGS_compaction_fadvice_e = ROCKSDB_NAMESPACE::Options::WILLNEED;
|
|
|
|
|
else {
|
|
|
|
|
fprintf(stdout, "Unknown compaction fadvice:%s\n",
|
|
|
|
|
FLAGS_compaction_fadvice.c_str());
|
|
|
|
|
exit(1);
|
|
|
|
|
}
|
|
|
|
|
|
|
|
|
|
FLAGS_value_size_distribution_type_e =
|
|
|
|
|
StringToDistributionType(FLAGS_value_size_distribution_type.c_str());
|
|
|
|
|
|
|
|
|
|
// Note options sanitization may increase thread pool sizes according to
|
|
|
|
|
// max_background_flushes/max_background_compactions/max_background_jobs
|
|
|
|
|
FLAGS_env->SetBackgroundThreads(FLAGS_num_high_pri_threads,
|
|
|
|
|
ROCKSDB_NAMESPACE::Env::Priority::HIGH);
|
|
|
|
|
FLAGS_env->SetBackgroundThreads(FLAGS_num_bottom_pri_threads,
|
|
|
|
|
ROCKSDB_NAMESPACE::Env::Priority::BOTTOM);
|
|
|
|
|
FLAGS_env->SetBackgroundThreads(FLAGS_num_low_pri_threads,
|
|
|
|
|
ROCKSDB_NAMESPACE::Env::Priority::LOW);
|
|
|
|
|
|
|
|
|
|
// Choose a location for the test database if none given with --db=<path>
|
|
|
|
|
if (FLAGS_db.empty()) {
|
|
|
|
|
std::string default_db_path;
|
|
|
|
|
FLAGS_env->GetTestDirectory(&default_db_path);
|
|
|
|
|
default_db_path += "/dbbench";
|
|
|
|
|
FLAGS_db = default_db_path;
|
|
|
|
|
}
|
|
|
|
|
|
|
|
|
|
if (FLAGS_stats_interval_seconds > 0) {
|
|
|
|
|
// When both are set then FLAGS_stats_interval determines the frequency
|
|
|
|
|
// at which the timer is checked for FLAGS_stats_interval_seconds
|
|
|
|
|
FLAGS_stats_interval = 1000;
|
|
|
|
|
}
|
|
|
|
|
|
|
|
|
|
if (FLAGS_seek_missing_prefix && FLAGS_prefix_size <= 8) {
|
|
|
|
|
fprintf(stderr, "prefix_size > 8 required by --seek_missing_prefix\n");
|
|
|
|
|
exit(1);
|
|
|
|
|
}
|
|
|
|
|
|
|
|
|
|
ROCKSDB_NAMESPACE::Benchmark benchmark;
|
|
|
|
|
benchmark.Run();
|
|
|
|
|
|
|
|
|
|
#ifndef ROCKSDB_LITE
|
|
|
|
|
if (FLAGS_print_malloc_stats) {
|
|
|
|
|
std::string stats_string;
|
|
|
|
|
ROCKSDB_NAMESPACE::DumpMallocStats(&stats_string);
|
|
|
|
|
fprintf(stdout, "Malloc stats:\n%s\n", stats_string.c_str());
|
|
|
|
|
}
|
|
|
|
|
#endif // ROCKSDB_LITE
|
|
|
|
|
|
|
|
|
|
return 0;
|
|
|
|
|
}
|
|
|
|
|
} // namespace ROCKSDB_NAMESPACE
|
|
|
|
|
#endif
|